. 2019 Sep 6:13:303.
doi: 10.3389/fnhum.2019.00303. eCollection 2019.

How Neurophysiological Measures Can be Used to Enhance the Evaluation of Remote Tower Solutions

Affiliations

How Neurophysiological Measures Can be Used to Enhance the Evaluation of Remote Tower Solutions

Pietro Aricò et al. Front Hum Neurosci. .

Abstract

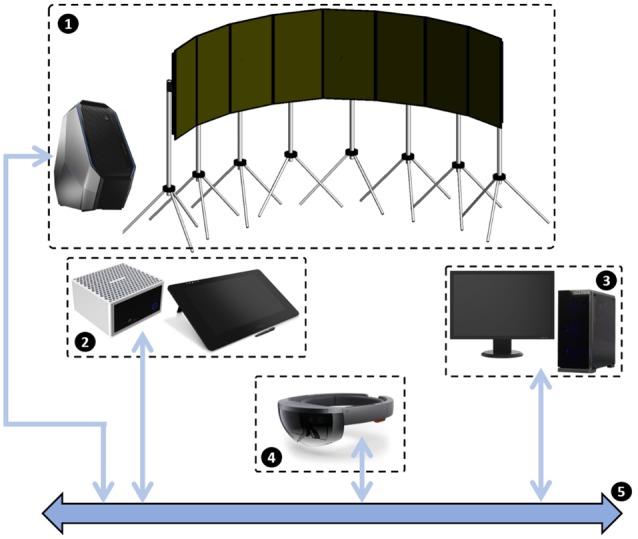
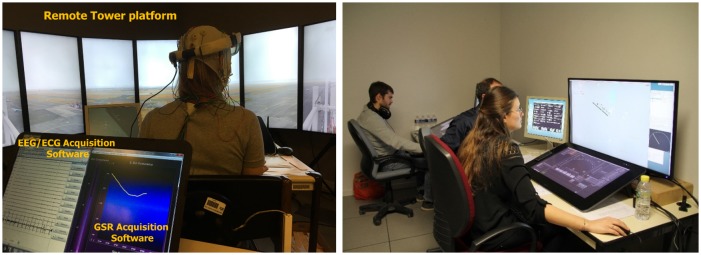
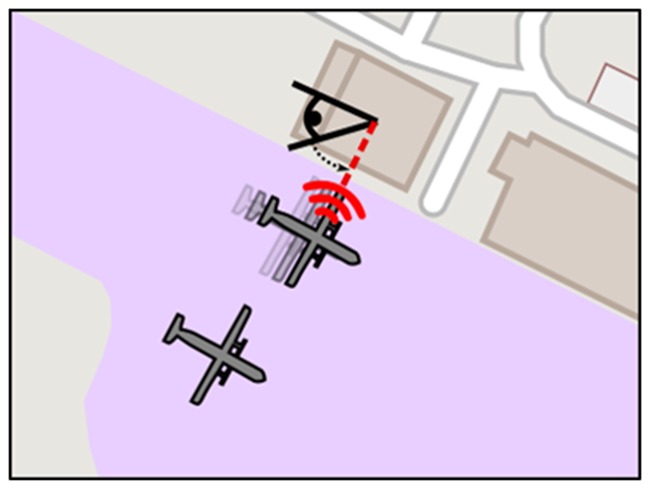
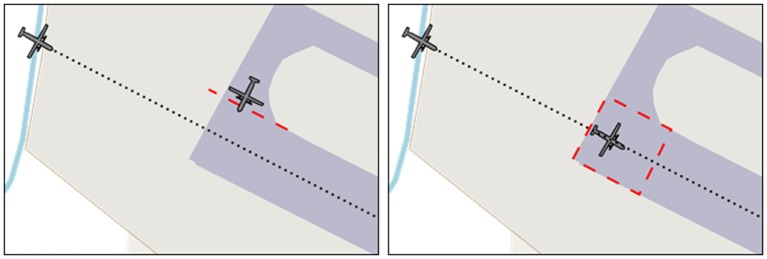
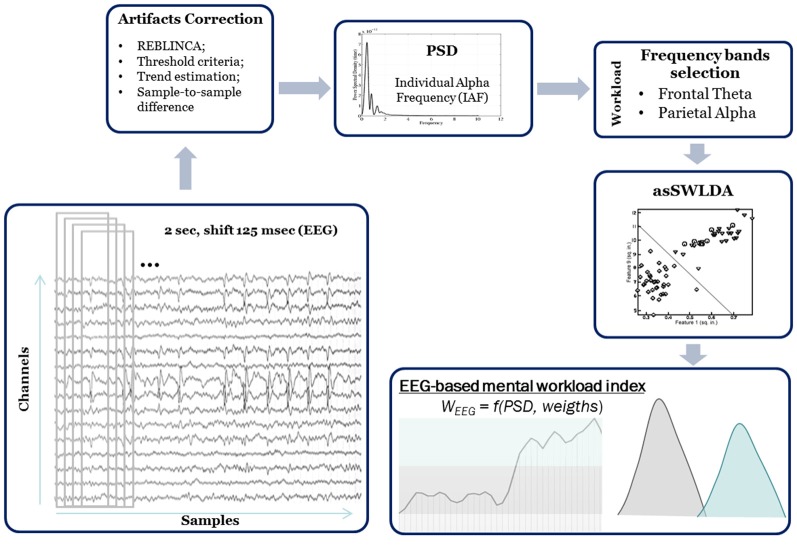
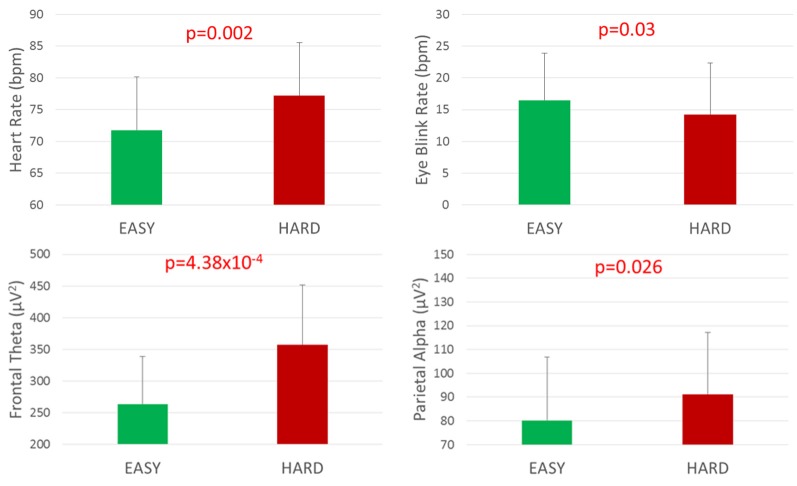
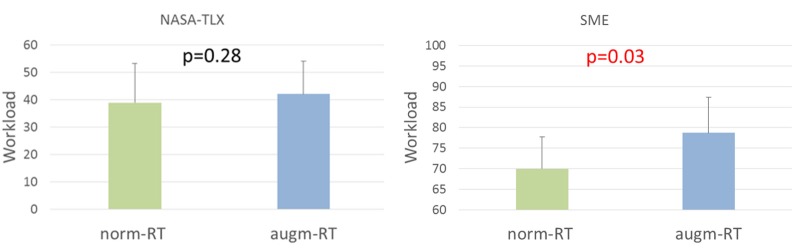
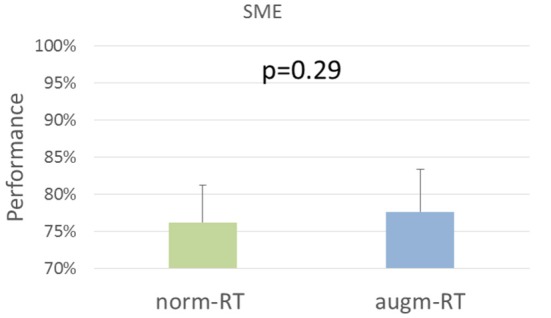
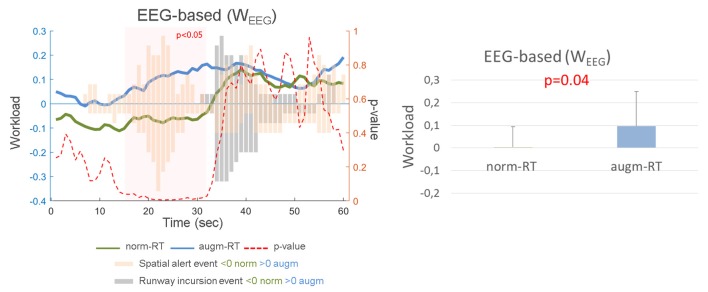
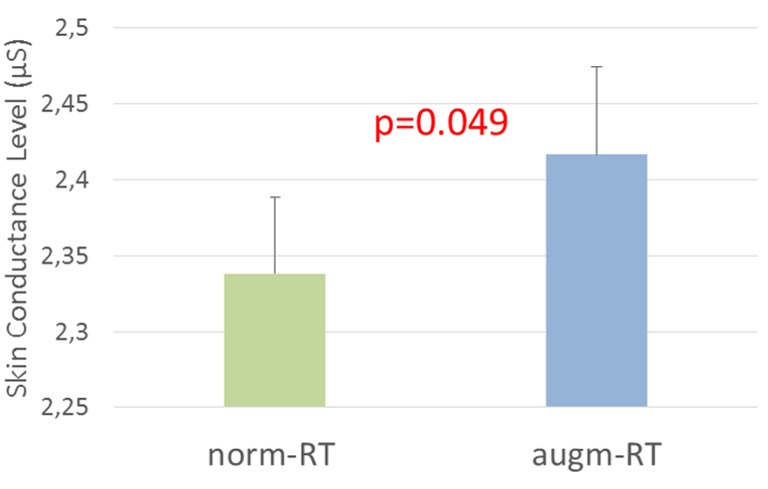
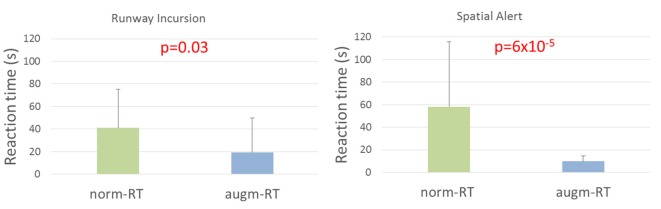
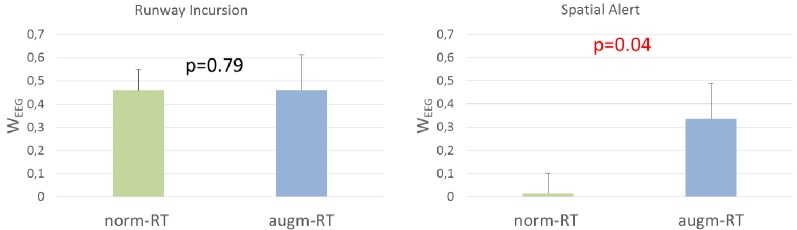
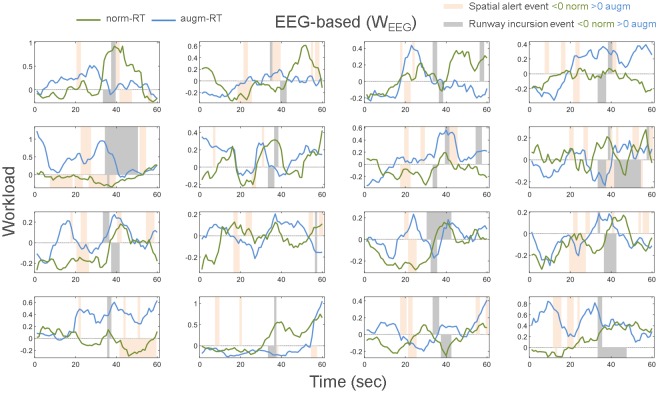
New solutions in operational environments are often, among objective measurements, evaluated by using subjective assessment and judgment from experts. Anyhow, it has been demonstrated that subjective measures suffer from poor resolution due to a high intra and inter-operator variability. Also, performance measures, if available, could provide just partial information, since an operator could achieve the same performance but experiencing a different workload. In this study, we aimed to demonstrate: (i) the higher resolution of neurophysiological measures in comparison to subjective ones; and (ii) how the simultaneous employment of neurophysiological measures and behavioral ones could allow a holistic assessment of operational tools. In this regard, we tested the effectiveness of an electroencephalography (EEG)-based neurophysiological index (WEEG index) in comparing two different solutions (i.e., Normal and Augmented) in terms of experienced workload. In this regard, 16 professional air traffic controllers (ATCOs) have been asked to perform two operational scenarios. Galvanic Skin Response (GSR) has also been recorded to evaluate the level of arousal (i.e., operator involvement) during the two scenarios execution. NASA-TLX questionnaire has been used to evaluate the perceived workload, and an expert was asked to assess performance achieved by the ATCOs. Finally, reaction times on specific operational events relevant for the assessment of the two solutions, have also been collected. Results highlighted that the Augmented solution induced a local increase in subjects performance (Reaction times). At the same time, this solution induced an increase in the workload experienced by the participants (WEEG). Anyhow, this increase is still acceptable, since it did not negatively impact the performance and has to be intended only as a consequence of the higher engagement of the ATCOs. This behavioral effect is totally in line with physiological results obtained in terms of arousal (GSR), that increased during the scenario with augmentation. Subjective measures (NASA-TLX) did not highlight any significant variation in perceived workload. These results suggest that neurophysiological measure provide additional information than behavioral and subjective ones, even at a level of few seconds, and its employment during the pre-operational activities (e.g., design process) could allow a more holistic and accurate evaluation of new solutions.

Keywords: ECG; EEG; GSR; asSWLDA; eye blink; machine learning; mental workload; remote tower air traffic management.


Figures

Figure 1
Figure 1
The general setup used for the experiment. (1) The panoramic view to display airport vicinity using eight UHD screens and the Alienware Area51 computer (2) and (3) Computers and screens to display respectively ground and air radars (4) Microsoft HoloLens device to retrieve user’s head movements (5) ENAC Ivy bus software to make all these equipment communicate together.
Figure 2
Figure 2
The wooden chair on which two tactile transducers have been attached to spread vibrotactile feedback (see the two red circles).
Figure 3
Figure 3
Experimental setup (left) and pseudo-pilots positions used during the experiment (right). Pseudo-pilots have given written informed consent for the publication of this image.
Figure 4
Figure 4
Alert risen by an unauthorized aircraft movement. The alert is spatialized, attracting the gaze of the user in the direction of the abnormal situation.
Figure 5
Figure 5
Left: a situation in which the aircraft located on the ground is stopped behind the holding point, generating no runway incursion situation. Right: the aircraft located on the ground entered the runway by crossing the holding; because of its location on the runway while another aircraft is about to land (on the final approach segment), this situation is a runway incursion.
Figure 6
Figure 6
Electroencephalography (EEG) processing chain for the WEEG index computation.
Figure 7
Figure 7
Neurophysiological measures between EASY and HARD conditions. Significant p-values have been marked in red. Values showed are mean and standard error, at a confidence interval of 0.95.
Figure 8
Figure 8
Subjective post-run workload scores assessed by experimental subjects (i.e., WNASA-TLX, on the left) and subject matter expert (SME; i.e., WSME, on the right) values for each condition. Significant p-values have been marked in red. Values showed are mean and standard deviation.
Figure 9
Figure 9
Performance values assessed by the SME for each experimental condition. Values showed are mean and standard deviation.
Figure 10
Figure 10
WEEG score exhibited a significant increase in the experienced workload during the augm-RT condition with respect to the norm-RT one, which is consistent with the results provided by the SME workload assessment. On the left side it was reported a grand average of the WEEG index over all the subjects, for each experimental scenario. We reported the events distribution for all the subjects, for the whole time duration (orange Spatial Alert events, and gray Runway incursion ones). Bars higher than 0 are referred to augm-RT scenario events, while bars lower than 0 are referred to norm-RT scenario events. It has also been reported in red the point by point p-value, highlighting that the significance was reached (i.e., red transparent rectangle) just around the appearance of the spatial sound events. On the contrary, during the appearance of Runway incursion events (i.e., gray bars), the workload increased in both the scenarios, in fact statistics did not show any significant trend. On the right it has been reported the mean and standard deviation of WEEG index related to the two scenarios.
Figure 11
Figure 11
The analysis of Skin Conductance Level (SCL) of the galvanic skin response (GSR) signal revealed an increase in the arousal during the augm-RT condition with respect to the norm-RT one. Significant p-values have been marked in red. Values showed are mean and standard deviation.
Figure 12
Figure 12
Reaction times recorded by the simulation interface exhibited a significant decrease of the time needed by the subjects to identify and react to the specific event, highlighting a local increase in performance induced by the specific augmented solutions. Significant p-values have been marked in red. Values showed are mean and standard deviation.
Figure 13
Figure 13
WEEG values calculated during the specific events highlighted no significant difference during the Runway incursion event, and a significant increase during the Spatial Alert event. Significant p-values have been marked in red. Values showed are mean and standard deviation.
Figure 14
Figure 14
WEEG index shape for each of the 16 experimental subjects and related operational events appearance (i.e., Spatial Alert and Runway Incursion) have been reported. In particular, time duration of each event has been reported for each of the two scenarios (i.e., norm-RT and augm-RT). Bars higher than 0 are referred to augm-RT scenario events, while bars lower than 0 are referred to norm-RT scenario events.

References

    1. Aloise F., Aricò P., Schettini F., Salinari S., Mattia D., Cincotti F. (2013). Asynchronous gaze-independent event-related potential-based brain-computer interface. Artif. Intell. Med. 59, 61–69. 10.1016/j.artmed.2013.07.006 - DOI - PubMed
    1. Arent S. M., Landers D. M. (2003). Arousal, anxiety, and performance: a reexamination of the inverted-U hypothesis. Res. Q. Exerc. Sport 74, 436–444. 10.1080/02701367.2003.10609113 - DOI - PubMed
    1. Aricò P., Borghini G., Di Flumeri G., Colosimo A., Bonelli S., Golfetti A., et al. . (2016a). Adaptive automation triggered by EEG-based mental workload index: a passive brain-computer interface application in realistic air traffic control environment. Front. Hum. Neurosci. 10:539. 10.3389/fnhum.2016.00539 - DOI - PMC - PubMed
    1. Aricò P., Borghini G., Di Flumeri G., Colosimo A., Pozzi S., Babiloni F. (2016b). A passive brain-computer interface application for the mental workload assessment on professional air traffic controllers during realistic air traffic control tasks. Prog. Brain Res. 228, 295–328. 10.1016/bs.pbr.2016.04.021 - DOI - PubMed
    1. Aricò P., Borghini G., Di Flumeri G., Bonelli S., Golfetti A., Graziani I., et al. . (2017a). Human factors and neurophysiological metrics in air traffic control: a critical review. IEEE Rev. Biomed. Eng. 10, 250–263. 10.1109/rbme.2017.2694142 - DOI - PubMed

LinkOut - more resources