. 2019 Sep 4:10:1109.
doi: 10.3389/fphys.2019.01109. eCollection 2019.

NMR Metabolomics and Random Forests Models to Identify Potential Plasma Biomarkers of Blood Stasis Syndrome With Coronary Heart Disease Patients

Affiliations

NMR Metabolomics and Random Forests Models to Identify Potential Plasma Biomarkers of Blood Stasis Syndrome With Coronary Heart Disease Patients

Lin-Lin Zhao et al. Front Physiol. .

Abstract

Background: Coronary heart disease (CHD) remains highly prevalent and is one of the largest causes of death worldwide. Blood stasis syndrome (BSS) is the main syndrome associated with CHD. However, the underlying biological basis of BSS with CHD is not yet been fully understood.

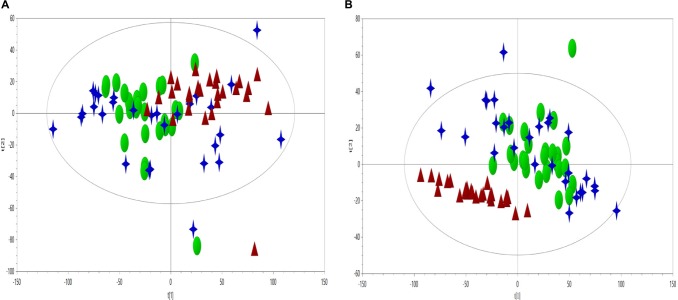
Materials and methods: We proposed a metabolomics method based on 1H-NMR and random forest (RF) models to elucidate the underlying biological basis of BSS with CHD. Firstly, 58 cases of CHD patients, including 27 BSS and 31 phlegm syndrome (PS), and 26 volunteers were recruited from Xiangya Hospital affiliated to Central South University. A 1 mL venous blood sample was collected for NMR analysis. Secondly, principal component analysis (PCA), partial least squares discrimination analysis (PLS-DA) and RF was applied to observe the classification of each group, respectively. Finally, RF and multidimensional scaling (MDS) were utilized to discover the plasma potential biomarkers in CHD patients and CHD-BSS patients.

Results: The models constructed by RF could visually discriminate BSS from PS in CHD patients. Simultaneously, we obtained 12 characteristic metabolites, including lysine, glutamine, taurine, tyrosine, phenylalanine, histidine, lipid, citrate, choline, lactate, α-glucose, β-glucose related to the CHD patients, and Choline, β-glucose, α-glucose and tyrosine were considered as potential biomarkers of CHD-BSS.

Conclusion: The combining of 1H-NMR profiling with RF models was a useful approach to analyze complex metabolomics data (should be deleted). Choline, β-glucose, α-glucose and tyrosine were considered as potential biomarkers of CHD-BSS.

Keywords: Systems Biology; ZHENG types; blood stasis syndrome; coronary heart disease; metabolomics; random forests.


Figures

FIGURE 1
FIGURE 1
Typical cpmgpr1d spectra (600 MHz) of (A) CHD patient, (B) control from plasma samples (the region at δ5.5–9.0 was expanded for 16 times). Key: 1, lipid (CH3); 2, leucine and isoleucine; 3, valine; 4. isoleucine; 5, 3-hydroxybutyrate; 6, lipid (CH2); 7, lactate; 8, lysine; 9, alanine; 10, lipid (CH2CH2CO); 11, lysine and arginine; 12, leucine; 13, lysine and arginine; 14, acetate; 15, acetic acid (CH3COOH); 16, lipid (CH2C=C); 17, N-acetyl glycoproteins (NAG) 18, glutamate; 19, glutamine; 20, acetoacetate; 21, lipid (CH2C = O); 22, pyruvate; 23, glutamate; 24, succinate; 25, glutamine; 26, citrate; 27, Ca-EDTA; 28, citrate; 29, Mg-EDTA; 30, lipid (C=CCH2C=C); 31, trimethylamine; 32, lysine; 33, creatine; 34, creatinine; 35, Ca-EDTA; 36, choline and GPC, glycerophosphocholine (GPC) and phosphocholine (PC); 37, free-EDTA; 38, Mg-EDTA; 39, taurine; 40, glucose and amino acid; 41, α-glucose and taurine; 42, β-glucose; 43, α-glucose; 44, free-EDTA; 45, choline; 46, α-glucose; 47, β-glucose; 48, α-glucose; 49, α-glucose; 50, β-glucose; 51, tyrosine; 52, phenylalanine; 53, histidine; 54, choline; 55, TG; 56, lactate; 57, TG; 58, β-glucose; 59, H2O; 60, TG; 61, α-glucose; 62, lipid (CH = CH); 63, urea; 64, tyrosine; 65, histidine; 66, tyrosine; 67, phenylalanine; 68, histidine; 69, formate.
FIGURE 2
FIGURE 2
PCA scores plot (A, R2X = 0.636, Q2 = 0.560) and PLS-DA scores plot (B, R2X = 0.599, Q2 = 0.318, R2Y = 0.37) derived from NMR data to compare the metabolome of the control (triangles, red), CHD–BSS (circles, green) and CHD–PS (stars, blue).
FIGURE 3
FIGURE 3
The MDS plot (A) for plasma profiles derived from NMR data for control (cross, blue), CHD–BSS (circles, black) and CHD–PS (squares, red). Plot of OOB error for RF classification of the three groups (B).
FIGURE 4
FIGURE 4
The MDS plot of (A) control (blue) and CHD (red), (B) control and CHD–BSS (green), (C) control and CHD–NBSS (yellow), and (D) CHD–BSS and CHD–NBSS. The VIM plot of (a) control and CHD, (b) control and CHD–BSS, (c) control and CHD–NBSS, and (d) CHD–BSS and CHD–NBSS obtained by random forest were shown in the right.
FIGURE 5
FIGURE 5
An overview of the metabolic pathway alterations related to CHD. Metabolite levels through color coding as follows: red, increase; green, decrease.

Similar articles

Cited by

References

    1. Ansar S., Koska J., Reaven P. D. (2011). Postprandial hyperlipidemia, endothelial dysfunction and cardiovascular risk: focus on incretins. Cardiovasc. Diabetol. 10:61. 10.1186/1475-2840-10-61 - DOI - PMC - PubMed
    1. Barderas M. G., Laborde C. M., Posada M., Cuesta F., Zubiri I., Vivanco F., et al. (2011). Metabolomic profiling for identification of novel potential biomarkers in cardiovascular diseases. J. Biomed Biotechnol. 2011:790132. 10.1155/2011/790132 - DOI - PMC - PubMed
    1. Breiman L. (2001). Random forests. Mach. Learn. 45 5–21.
    1. Brindle J. T., Antti H., Holmes E., Tranter G., Nicholson J. K., Bethell H. W., et al. (2002). Rapid and noninvasive diagnosis of the presence and severity of coronary heart disease using 1H-NMR-based metabonomics. Nat. Med. 8 1439–1444. - PubMed
    1. Dungan K. M. (2008). 1,5-anhydroglucitol (GlycoMark) as a marker of shortterm glycemic control and glycemic excursions. Expert Rev. Mol. Diagn. 8 9–19. 10.1586/14737159.8.1.9 - DOI - PubMed