. 2019 Sep 10:10:1128.
doi: 10.3389/fphys.2019.01128. eCollection 2019.

Cardiotonic Pills Plus Recombinant Human Prourokinase Ameliorates Atherosclerotic Lesions in LDLR-/- Mice

Affiliations

Cardiotonic Pills Plus Recombinant Human Prourokinase Ameliorates Atherosclerotic Lesions in LDLR-/- Mice

Jing-Na Deng et al. Front Physiol. .

Abstract

Aim: This study was to explore the protective effects of cardiotonic pills (CP) or/and recombinant human prourokinase (proUK)on the atherosclerosis and the potential underlying mechanism.

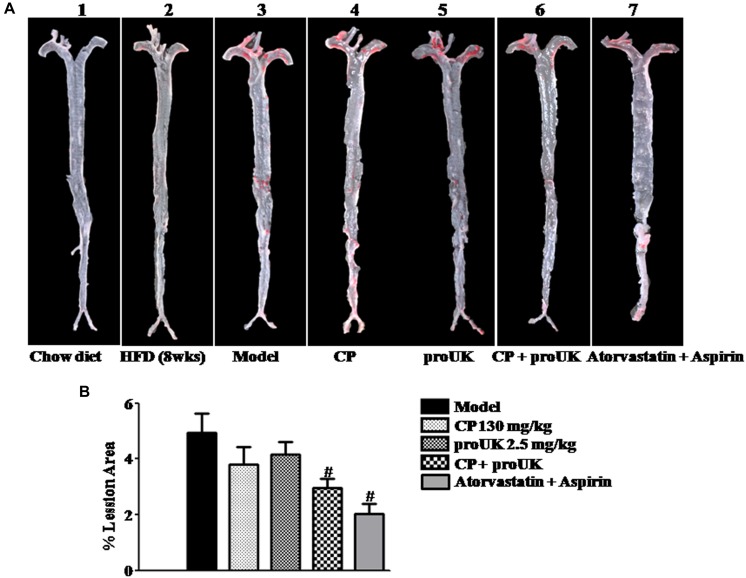
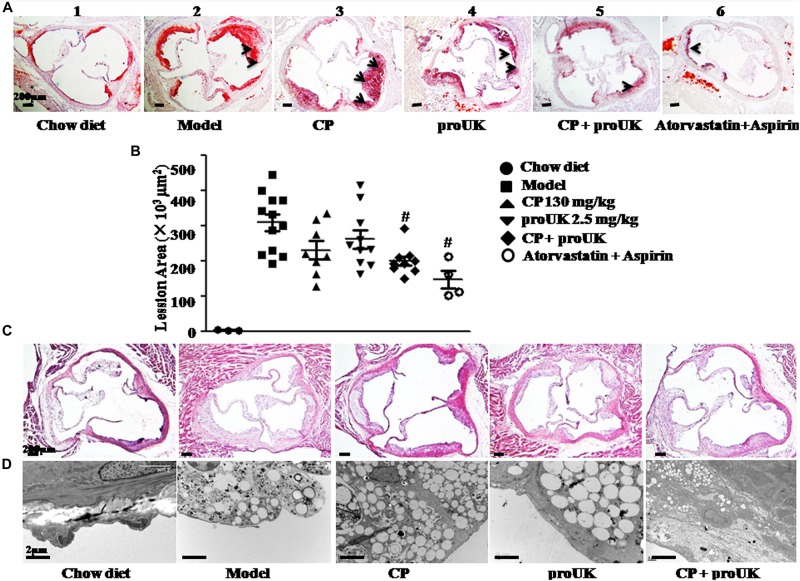
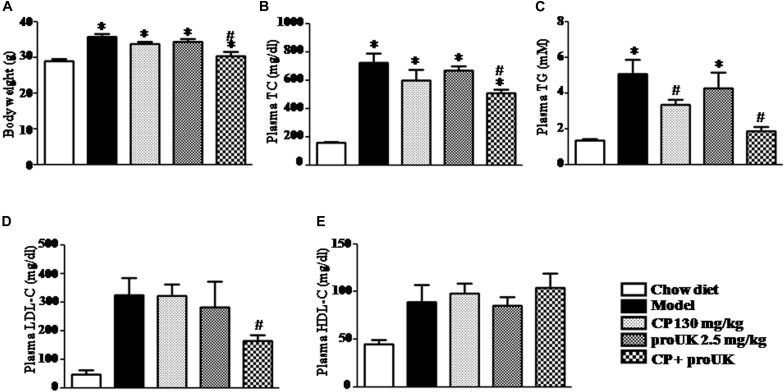
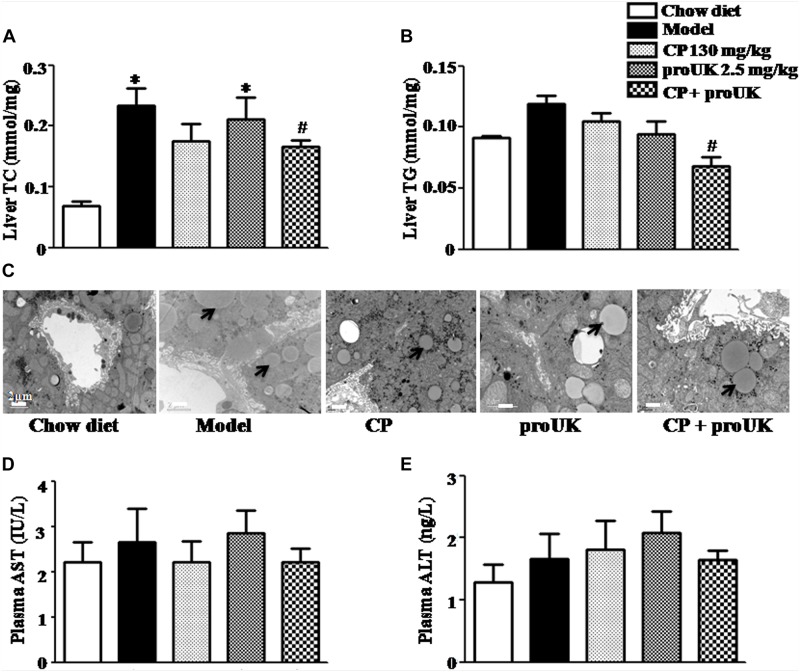
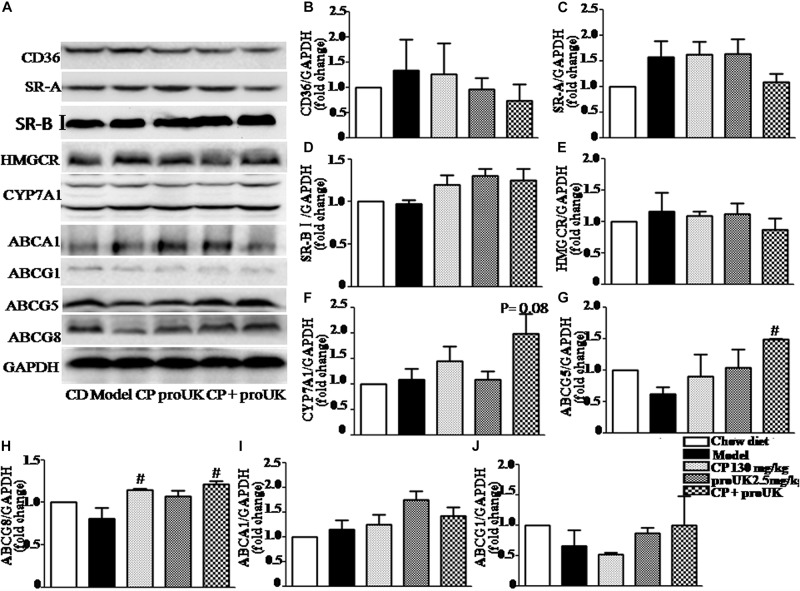
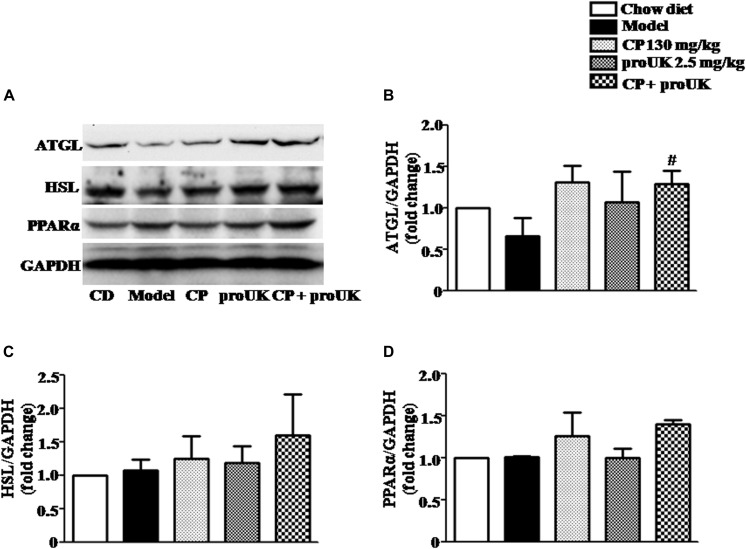
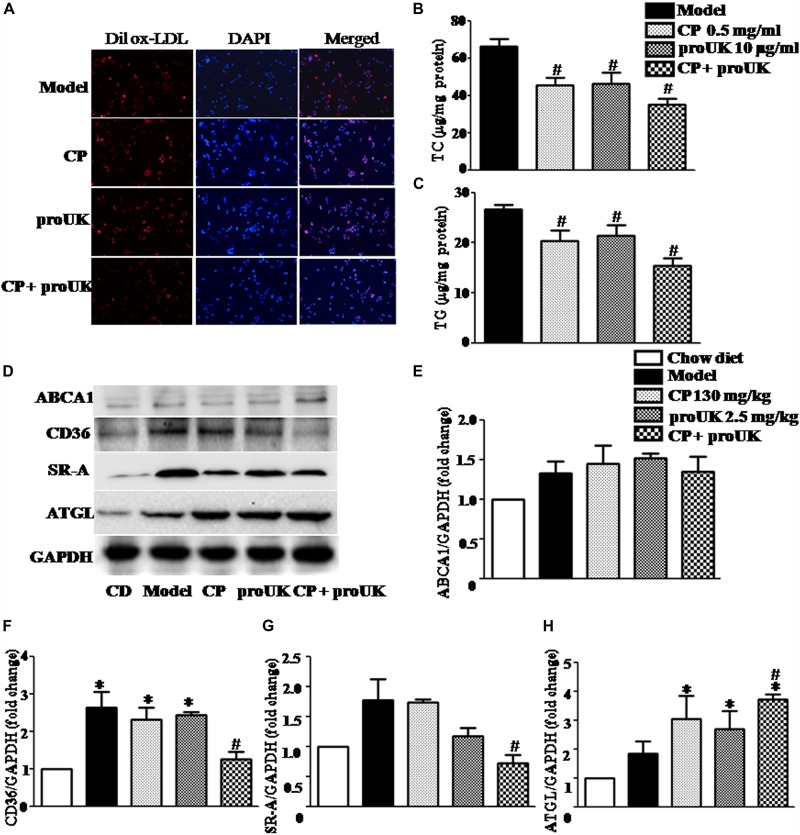
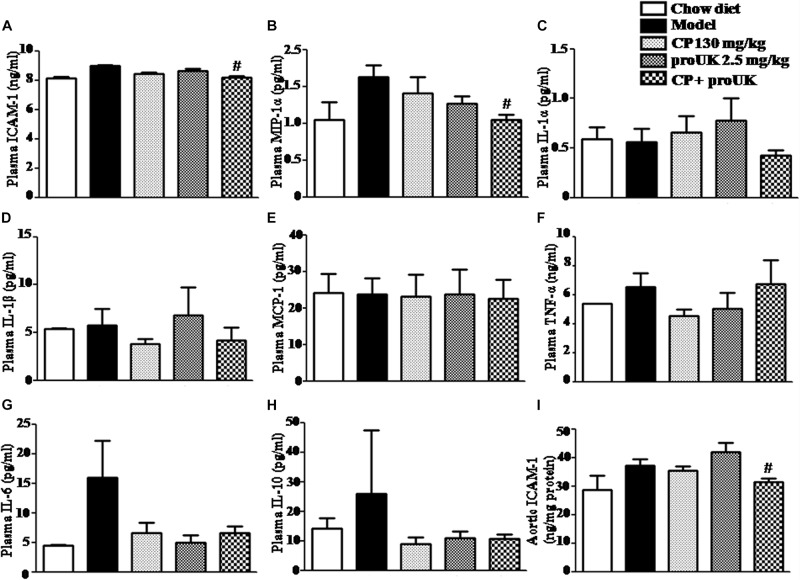
Methods and results: Atherosclerosis was induced in LDLR-/- mice by high fat diet contained 20% lard and 0.5% cholesterol. Daily oral administration of CP (130 mg/kg) or/and intravenous injection of proUK (2.5 mg/kg, twice a week) began at 8 weeks after feeding with high fat diet and continued for 4 weeks. CP alone treatment markedly decreased plasma triglyceride, but did not ameliorate atherosclerosis plaque. No effect was observed for proUK alone on any endpoints tested. CP plus proUK induced a significantly reduction in the atherosclerotic lesions, along with decreased levels of total cholesterol, triglyceride in the plasma. CP plus proUK inhibited the elevated hepatic total cholesterol and triglyceride in high fat diet-fed LDLR-/- mice, up-regulating the expressions of ATP-binding cassette gene 5 and 8, and adipose triglyceride lipase. In the aorta, CP plus proUK inhibited the expression of scavenger receptor A and CD36 in LDLR-/- mice. In addition, we observed that systemic inflammation was inhibited, manifested downregulation of plasma macrophage inflammatory protein-1α and intercellular cell adhesion molecule-1.

Conclusion: CP plus proUK effectively attenuated atherosclerosis plaque in LDLR-/- mice, which is associated with normalizing the lipid metabolism in the liver and aorta, reducing phagocytosis of receptor-mediated modified-LDL uptake and inhibiting systemic inflammation.

Keywords: ATP-binding cassette gene 8; CD36; adipose triglyceride lipase; atherosclerosis; inflammation; scavenger receptor A.


Figures

FIGURE 1
FIGURE 1
CP plus proUK inhibits the development of atherosclerosis in LDLR–/– mice. High fat diet-fed LDLR–/– mice were randomly divided into 4 groups and received CP orally or/and proUK injection. (A) Representative images of en face Oil Red O staining of the full length of aorta of LDLR/ mice from Chow diet group (A-1), n = 3. High fat diet-fed mice for 8 weeks group (A-2), n = 2. Model group (A-3), n = 12. CP + HFD group (A-4), n = 12. proUK + HFD group (A-5), n = 12. CP plus proUK group (A-6), n = 12. Atorvastatin + Aspirin group (A-7), n = 8. (B) Percent lesion area of aorta in different groups. Data are presented as the percentages of total en face aortic area. n = 10. #P < 0.05 vs. Model mice.
FIGURE 2
FIGURE 2
CP plus proUK reduces atherosclerosis lesion area in aortic root of LDLR–/– mice. At the end of the treatment, aortic roots were prepared for transmission electron microscopy or as 7-μm frozen cross sections and stained with HE or Oil Red O solution. (A) Oil Red O staining of the left ventricular outflow tract in LDLR–/– mice from Chow diet group (A-1), n = 3, Model group (A-2), n = 10, CP + HFD group (A-3), n = 8, proUK + HFD group (A-4), n = 10, CP + proUK group (A-5), n = 8. Atorvastatin + Aspirin group (A-6), n = 4, Bar = 200 μm. The arrow shows the atherosclerosis plaque. (B) The statistic results of Oil Red O staining atherosclerosis lesions. n = 8–10. #P < 0.05 vs. Model mice. (C) HE staining of the left ventricular outflow tract in LDLR/ mice from Chow diet group (B-1), Model group (B-2), CP + HFD group (B-3), proUK + HFD group (B-4), CP + proUK group (B-5). Bar = 200 μm. (D) Transmission electron microscopic images of the aortic arch in LDLR–/– mice from Chow diet group (C-1), Model group (C-2), CP + HFD group (C-3), proUK + HFD group (C-4), CP + proUK group (C-5). Bar = 2 μm.
FIGURE 3
FIGURE 3
CP plus proUK attenuates the increase in body weight and plasma TG, TC and LDL-C in the high fat diet-induced mice. (A) The body weight at the end of experiment. (B) Plasma TC level in different groups mice. (C) Plasma TG level in different groups mice. (D) Plasma LDL-C level in different groups mice. (E) Plasma HDL-C level in different groups mice. Total cholesterol, triglycerides, LDL-c, and HDL-c were quantified by enzymatic assays. The values are presented as the means SEM. n = 10. P < 0.05 vs. Chow diet mice, #P < 0.05 vs. Model mice.
FIGURE 4
FIGURE 4
CP plus proUK attenuates hepatic lipid deposition and increase in TC and TG while does not affect liver function in high fat diet-fed LDLR–/– mice. (A) Hepatic TG levels in different groups. (B) Hepatic TC levels in different groups. (C) Transmission electron microscopic images of the sinusoids in different groups. Bar = 2 μm. (D) AST activity in plasma from different groups. (E) ALT activity in plasma from different group. Data are mean ± SEM (n = 8). The arrow shows the lipid droplet. P < 0.05 vs. Chow diet mice, #P < 0.05 vs. Model mice.
FIGURE 5
FIGURE 5
Effect of CP plus proUK on the proteins associated with lipid metabolism in the livers of LDLR/ mice. (A) Western blotting of CD36, SR-A, SR-BI, ABCA1, ABCG1, ABCG5, ABCG8, HMGCR, and CYP7A1 in the livers of LDLR/ mice from different groups. (B–D) The quantitative analysis of the expression of scavenger receptor CD36, SR-A, SR-BI in the liver from different groups. (E) The quantitative analysis of the expression of cholesterol synthesis rate-limiting enzyme HMGCR in the liver from different groups. (F) The quantitative analysis of CYP7A1 expression in the liver from different groups. (G) The quantitation of the ratio betweenABCG5 protein/GAPDH protein in the liver from different groups. (H) The quantitation of the ratio betweenABCG8 protein/GAPDH protein in the liver from different groups. (I) The quantitative analysis of ABCA1 expression in the liver from different groups. (J) The quantitative analysis of ABCG1 expression in the liver from different groups. n = 5. #P < 0.05 vs. Model mice.
FIGURE 6
FIGURE 6
Effect of treatment with CP plus proUK on the expression of hepatic triglyceride metabolism-related proteins in the liver. (A) Western blot of the liver protein levels of ATGL, HSL and PPARα. (B) The quantitative analysis of ATGL expression in the liver from different groups. (C) The quantitative analysis of HSL expression in the liver from different groups. (D) The quantitative analysis of PPARα expression in the liver from different groups. Data are presented as the mean ± SEM. n = 5. #P < 0.05 vs. Model mice.
FIGURE 7
FIGURE 7
CP plus proUK decreases the accumulation of lipids in RAW264.7 macrophages and the levels of CD36 and SRA in the aorta of LDLR–/– mice. (A) The accumulation of lipid droplets in RAW264.7 macrophages. (B) The effect of CP or/with proUK on the level of TC in RAW264.7 macrophages. (C) The effect of CP or/with proUK on the level of TG in RAW264.7 macrophages. (D) Western blot of ABCA1, CD36, SRA1 and ATGL from the aorta in LDLR–/– mice from different groups. (E) The quantitative analysis of ABCA1 expression in aorta from different groups. (F) The quantitative analysis of CD36 expression in aorta from different groups. (G) The quantitative analysis of SR-A expression in aorta from different groups. (H) The quantitative analysis of ATGL expression in aorta from different groups. Data are presented as the mean ± SEM. n = 4. P < 0.05 vs. Chow diet mice, #P < 0.05 vs. Model mice.
FIGURE 8
FIGURE 8
Effect of CP plus proUK on plasma inflammatory cytokine levels in LDLR–/– mice. (A) Plasma ICAM-1 detected by ELISA in LDLR–/– mice from different groups. (B) Plasma MIP-1α in LDLR–/– mice from various groups. (C) Plasma IL-α in LDLR–/– mice from various groups. (D) Plasma IL-1β in LDLR–/– mice from various groups. (E) Plasma MCP-1 in LDLR–/– mice from various groups. (F) Plasma TNF-α in LDLR–/– mice from various groups. (G) Plasma IL-6 in LDLR–/– mice from various groups. (H) Plasma IL-10 in LDLR–/– mice from various groups. (B–H) All the data were acquired by Flow cytometer. (I) The concentrations of aortic ICAM-1 protein measured by ELISA in LDLR–/– mice from various groups. The values are presented as the means ± SEM, n = 8–12. #P < 0.05 vs. Model mice.

Similar articles

Cited by

References

    1. Alonso A., Yin X., Roetker N. S., Magnani J. W., Kronmal R. A., Ellinor P. T., et al. (2014). Blood lipids and the incidence of atrial fibrillation: the multi-ethnic study of atherosclerosis and the Framingham heart study. J. Am. Heart Assoc. 3:e001211. 10.1161/JAHA.114.001211 - DOI - PMC - PubMed
    1. Buchebner M., Pfeifer T., Rathke N., Chandak P. G., Lass A., Schreiber R., et al. (2010). Cholesteryl ester hydrolase activity is abolished in HSL-/- macrophages but unchanged in macrophages lacking KIAA1363. J. Lipid Res. 51 2896–2908. 10.1194/jlr.M004259 - DOI - PMC - PubMed
    1. Buers I., Robenek H., Lorkowski S., Nitschke Y., Severs N. J., Hofnagel O. (2009). TIP47, a lipid cargo protein involved in macrophage triglyceride metabolism. Arterioscler., Thromb. Vasc. Biol. 29 767–773. 10.1161/ATVBAHA.108.182675 - DOI - PubMed
    1. Castelli W. P., Garrison R. J., Wilson P. W., Abbott R. D., Kalousdian S., Kannel W. B. (1986). Incidence of coronary heart disease and lipoprotein cholesterol levels. The Framingham Study. Jama 256 2835–2838. 10.1001/jama.256.20.2835 - DOI - PubMed
    1. Chen Y. L., Hu C. S., Lin F. Y., Chen Y. H., Sheu L. M., Ku H. H., et al. (2006). Salvianolic acid B attenuates cyclooxygenase-2 expression in vitro in LPS-treated human aortic smooth muscle cells and in vivo in the apolipoprotein-E-deficient mouse aorta. J. Cell. Biochem. 98 618–631. 10.1002/jcb.20793 - DOI - PubMed