. 2019 Sep 4:10:2047.
doi: 10.3389/fmicb.2019.02047. eCollection 2019.

Interaction Between Conservation Tillage and Nitrogen Fertilization Shapes Prokaryotic and Fungal Diversity at Different Soil Depths: Evidence From a 23-Year Field Experiment in the Mediterranean Area

Affiliations

Interaction Between Conservation Tillage and Nitrogen Fertilization Shapes Prokaryotic and Fungal Diversity at Different Soil Depths: Evidence From a 23-Year Field Experiment in the Mediterranean Area

Gaia Piazza et al. Front Microbiol. .

Abstract

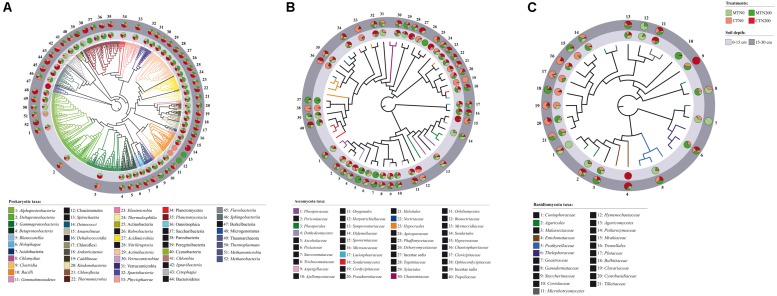
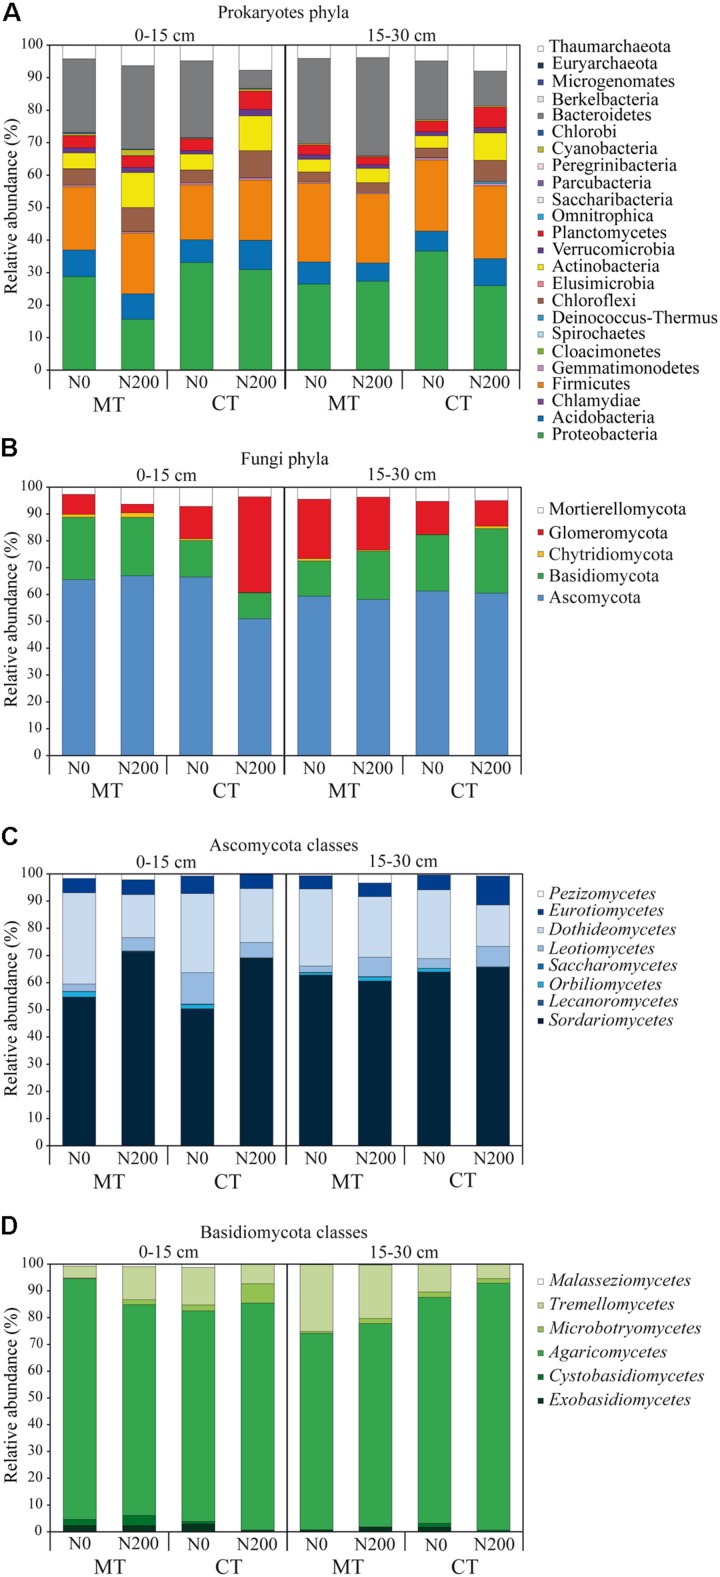
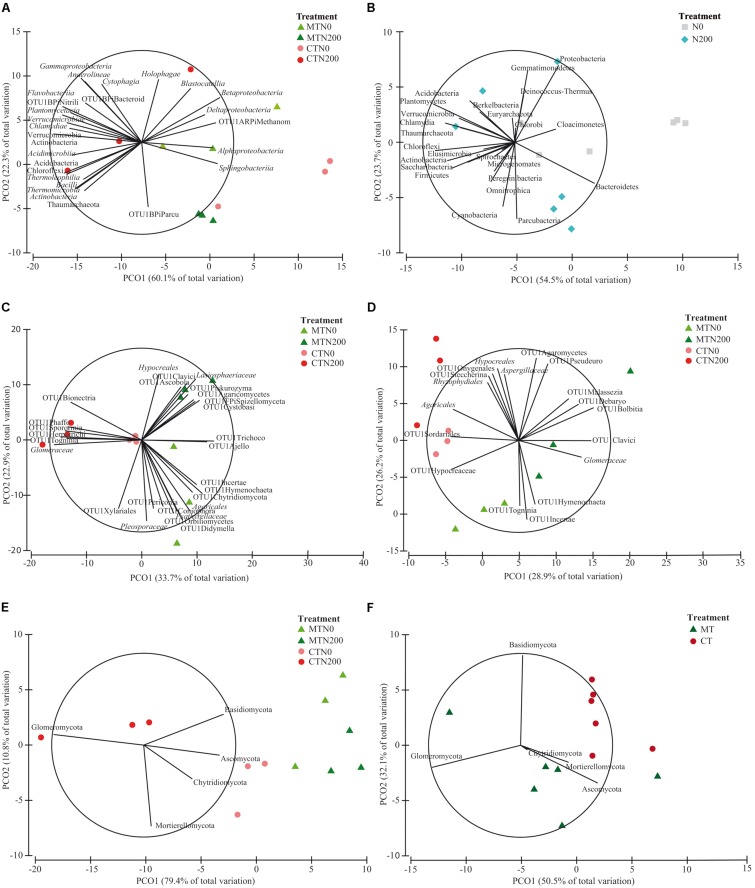
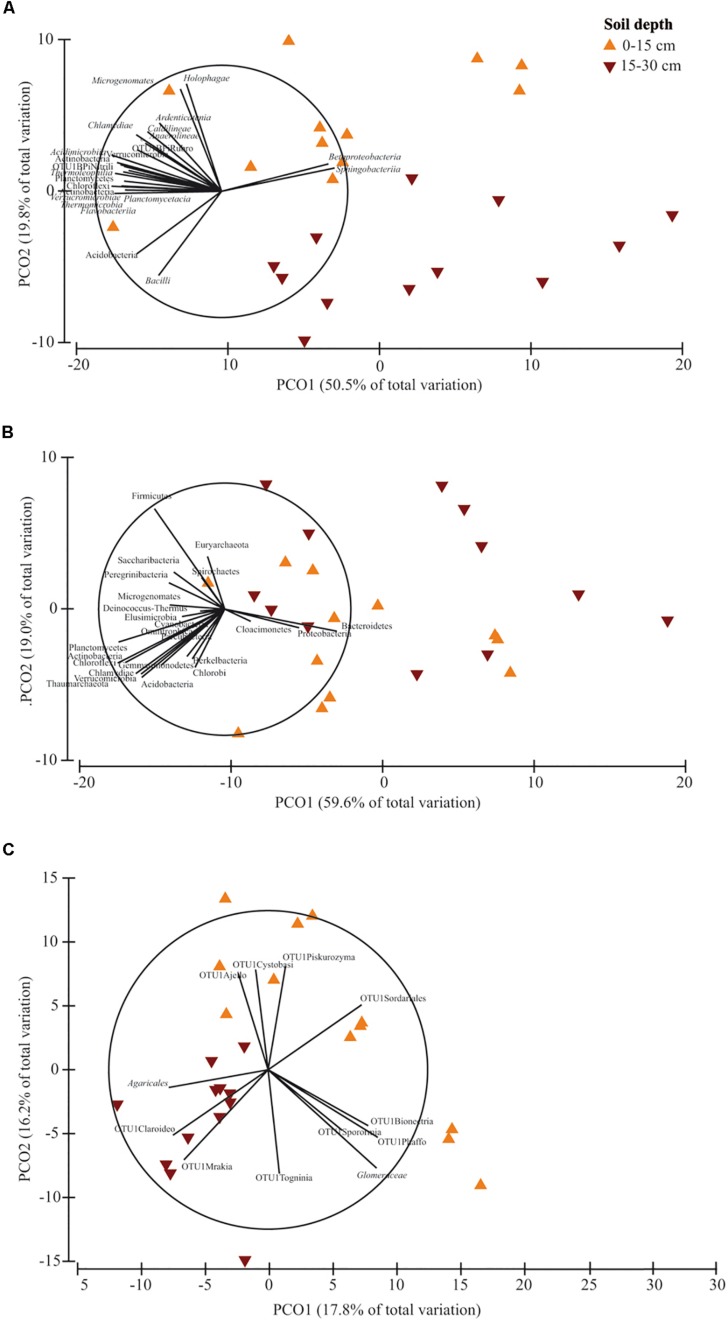
Soil biodiversity accomplishes key roles in agro-ecosystem services consisting in preserving and enhancing soil fertility and nutrient cycling, crop productivity and environmental protection. Thus, the improvement of knowledge on the effect of conservation practices, related to tillage and N fertilization, on soil microbial communities is critical to better understand the role and function of microorganisms in regulating agro-ecosystems. In the Mediterranean area, vulnerable to climate change and suffering for management-induced losses of soil fertility, the impact of conservation practices on soil microbial communities is of special interest for building mitigation and adaptation strategies to climate change. A long-term experiment, originally designed to investigate the effect of tillage and N fertilization on crop yield and soil organic carbon, was utilized to understand the effect of these management practices on soil prokaryotic and fungal community diversity. The majority of prokaryotic and fungal taxa were common to all treatments at both soil depths, whereas few bacterial taxa (Cloacimonates, Spirochaetia and Berkelbacteria) and a larger number of fungal taxa (i.e., Coniphoraceae, Debaryomycetaceae, Geastraceae, Cordicypitaceae and Steccherinaceae) were unique to specific management practices. Soil prokaryotic and fungal structure was heavily influenced by the interaction of tillage and N fertilization: the prokaryotic community structure of the fertilized conventional tillage system was remarkably different respect to the unfertilized conservation and conventional systems in the surface layer. In addition, the effect of N fertilization in shaping the fungal community structure of the surface layer was higher under conservation tillage systems than under conventional tillage systems. Soil microbial community was shaped by soil depth irrespective of the effect of plowing and N addition. Finally, chemical and enzymatic parameters of soil and crop yields were significantly related to fungal community structure along the soil profile. The findings of this study gave new insights on the identification of management practices supporting and suppressing beneficial and detrimental taxa, respectively. This highlights the importance of managing soil microbial diversity through agro-ecological intensified systems in the Mediterranean area.

Keywords: 16S rRNA; Glomeromycota; ITS1 region; Illumina sequencing; arbuscular mycorrhizal fungi; soil archaea; soil bacteria; soil fungi.


Figures

FIGURE 1
FIGURE 1
Neighbor-joining (NJ) tree of 52 prokaryotic taxon representative sequences (A) and Maximum Likelihood (ML) trees of 40 Ascomycota (B) and 21 Basidiomycota taxon representative sequences (C) found in soil under long-term tillage and nitrogen fertilization. Treatments are: MTN0 (minimum tillage and 0 kg N ha–1), MTN200 (minimum tillage and 200 kg N ha–1), CTN0 (conventional tillage and 0 kg N ha–1) and CTN200 (conventional tillage and 200 kg N ha–1). Soil depths are: 0–15 and 15–30 cm soil depths. NJ tree of prokaryotes is based on the sequences obtained from the amplification of the V4 region (16 SSU rRNA gene) and ML trees of fungi are based on the sequences obtained from the amplification of the ITS1 region (for details see Supplementary Table S1). The prokaryotic taxa were assigned to Operational Taxonomic Unit (OTU) by BLAST against the 16S SSU SILVA database by clustering sequence reads at the 97% similarity threshold. The fungal taxa were assigned by BLAST against the ITS UNITE database and were selected by dynamic threshold values of clustering. For each OTU, the proportion of sequences retrieved from treatment (MTN0, light green; MTN200, dark green; CTN0, light red; CTN200, dark red) and soil depths (0–15 cm: light gray; 15–30 cm: dark gray) are shown in the pie charts. The name of each OTU is composed by the name of the class/phylum phylogenetic resolution and a serial number that is reported also in the trees.
FIGURE 2
FIGURE 2
Community diversity of prokaryotic phyla (A), fungal phyla (B), Ascomycota classes (C), Basidiomycota classes (D) shown as relative abundances of operational taxonomic units found in soil under long-term tillage and nitrogen fertilization. Treatments are: MTN0 (minimum tillage and 0 kg N ha–1), MTN200 (minimum tillage and 200 kg N ha–1), CTN0 (conventional tillage and 0 kg N ha–1) and CTN200 (conventional tillage and 200 kg N ha–1). Soil depths are: 0–15 and 15–30 cm soil depths.
FIGURE 3
FIGURE 3
Principal Coordinates Analysis (PCO) biplots on the long-term effect of tillage and nitrogen fertilization on community diversity of prokaryotic classes at 0–15 cm soil depth (A), prokaryotic phyla at 0–15 cm (B), fungal families at 0–15 cm (C), fungal families at 15–30 cm (D), fungal phyla at 0–15 cm (E), fungal families at 15–30 cm (F). The output of the subfigures is based on the significant effect of treatments following the permutational analysis of variance. In each PCO biplot, we displayed only the phyla, classes and families with a strong correlation (r ≥ 0.70) with the ordination scores on each PCO axis. Data standardized to the median were square-root transformed and Bray-Curtis coefficients of similarity were calculated between samples.
FIGURE 4
FIGURE 4
Principal Coordinates Analysis (PCO) biplots on the effect of soil depth (0–15 vs. 15–30 cm) on community diversity of prokaryotic classes (A), prokaryotic phyla (B) and fungal families (C). Tillage and nitrogen fertilization were used as covariates. The output of the subfigures is based on the significant effect of soil depth following the permutational analysis of variance. In each PCO biplot, we displayed only the phyla, classes and families with a strong correlation (r ≥ 0.70) with the ordination scores on each PCO axis. Data standardized to the median were square-root transformed and Bray-Curtis coefficients of similarity were calculated between samples.
FIGURE 5
FIGURE 5
Co-inertia biplots on fungal community structure at family level and soil physico-chemical and enzymatic parameters at 0–15 cm soil depth (A) and at 15–30 cm soil depth (B). See Figures 1B,C and Supplementary Table S2 for fungal taxon assignment. The colored arrows represent the soil parameters: bulk density (BD) and arylsulphatase (Aryls) (blue arrows); wheat and soybean yields (red arrows); P cycle parameters: available P, Avail P; phosphatase, Phosph (gray arrows); N cycle parameters: total N, Tot N; ammonium, NH4-N; nitrate, NO3-N; chitinase, NAG; Leucine, AP, L.AP; ecoenzymatic N/P acquisition activity, (NAG + L.AP)/Phosph (green arrows); C cycle parameters: soil organic carbon, SOC; cellulose, Cell; α-glucosidase, α-gluc; β-glucosidase, β-gluc; xylosidase, Xylos; synthetic enzyme index of C cycle, SEIc; ecoenzymatic C/N acquisition activity, β-gluc/(NAG + L.AP) (brown arrows); enzyme indexes: synthetic enzyme index, SEI; Shannon index, H’ (yellow arrows). The black arrows represent fungal taxa. The lengths of the vector arrows indicate the influence of the parameters on the co-inertia co-structure.

Similar articles

Cited by

References

    1. Abbott L. K., Robson A. D., De Boer G. (1984). The effect of phosphorus on the formation of hyphae in soil by the vesicular-arbuscular mycorrhizal fungus. Glomus fasciculatum. New Phytol. 97 437–446. 10.1111/j.1469-8137.1984.tb03609.x - DOI - PubMed
    1. Ai C., Zhang S., Zhang X., Guo D., Zhou W., Huang S. (2018). Distinct responses of soil bacterial and fungal communities to changes in fertilization regime and crop rotation. Geoderma 319 156–166. 10.1016/j.geoderma.2018.01.010 - DOI
    1. Alguacil M. M., Lumini E., Roldan A., Salinas-Garcia J. R., Bonfante P., Bianciotto V. (2008). The impact of tillage practices on arbuscular mycorrhizal fungal diversity in subtropical crops. Ecol. Appl. 18 527–536. 10.1890/07-0521.1 - DOI - PubMed
    1. Alguacil M. M., Torrecillas E., García-Orenes F., Roldán A. (2014). Changes in the composition and diversity of AMF communities mediated by management practices in a Mediterranean soil are related with increases in soil biological activity. Soil Biol. Biochem. 76 34–44. 10.1016/j.soilbio.2014.05.002 - DOI
    1. Anderson M. J. (2001). A new method for non-parametric multivariate analysis of variance. Austral Ecol. 26 32–46. 10.1111/j.1442-9993.2001.01070.pp.x - DOI

LinkOut - more resources