. 2019 Sep 4:10:2050.
doi: 10.3389/fimmu.2019.02050. eCollection 2019.

Bach2 Deficiency Leads to Spontaneous Expansion of IL-4-Producing T Follicular Helper Cells and Autoimmunity

Affiliations

Bach2 Deficiency Leads to Spontaneous Expansion of IL-4-Producing T Follicular Helper Cells and Autoimmunity

Heng Zhang et al. Front Immunol. .

Abstract

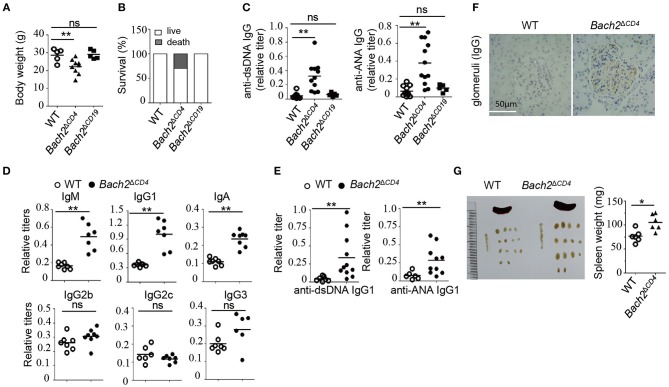
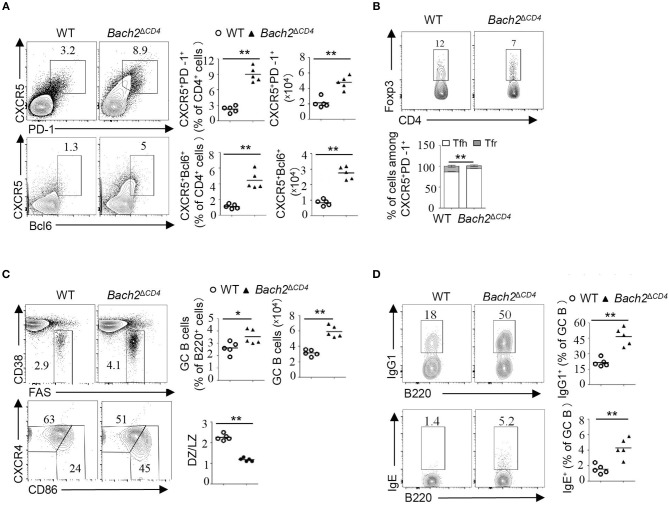
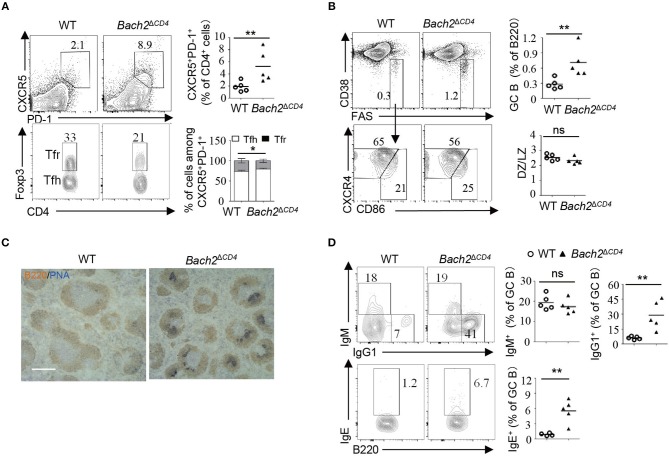
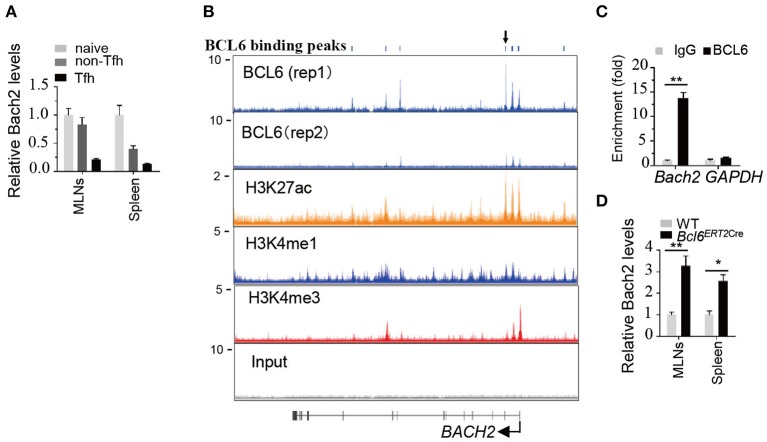
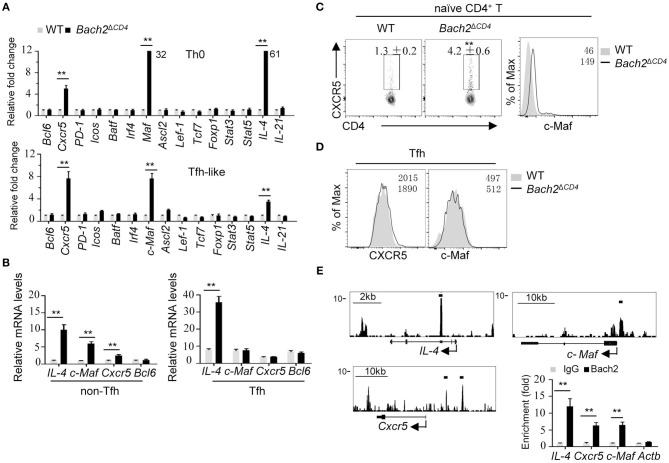
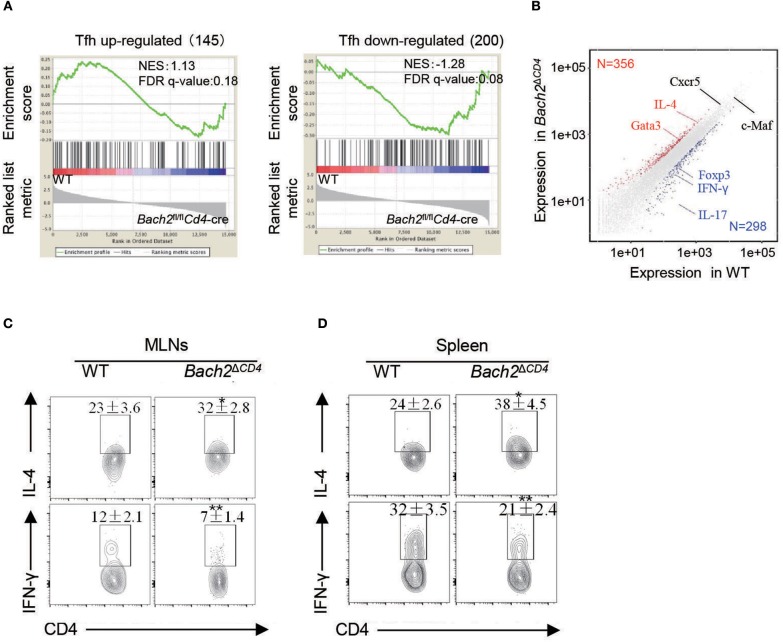
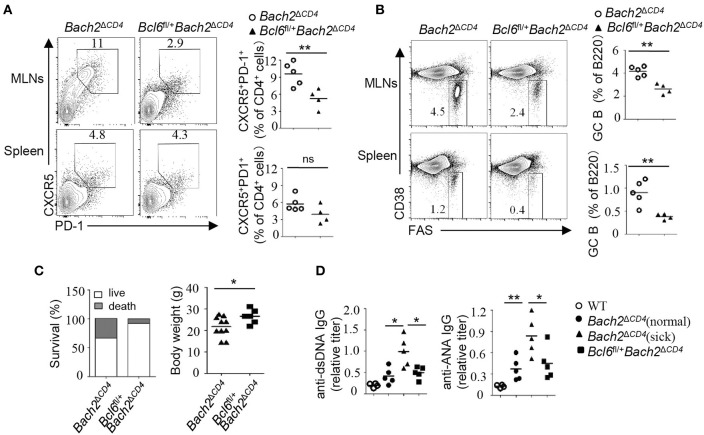
The transcription factor Bach2 is a susceptible gene for numerous autoimmune diseases including systemic lupus erythematosus (SLE). Bach2-/- mice can develop a lupus-like autoimmune disease. However, the exact cellular and molecular mechanisms via which Bach2 protects the hosts from developing autoimmunity remains incompletely understood. Here, we report that Bach2 ablation on T cells, but not B cells, resulted in humoral autoimmunity, and this was associated with expansion of T follicular helper (Tfh) cells and abnormal germinal centers. Bach2 was down-regulated in Tfh cells and directly suppressed by the Tfh-defining transcription factor BCL6. Mechanistically, Bach2 directly suppresses the transcription of Cxcr5 and c-Maf, two key regulators of Tfh cell differentiation. Bach2-deficient Tfh cells were skewed toward the IL-4-producing subset, which induced IgG1 and IgE isotype switching of B cells. Heterozygous Bcl6 deficiency reduced the formation of germinal center and autoantibodies, and ameliorated the pathology in Bach2-deficient mice. Our findings identify Bach2 as a crucial negative regulator of Tfh cells at steady state and prove that Bach2 controls autoimmunity in part by restraining accumulation of pathogenic Tfh cells.

Keywords: BCL6; Bach2; IL-4; T follicular helper cells; autoimmunity.


Figures

Figure 1
Figure 1
Loss of Bach2 in T cells causes humoral autoimmunity. (A,B) Body weight (A) and survival rate (B) of wild-type (WT), Bach2ΔCD4, or Bach2ΔCD19 mice at 5 months of age. (C) Titer of anti-dsDNA antibodies and anti-nuclear antibodies (ANA) in the sera of WT, Bach2ΔCD4, or Bach2ΔCD19 mice at 2–3 months of age. (D) Titers of immunoglobulins in sera of WT and Bach2ΔCD4 mice at 2–3 months of age. (E) Titers of anti-dsDNA and ANA IgG1 in the sera of WT and Bach2ΔCD4 mice at 2–3 months of age. (F) Immunochemistry of IgG deposit in renal glomeruli. (G) Representative images (left) of spleen and lymph nodes of WT and Bach2ΔCD4 mice at 5 months of age. The weight of spleens from indicated mice is shown at the right. Each symbol represents one mouse; small horizontal lines indicate the mean; ns, not significant; *P < 0.05 and **P < 0.01 (two-tailed t-test).
Figure 2
Figure 2
Bach2ΔCD4 mice display excessive Tfh cells and aberrant GC B cells in the MLNs. Lymphocytes from the MLNs of WT and Bach2ΔCD4 mice at 2–3 months of age were subjected for analysis. (A) Representative flow cytometry plots, frequency quantification, and absolute number of CXCR5+PD-1+ and CXCR5+Bcl6+ T follicular cells (gated on CD4+B220 cells). (B) Representative flow cytometry plots and frequency quantification of Tfh (Foxp3) and Tfr (Foxp3+) cells among CXCR5+PD-1+ CD4 T cells. (C) Representative flow cytometry plots, frequency quantification, and absolute number of CD38lo/−Fas+ GC B cells among splenic live B220+ cells. Quantification of the ratio of CD86hiCXCR4lo light zone (LZ) to CD86loCXCR4hi dark zone (DZ) B cells among GC B cells (bottom). (D) Representative flow cytometry plots and frequency quantification of IgG1+ and IgE+ cells among splenic GC B cells. All data were from at least two independent experiments. Each symbol represents one mouse, and small horizontal lines indicate the mean. ns, not significant; *P < 0.05 and **P < 0.01 (two-tailed t-test).
Figure 3
Figure 3
Bach2ΔCD4 mice develop spontaneous GCs in the spleens with age. The lymphocytes from the spleens of WT and Bach2ΔCD4 mice at 3–5 months of age were subjected for analysis. (A) Representative flow cytometry plots and frequency quantification of splenic CXCR5+PD-1+ T follicular cells (gated on CD4+B220 cells) (top). Representative flow cytometry plots and frequency quantification of Tfh (Foxp3) and Tfr (Foxp3+) cells among CXCR5+PD-1+ CD4 T cells (bottom). (B) Representative flow cytometry plots and frequency quantification of GC B cells among splenic live B220+ cells. Quantification of the ratio of LZ to DZ B cells among GC B cells (bottom). (C) Representative PNA staining of splenic sections from WT and Bach2ΔCD4 mice (scale bars, 1 mm). Blue, PNA; brown, B220. (D) Frequencies of IgM+, IgG1+, and IgE+ cells among GC B cells. All data were from at least two independent experiments. Each symbol represents one mouse, and small horizontal lines indicate the mean. ns, not significant; *P < 0.05 and **P < 0.01 (two-tailed t-test).
Figure 4
Figure 4
Bach2 is down-regulated during Tfh cell differentiation and directly suppressed by BCL6. (A) Relative Bach2 mRNA abundance in naïve (CD44lowCD62Lhigh), non-Tfh (CD44highCD62LlowCXCR5PD1), and Tfh cells isolated from the MLNs and/or spleens of WT mice at 2 months of age, determined by RT-qPCR. (B) The illustration depicting ChIP-seq tracks of BCL6 and indicated histone marks at the BACH2 gene in primary human Tfh cells. BCL6 binding peaks are shown at the top. (C) ChIP-qPCR analysis of BCL6 binding peak indicated by arrow in (B). The fold enrichment was calculated relative to IgG. Data are mean ± s.e.m. (D) The relative mRNA expression levels of Bach2 in Tfh cells sorted from the MLNs and spleens of 2-month-old WT and Bcl6ERT2Cre mice 5 days post tamoxifen treatment. Data are mean ± s.e.m. of two mice per group. *P < 0.05 and **P < 0.01 (two-tailed t-test).
Figure 5
Figure 5
Bach2 negatively regulates the mRNA abundance of Cxcr5, Maf, and IL-4. All cells were isolated from 2-month-old mice for analysis. (A) Relative mRNA levels of indicated genes in splenic naïve CD4+ cells (CD44lowCD62Lhigh) cultured in Th0 or Tfh-like cell condition. Data were from two independent experiments and represented as fold changes relative to WT cells after normalization with Actb. Numbers adjacent to black bars indicate fold in each. (B) RT-qPCR analysis of mRNA levels of indicated genes in WT and Bach2-deficient non-Tfh (CD44highCXCR5PD1) and Tfh cells. Data were represented as up-regulation relative to WT non-Tfh cells after normalization with Actb. (C) The frequency of CXCR5+ cells and c-Maf protein abundance in naïve CD4+ T cells from the MLNs. (D) Flow cytometric analysis of CXCR5 and c-Maf protein abundance in Tfh cells. (E) The illustration of ChIP-seq tracks of Bach2 at indicated genes in CD4+ T cells (left). Bach2-bound sites were indicated by black lines. ChIP-qPCR analysis of Bach2 binding at indicated genomic loci. The fold enrichment was calculated relative to IgG. Data are mean ± s.e.m. of two independent experiments from at least three mice per group. **P < 0.01 (two-tailed t-test).
Figure 6
Figure 6
Bach2-deficient Tfh cells are skewed IL-4-producing subset. Two- to 3-month-old mice were used for analysis. (A) GSEA analysis of gene signatures up-regulated or down-regulated in Tfh cells relative to their expression in non-Tfh cells, from published data (GEO accession code: GSE21379). (B) Scatterplot of genes up-regulated (red) or down-regulated (blue) in Bach2-deficient Tfh cells vs. WT cells. Select genes of interest are labeled. (C,D) Representative flow cytometry plots and quantification of IL-4 and IFN-γ-secreting Tfh subsets (gated in CXCR5+PD-1+ T follicular cells) in the MLNs (C) and spleens (D). Data are mean ± s.e.m. of two independent experiments from at least three mice per group. *P < 0.05 and **P < 0.01 (two-tailed t-test).
Figure 7
Figure 7
The Bcl6 heterozygosity significantly reduced autoantibodies and pathology. (A,B) The frequencies of Tfh and GC B cells in the MLNs and spleens from Bach2ΔCD4 and Bcl6fl/+Bach2ΔCD4 mice. (C) Body weight and survival of Bach2ΔCD4 and Bcl6fl/+Bach2ΔCD4 mice. (D) Titers of anti-dsDNA and anti-ANA antibodies in sera from Bach2ΔCD4 and Bcl6fl/+Bach2ΔCD4 mice. All mice were analyzed at 5–6 months of age. Each symbol represents one mouse; small horizontal lines indicate the mean. ns, not significant; *P < 0.05 and **P < 0.01 (two-tailed t-test).

Similar articles

Cited by

References

    1. Richer MJ, Lang ML, Butler NS. T cell fates zipped up: how the Bach2 basic leucine zipper transcriptional repressor directs T cell differentiation and function. J Immunol. (2016) 197:1009–15. 10.4049/jimmunol.1600847 - DOI - PMC - PubMed
    1. Ferreira MA, Matheson MC, Duffy DL, Marks GB, Hui J, Le Souef P, et al. . Identification of IL6R and chromosome 11q13.5 as risk loci for asthma. Lancet. (2011) 378:1006–14. 10.1016/S0140-6736(11)60874-X - DOI - PMC - PubMed
    1. Jin Y, Birlea SA, Fain PR, Ferrara TM, Ben S, Riccardi SL, et al. . Genome-wide association analyses identify 13 new susceptibility loci for generalized vitiligo. Nat Genet. (2012) 44:676–80. 10.1038/ng.2272 - DOI - PMC - PubMed
    1. International Multiple Sclerosis Genetics Consortium, Wellcome Trust Case Control Consortium. Sawcer S, Hellenthal G, Pirinen M, Spencer CC, et al. . Genetic risk and a primary role for cell-mediated immune mechanisms in multiple sclerosis. Nature. (2011) 476:214–9. 10.1038/nature10251 - DOI - PMC - PubMed
    1. Cooper JD, Smyth DJ, Smiles AM, Plagnol V, Walker NM, Allen JE, et al. . Meta-analysis of genome-wide association study data identifies additional type 1 diabetes risk loci. Nat Genet. (2008) 40:1399–401. 10.1038/ng.249 - DOI - PMC - PubMed

Publication types

MeSH terms