. 2019 Sep 10:10:2133.
doi: 10.3389/fimmu.2019.02133. eCollection 2019.

Cardiotrophin-Like Cytokine Factor 1 Exhibits a Myeloid-Biased Hematopoietic-Stimulating Function

Affiliations

Cardiotrophin-Like Cytokine Factor 1 Exhibits a Myeloid-Biased Hematopoietic-Stimulating Function

Sarah Pasquin et al. Front Immunol. .

Abstract

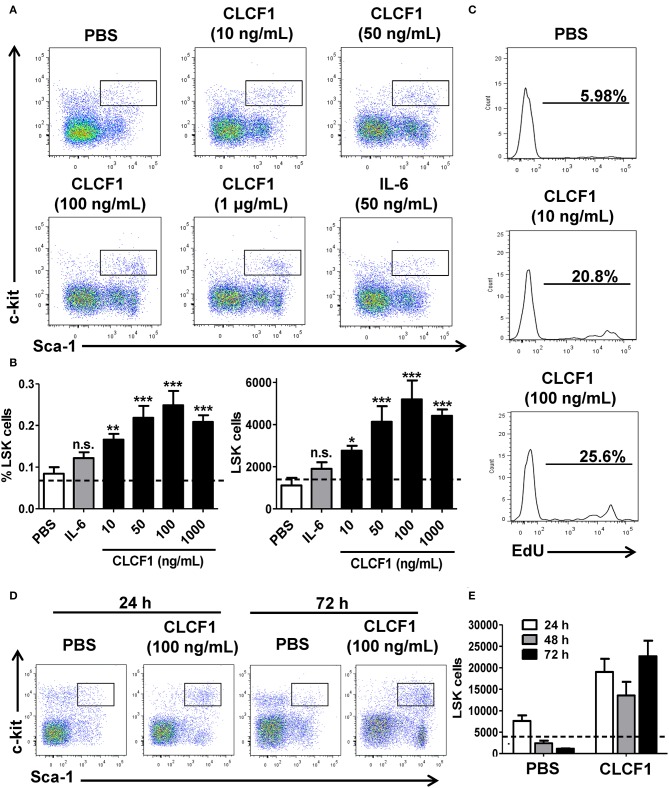
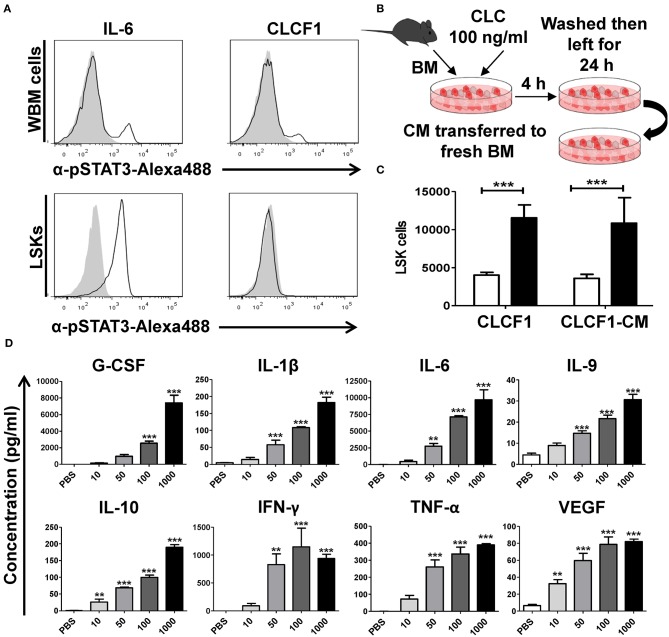
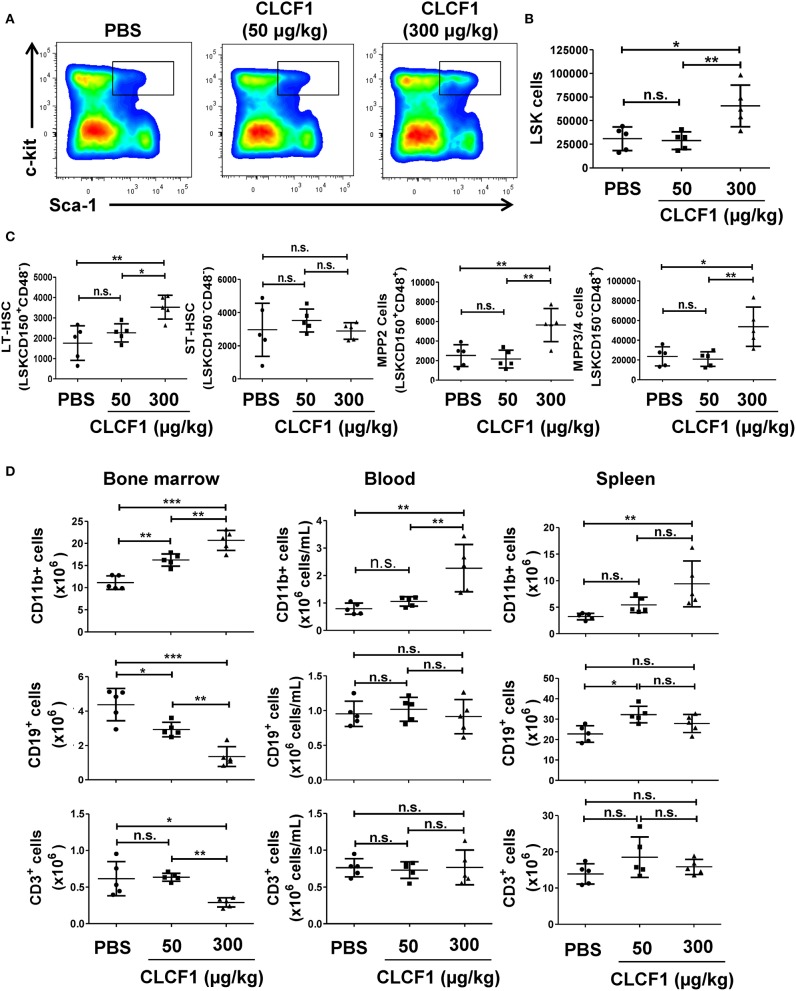
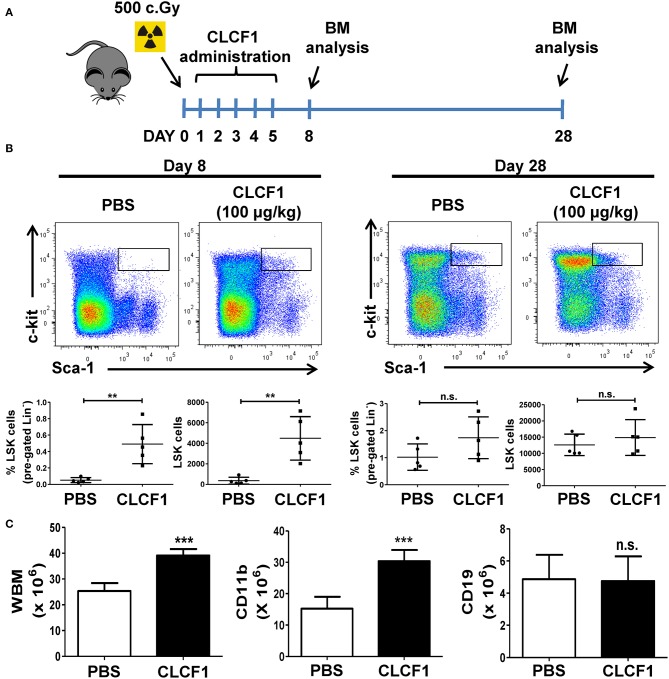
Cardiotrophin-like cytokine factor 1 (CLCF1) is secreted as a complex with the cytokine receptor-like factor 1 (CRLF1). Syndromes caused by mutations in the genes encoding CLCF1 or CRLF1 suggest an important role for CLCF1 in the development and regulation of the immune system. In mice, CLCF1 induces B-cell expansion, enhances humoral responses and triggers autoimmunity. Interestingly, inactivation of CRLF1, which impedes CLCF1 secretion, leads to a marked reduction in the number of bone marrow (BM) progenitor cells, while mice heterozygous for CLCF1 display a significant decrease in their circulating leukocytes. We therefore hypothesized that CLCF1 might be implicated in the regulation of hematopoiesis. To test this hypothesis, murine hematopoietic progenitor cells defined as Lin-Sca1+c-kit+ (LSK) were treated in vitro with ascending doses of CLCF1. The frequency and counts of LSK cells were significantly increased in the presence of CLCF1, which may be mediated by several CLCF1-induced soluble factors including IL-6, G-CSF, IL-1β, IL-10, and VEGF. CLCF1 administration to non-diseased C57BL/6 mice resulted in a pronounced increase in circulating myeloid cells, which was concomitant with augmented LSK and myeloid cell counts in the BM. Likewise, CLCF1 administration to mice following sub-lethal irradiation or congeneic BM transplantation (BMT) resulted in accelerated LSK recovery along with a sustained increase in BM-derived CD11b+ cells. Altogether, our observations establish an important and unforeseen role for CLCF1 in regulating hematopoiesis with a bias toward myeloid cell differentiation.

Keywords: LSK cells; bone marrow transplantation; cardiotrophin-like cytokine factor 1; interleukin-6; myelopoiesis.


Figures

Figure 1
Figure 1
CLCF1 promotes LSK proliferation. (A) Representative flow-cytometry analysis of LSKs following a 24 h stimulation with different CLCF1 concentrations. (B) Percentages and absolute counts of LSKs displayed as mean of triplicates ± S.D. Dotted lines represent LSK counts at day 0. (C) EdU incorporation in LSK cells after 24 h of WBM stimulation with CLCF1. (D) Flow-cytometry analysis of LSKs following 24 and 72 h stimulation with PBS or CLCF1 (100 ng/mL). (E) Absolute LSK counts of the experiment shown in (D). Dotted lines represent LSK counts at day 0. *P < 0.05, **P < 0.01, ***P < 0.001.
Figure 2
Figure 2
CLCF1 activates LSK cells in an indirect fashion. (A) WBM (upper panel) or FACS-sorted LSKs (lower panel) stimulated with IL-6 (50 ng/ml) or CLCF1 (100 ng/ml). Filled gray histograms represent STAT3 phosphorylation in unstimulated cells. (B) The experimental design used to assess the indirect effect of CLCF1 on BM-derived cell. WBM cells were incubated with PBS or CLCF1 for 4 h, washed then cultured for another 24 h. CM was then transferred to stimulate freshly isolated BM cells for 24 h prior to LSK quantification by flow-cytometry. (C) Absolute LSK counts from the experiment shown in panel B. CLCF1 or CLCF1-derived CM is represented by the black bars whereas white bars represent the PBS control condition. (D) Cytokine/chemokine analysis of CM collected from cells incubated with PBS or CLCF1 for 24 h. **P < 0.01, ***P < 0.001.
Figure 3
Figure 3
CLCF1 administration to healthy mice up-regulate LSK and myeloid cell levels in the BM. (A,B) Frequency and count assessment of LSKs at day 8 post-CLCF1 administration. (C) Absolute counts of BM LSKsCD150+CD48 (LT-HSCs), LSKsCD150CD48 (ST-HSCs), LSKsCD150+CD48+ (MPP2), and LSKsCD150CD48+ (MPPs). (D) Absolute counts of BM-, blood- and spleen-resident CD11b+ cells, CD19+ cells and CD3+ cells at day 8. Graphs represent absolute count in mean ± S.D (n = 5 per group). *P < 0.05, **P <0.01, ***P < 0.001.
Figure 4
Figure 4
CLCF1 accelerates the recovery of LSKs following sub-lethal irradiation. (A) Schematic overview of CLCF1 injections after total body sub-lethal irradiation. (B) Flow-cytometry analysis and their cognate percentages/absolute counts of BM-derived LSK cells at day 8 (left panel) or day 28 (right panel) compared to PBS-treated mice. (C) Absolute count of total, CD11b+ and CD19+ BM cells at day 28. For (B,C), graphs represent absolute count in mean ± S.D (n = 5 per group). **P < 0.01, ***P < 0.001.
Figure 5
Figure 5
CLCF1 administration increases the level of circulating myeloid cells following congeneic BMT. (A,B) Schematic representation of CLCF1 injections in congenic BMT. Recipient mice received i.p. injections of PBS, IL-7 (50 μg/kg) or CLCF1 (300 μg/kg) every 2 days for a total period of 2 weeks. Blood samples were collected weekly starting from week 2 for flow-cytometry analysis. (C) Absolute counts of circulating CD45.1+, CD45.1+CD11b+, CD45.1+CD19+, and CD45.1+CD3+ cells at week 2, 4, and 9 post-transplantation. Graphs represent absolute counts in mean ± S.D (n = 10/group for week 2 and 4, n = 5/group for week 9). Dotted lines indicate mean value of aged-match un-transplanted controls (n = 10) ±S.D. *P < 0.05, **P < 0.01, ***P < 0.001.
Figure 6
Figure 6
CLCF1 administration after BMT results in increased numbers of BM-resident LSK and myeloid cells. Recipient mice received i.p. injections of PBS, IL-7 (50 μg/kg), or CLCF1 (300 μg/kg) every 2 days for 2 weeks. Five mice per group were sacrificed at week 4 after congenic transplant and 5 mice at week 9 for BM flow-cytometry analysis. Percentages of chimerism (CD45.1/total CD45) and absolute counts of BM CD45.1+, CD45.1+LSKs, CD45.1+CD11b+, CD45.1+CD19+, and CD45.1+CD3+ cells at week 4 (A) or week 9 (B). Bar graphs representing the absolute counts in mean ± S.D (n = 5 per group). *P < 0.05, **P < 0.01, ***P < 0.001.

References

    1. Metcalf D. Hematopoietic regulators: redundancy or subtlety? Blood. (1993) 82:3515–23. - PubMed
    1. Kishimoto T. The biology of interleukin-6. Blood. (1989) 74:1–10. 10.1557/S0883769400061601 - DOI - PubMed
    1. Hirano T, Taga T, Matsuda T, Hibi M, Suematsu S, Tang B, et al. . Interleukin 6 and its receptor in the immune response and hematopoiesis. Int J Cell Cloning. (1990) 8 (Suppl. 1):155–66. 10.1002/stem.5530080714 - DOI - PubMed
    1. Bernad A, Kopf M, Kulbacki R, Weich N, Koehler G, Gutierrez-Ramos JC. Interleukin-6 is required in vivo for the regulation of stem cells and committed progenitors of the hematopoietic system. Immunity. (1994) 1:725–31. 10.1016/S1074-7613(94)80014-6 - DOI - PubMed
    1. Yoshida K, Taga T, Saito M, Suematsu S, Kumanogoh A, Tanaka T, et al. . Targeted disruption of gp130, a common signal transducer for the interleukin 6 family of cytokines, leads to myocardial and hematological disorders. Proc Natl Acad Sci USA. (1996) 93:407–11. 10.1073/pnas.93.1.407 - DOI - PMC - PubMed

Publication types

MeSH terms