. 2019 Sep 3:10:775.
doi: 10.3389/fgene.2019.00775. eCollection 2019.

Single-Cell Transcriptomics Reveals Spatial and Temporal Turnover of Keratinocyte Differentiation Regulators

Affiliations

Single-Cell Transcriptomics Reveals Spatial and Temporal Turnover of Keratinocyte Differentiation Regulators

Alex Finnegan et al. Front Genet. .

Abstract

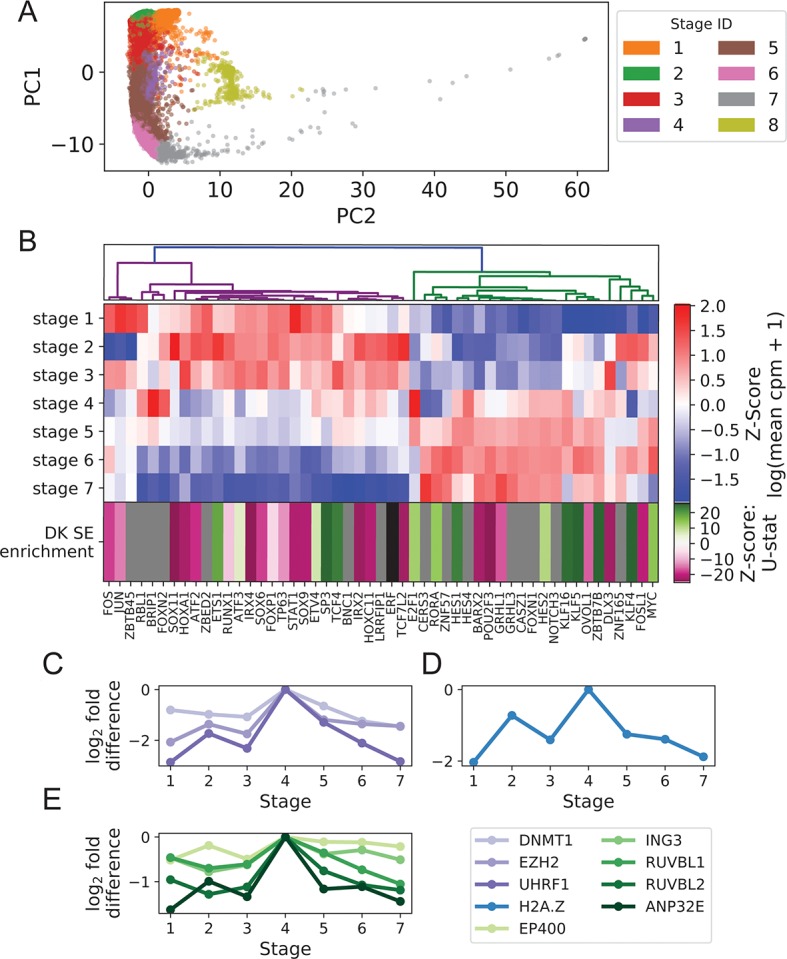
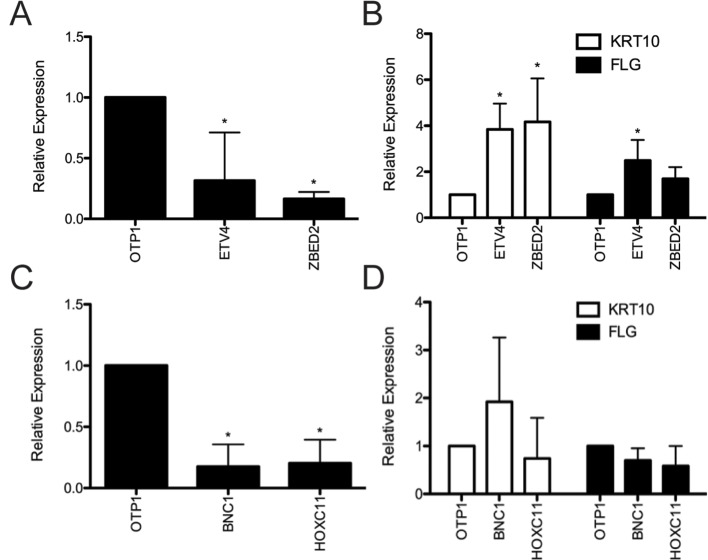
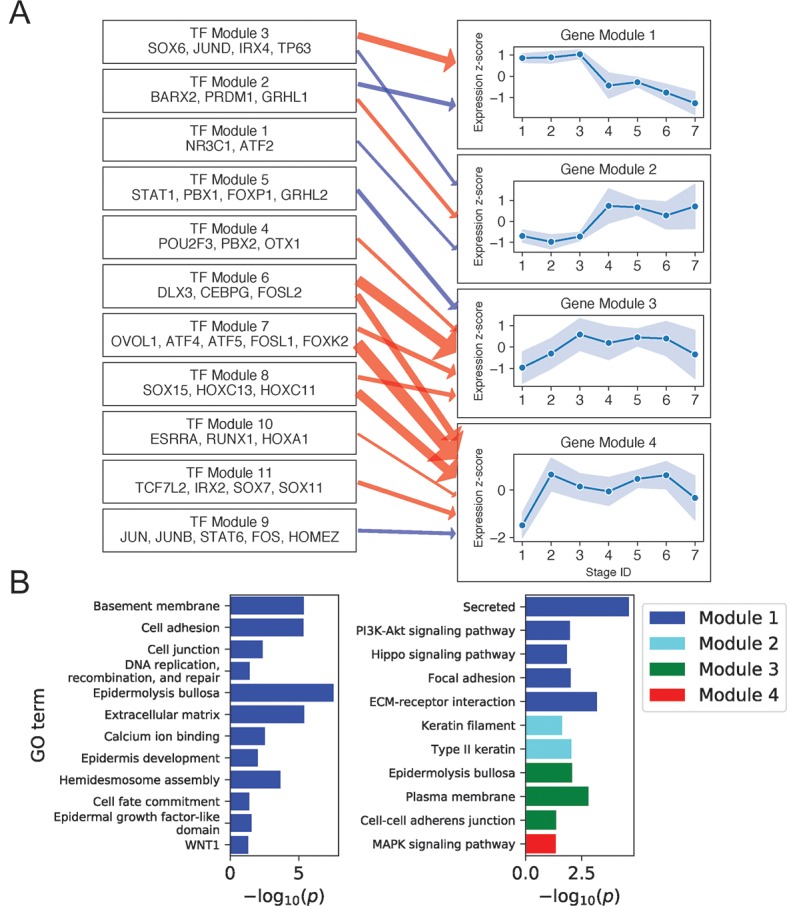
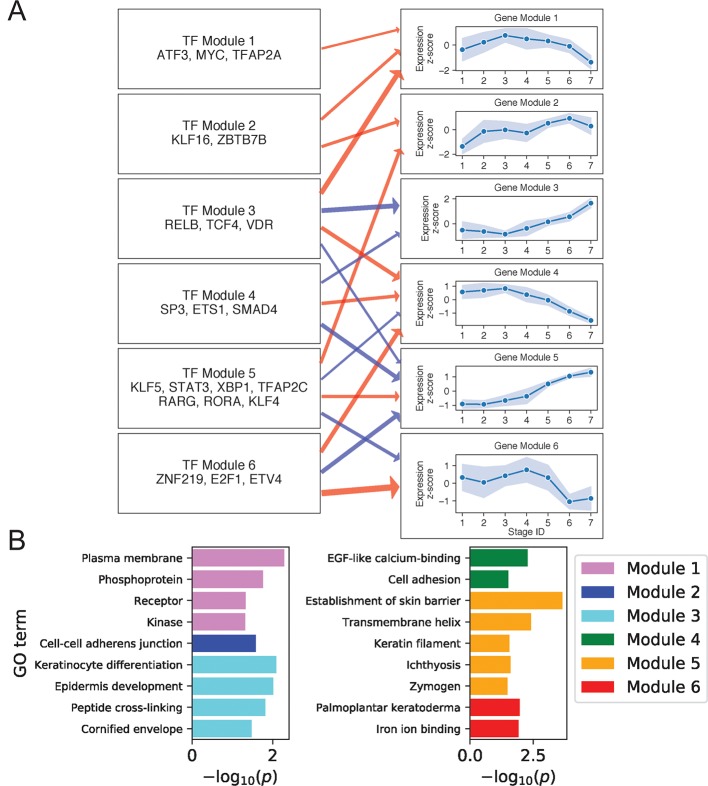
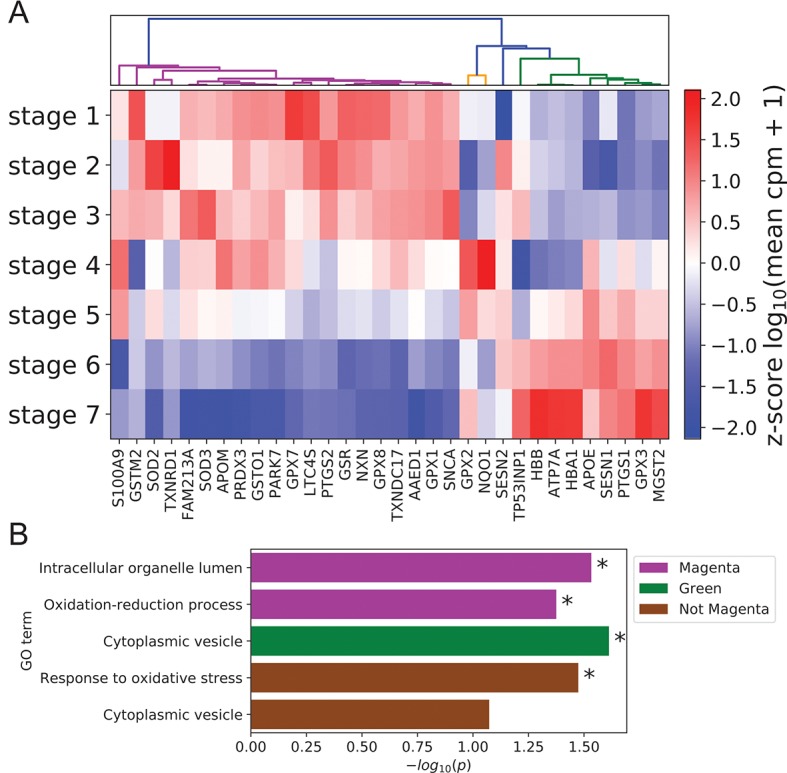
Keratinocyte differentiation requires intricately coordinated spatiotemporal expression changes that specify epidermis structure and function. This article utilizes single-cell RNA-seq data from 22,338 human foreskin keratinocytes to reconstruct the transcriptional regulation of skin development and homeostasis genes, organizing them by differentiation stage and also into transcription factor (TF)-associated modules. We identify groups of TFs characterized by coordinate expression changes during progression from the undifferentiated basal to the differentiated state and show that these TFs also have concordant differential predicted binding enrichment in the super-enhancers previously reported to turn over between the two states. The identified TFs form a core subset of the regulators controlling gene modules essential for basal and differentiated keratinocyte functions, supporting their nomination as master coordinators of keratinocyte differentiation. Experimental depletion of the TFs ZBED2 and ETV4, both predicted to promote the basal state, induces differentiation. Furthermore, our single-cell RNA expression analysis reveals preferential expression of antioxidant genes in the basal state, suggesting keratinocytes actively suppress reactive oxygen species to maintain the undifferentiated state. Overall, our work demonstrates diverse computational methods to advance our understanding of dynamic gene regulation in development.

Keywords: Single-cell analysis; antioxidant; differentiation; keratinocyte; transcription regulation.


Figures

Figure 1
Figure 1
Turnover in Keratinocyte TF expression is temporally and spatially coupled to turnover in SEs. (A) Imputed single-cell expression vectors of 22,338 foreskin keratinocytes projected onto first two principal components; stage membership was assigned by k-means–based approximate spectral clustering. (B) First seven rows show log-transformed stage-wise mean imputed expression of dynamic Keratinocyte TFs normalized across stages. Bottom row shows the magnitude and direction of differential motif enrichment between BK and DK SEs. Gray and black cells correspond to TFs without a known binding motif and TFs not differentially enriched between SE sets, respectively. Columns are organized by hierarchical clustering on first seven rows (Methods). (C−E) Log fold-change in stage-wise mean imputed expression between stage 4 (mitotic state) and other stages for established keratinocyte epigenetic regulators (C), H2A.Z (D), and a subset of components of SWR1 remodeler complex (E). See also Supplementary File 1: Figures S1−4 .
Figure 2
Figure 2
Evaluation of predicted keratinocyte regulators via siRNA knockdown. (A) RNA was harvested 4 days after transfection from primary human keratinocyte culture treated with ETV4, ZBED2, or negative control siRNA. Quantitative polymerase chain reaction analysis showed significant (p < 0.05, Student t test) knockdown of ETV4 and ZBED2 mRNA relative to nontargeting siRNA transfected cells. (B) Expression of KRT10 and FLG transcript following siRNA knockdown of ETV4 or ZBED2, relative to control. Asterisks indicate p < 0.05 (Student t test). (C) same as (A) but for BNC1 and HOXC11. (D) Knockdown of BNC1 and HOXC11 did not significantly change expression of differentiation marker genes KRT10 and FLG. Error bars indicate 1 standard deviation calculated over four replicates.
Figure 3
Figure 3
Basal keratinocyte network analysis identifies gene and TF modules specific to basal functions. (A) Regulation of four GO-enriched gene modules by TF modules, represented as a directed graph. Gene module nodes show log-transformed stage-wise mean imputed expression normalized across stages 1 to 7 with shading of 1 standard deviation interval. Transcription factor modules list their TF constituents. Arrows indicate regulation with width proportional to predicted strength of activation (red) or inhibition (blue). (B) Minus log of adjusted p values for selected GO terms enriched in each gene module. See also Supplementary File 1: Figure S5 .
Figure 4
Figure 4
Differentiated keratinocyte network analysis identifies gene and TF modules specific to differentiated functions. (A) Regulation of six GO-enriched gene modules by TF modules, represented as a directed graph. Gene module nodes show log-transformed mean stage-wise imputed expression normalized across stages 1 to 7 with shading of 1 standard deviation interval. Transcription factor modules list their TF constituents. Arrows indicate regulation with width proportional to predicted strength of activation (red) or inhibition (blue). (B) Minus log of adjusted p values for selected GO terms enriched in each gene module. See also Supplementary File 1: Figure S8 .
Figure 5
Figure 5
Peak expression of dynamic antioxidant genes is enriched in the BK state. (A) Log-transformed stage-wise mean imputed expression of dynamic antioxidant genes normalized across stages. Columns are organized by hierarchical clustering (Methods). (B) Minus log of unadjusted p values (Methods) for selected GO terms enriched in selected gene sets clustered from (A). Asterisks indicate significance at 0.05 threshold.

References

    1. Alcolea M. P., Jones P. H. (2014). Lineage analysis of epidermal stem cells. Cold Spring Harb. Perspect. Med. 4 (1), a015206. 10.1101/cshperspect.a015206 - DOI - PMC - PubMed
    1. Ali R. S., Falconer A., Ikram M., Bissett C. E., Cerio R., Quinn A. G. (2001). Expression of the peptide antibiotics human beta defensin-1 and human beta defensin-2 in normal human skin. J. Invest. Dermatol. 117 (1), 106–111. 10.1046/j.0022-202x.2001.01401.x - DOI - PubMed
    1. Amit I., Citri A., Shay T., Lu Y., Katz M., Zhang F., et al. (2007). A module of negative feedback regulators defines growth factor signaling. Nat. Genet. 39 (4), 503–512. 10.1038/ng1987 - DOI - PubMed
    1. Barbieri C. E., Tang L. J., Brown K. A., Pietenpol J. A. (2006). Loss of p63 leads to increased cell migration and up-regulation of genes involved in invasion and metastasis. Cancer Res. 66 (15), 7589–7597. 10.1158/0008-5472.CAN-06-2020 - DOI - PubMed
    1. Bhaduri A., Ungewickell A., Boxer L. D., Lopez-Pajares V., Zarnegar B. J., Khavari P. A. (2015). Network analysis identifies mitochondrial regulation of epidermal differentiation by MPZL3 and FDXR. Dev. Cell. 35 (4), 444–457. 10.1016/j.devcel.2015.10.023 - DOI - PMC - PubMed