. 2019 Sep 2:7:175.
doi: 10.3389/fcell.2019.00175. eCollection 2019.

Cross-Species Analysis of Single-Cell Transcriptomic Data

Affiliations

Cross-Species Analysis of Single-Cell Transcriptomic Data

Maxwell E R Shafer. Front Cell Dev Biol. .

Abstract

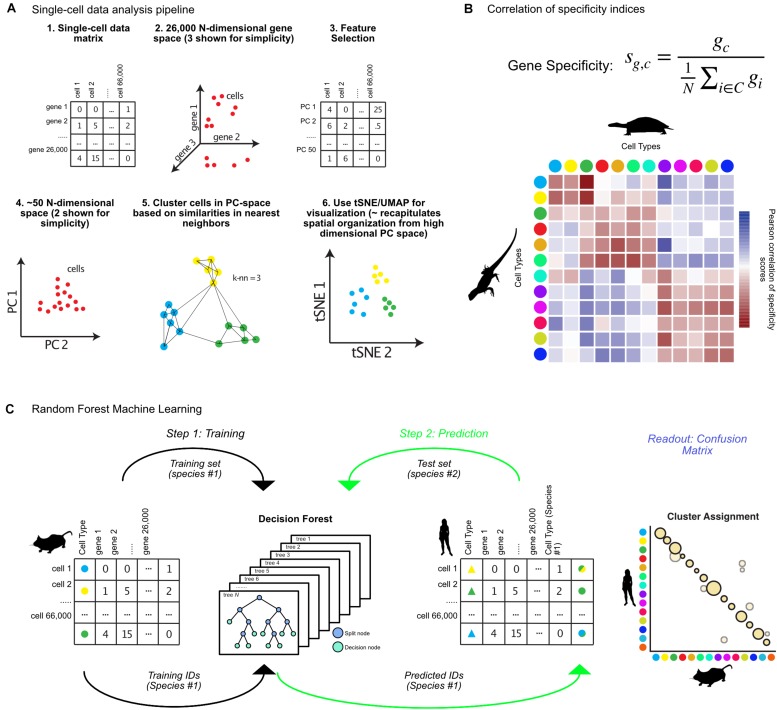
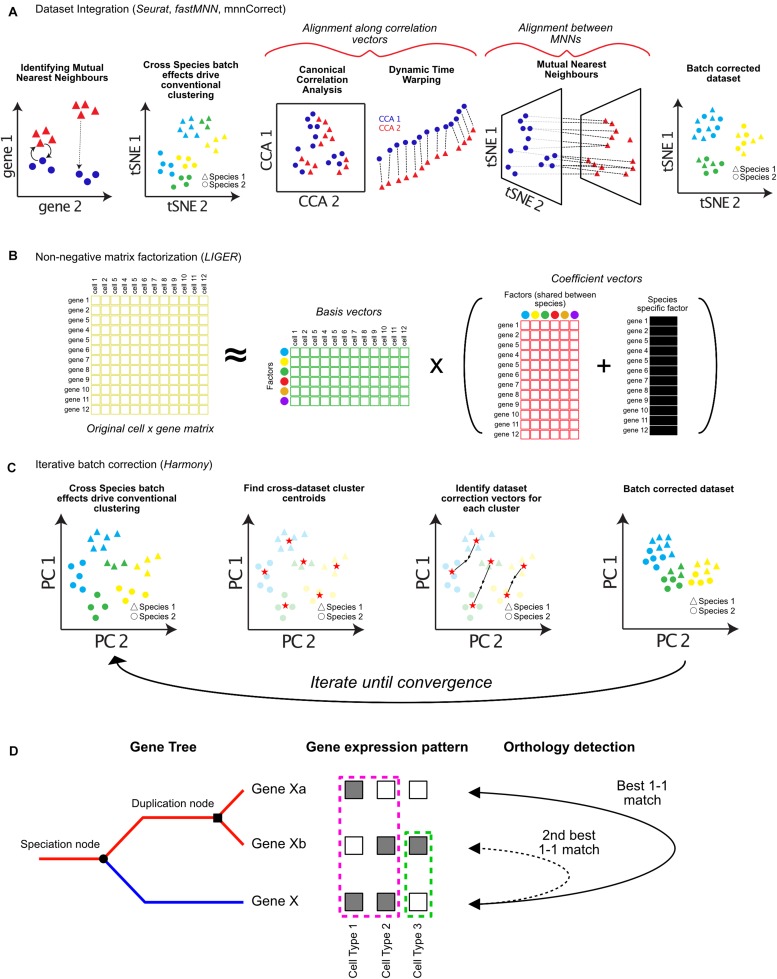
The ability to profile hundreds of thousands to millions of single cells using scRNA-sequencing has revolutionized the fields of cell and developmental biology, providing incredible insights into the diversity of forms and functions of cell types across many species. These technologies hold the promise of developing detailed cell type phylogenies which can describe the evolutionary and developmental relationships between cell types across species. This will require sampling of many species and taxa using single-cell transcriptomics, and methods to classify cell type homologies and diversifications. Many tools currently exist for analyzing single cell data and identifying cell types. However, cross-species comparisons are complicated by many biological and technical factors. These factors include batch effects common to deep-sequencing approaches, well known evolutionary relationships between orthologous and paralogous genes, and less well-understood evolutionary forces shaping transcriptome variation between species. In this review, I discuss recent developments in computational methods for the comparison of single-cell-omic data across species. These approaches have the potential to provide invaluable insight into how evolutionary forces act at the level of the cell and will further our understanding of the evolutionary origins of animal and cellular diversity.

Keywords: cell types; evolutionary cell biology; single-cell RNA sequencing; species comparisons; transcriptome evolution.


Figures

FIGURE 1
FIGURE 1
Matching cell clusters in single-cell RNA-seq across species. (A) Overview of bioinformatic pipeline for single-cell sequencing analysis from the R toolkit Seurat, including feature selection, dimensionality reduction, and graph-based clustering. Seurat takes a cell by gene expression matrix (steps 1, 2), and first identifies features (genes) for dimensionality reduction (steps 3, 4). Using principal components, Seurat identifies clusters using graph-based methods, then visualizes resulting clusters using tSNE or UMAP (steps 5, 6). (B) Equation for calculation of gene specificity, and example correlation of these values between turtle and lizard cell types (colored dots) where Pearson correlation coefficient values in red indicate positive correlation and blue indicate negative correlation. (C) Random forest machine learning algorithms for identifying cross-species cell type annotations involves first training an algorithm on cell types from one species (step 1), then predicting which of those cell types each cell from a different species most resembles (step 2), which results in a confusion matrix (Readout). Animal silhouettes were obtained from PhyloPic (www.phylopic.org). All silhouettes were used under the Public Domain Dedication 1.0 license, except the image of a turtle, which is attributed to Scott Hartman.
FIGURE 2
FIGURE 2
Approaches for integrating single-cell RNA-seq datasets across species. Cells typically cluster by dataset or species of origin, rather than cell types. In order to integrate datasets for downstream analysis, batch correction algorithms can be applied. (A) Dataset integration can be accomplished by identifying batch correction vectors using either differences between Mutual Nearest Neighbors (MNN), Canonical Correlation Analysis (CCA), or a combination of both. (B) Integrative Non-Negative Matrix Factorization (iNMF) can be used to decompose cell × gene expression matrices into separate factor matrices which can represent species specific factors affecting gene expression patterns. These factors can then be removed to allow clustering by cell types, while retaining information about which genes contribute to species-specific differences. (C) Harmony iteratively imputes batch correction vectors based on cell type centroids in Principal Component (PC) space. (D) Assigning orthology between genes across species (blue and red lines following speciation node) is complicated by gene duplication events (duplication node). Additionally, sub-functionalization (pink dotted box), or neo-functionalization (green dotted box) of gene expression should be considered when assigning orthology and gene function across species (orthology detection).

References

    1. Achim K., Eling N., Vergara H. M., Bertucci P. Y., Musser J., Vopalensky P., et al. (2018). Whole-body single-cell sequencing reveals transcriptional domains in the annelid larval body. Mol. Biol. Evol. 35 1047–1062. 10.1093/molbev/msx336 - DOI - PMC - PubMed
    1. Andrews T. S., Hemberg M. (2018). Identifying cell populations with scRNASeq. Mol. Aspects Med. 59 114–122. 10.1016/j.mam.2017.07.002 - DOI - PubMed
    1. Arendt D., Bertucci P. Y., Achim K., Musser J. M. (2019). Evolution of neuronal types and families. Curr. Opin. Neurobiol. 56 144–152. 10.1016/J.CONB.2019.01.022 - DOI - PMC - PubMed
    1. Arendt D., Musser J. M., Baker C. V. H., Bergman A., Cepko C., Erwin D. H., et al. (2016). The origin and evolution of cell types. Nat. Rev. Genet. 17 744–757. 10.1038/nrg.2016.127 - DOI - PubMed
    1. Bacher R., Kendziorski C. (2016). Design and computational analysis of single-cell RNA-sequencing experiments. Genome Biol. 17:63. 10.1186/s13059-016-0927-y - DOI - PMC - PubMed

LinkOut - more resources