. 2019 Sep 20:2:92.
doi: 10.1038/s41746-019-0172-3. eCollection 2019.

Deep learning algorithm predicts diabetic retinopathy progression in individual patients

Affiliations

Deep learning algorithm predicts diabetic retinopathy progression in individual patients

Filippo Arcadu et al. NPJ Digit Med. .

Erratum in

Abstract

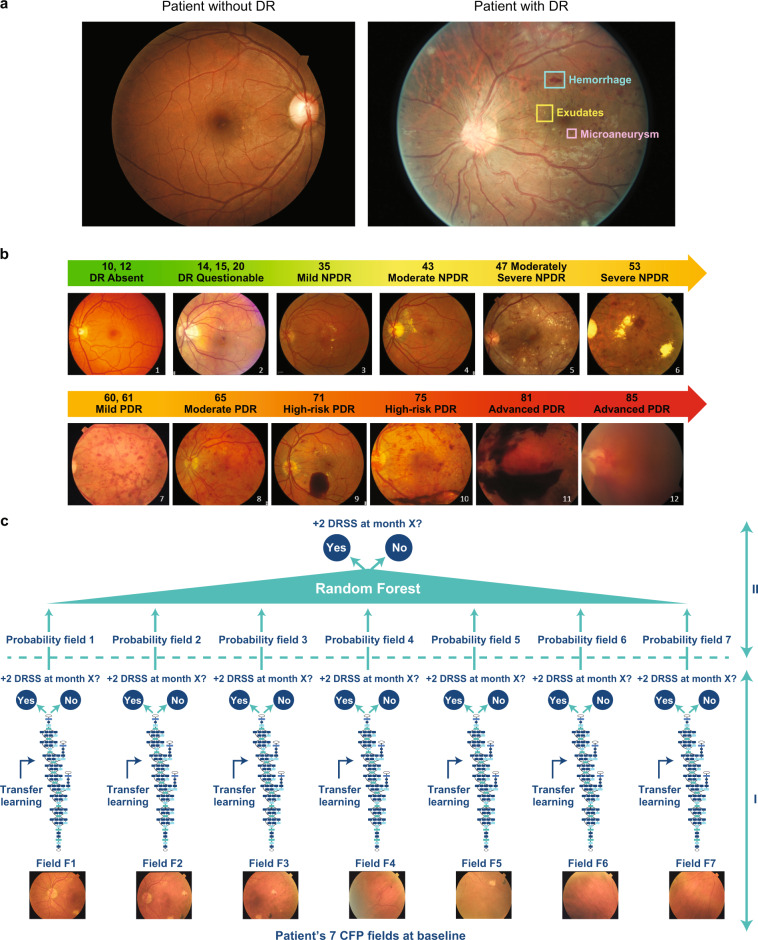
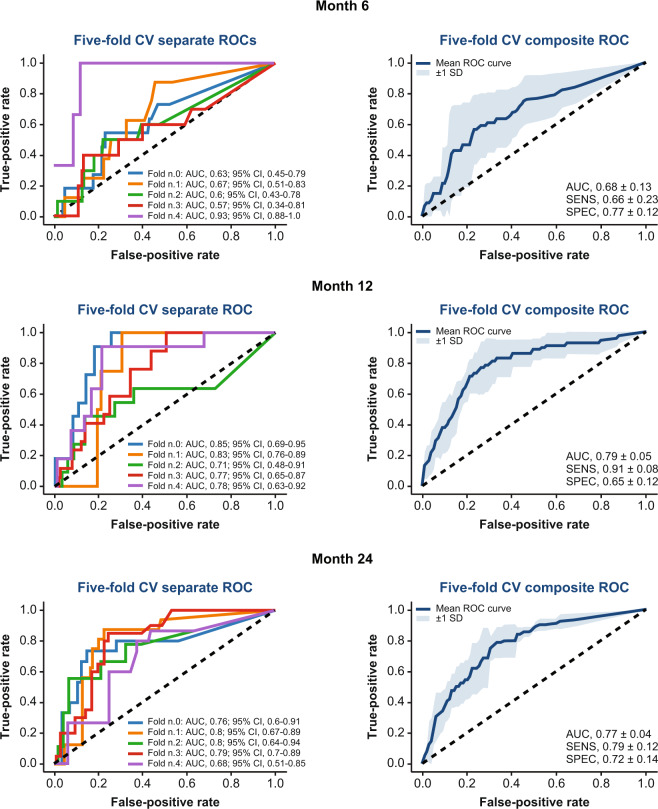
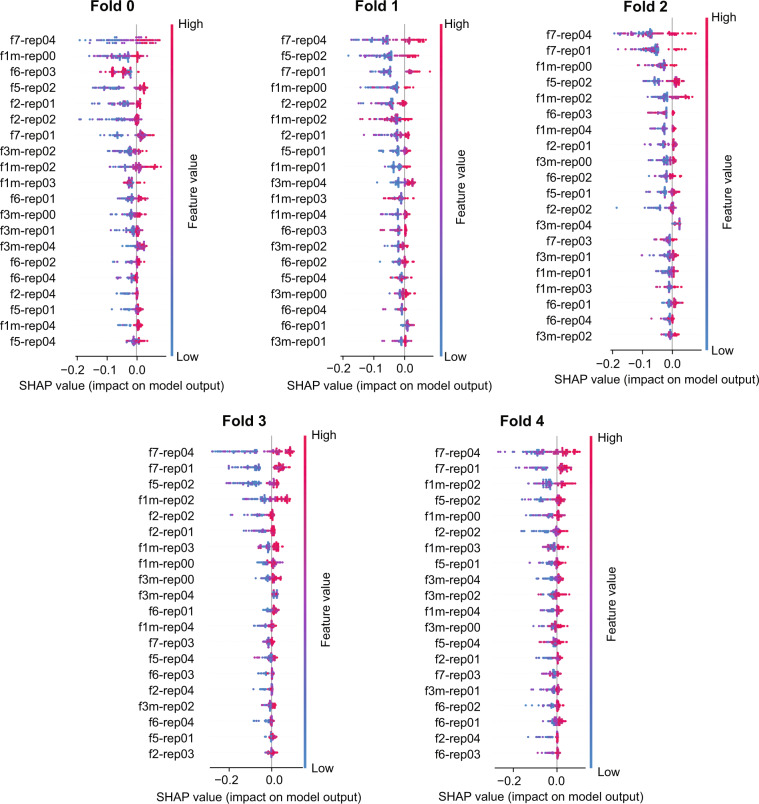
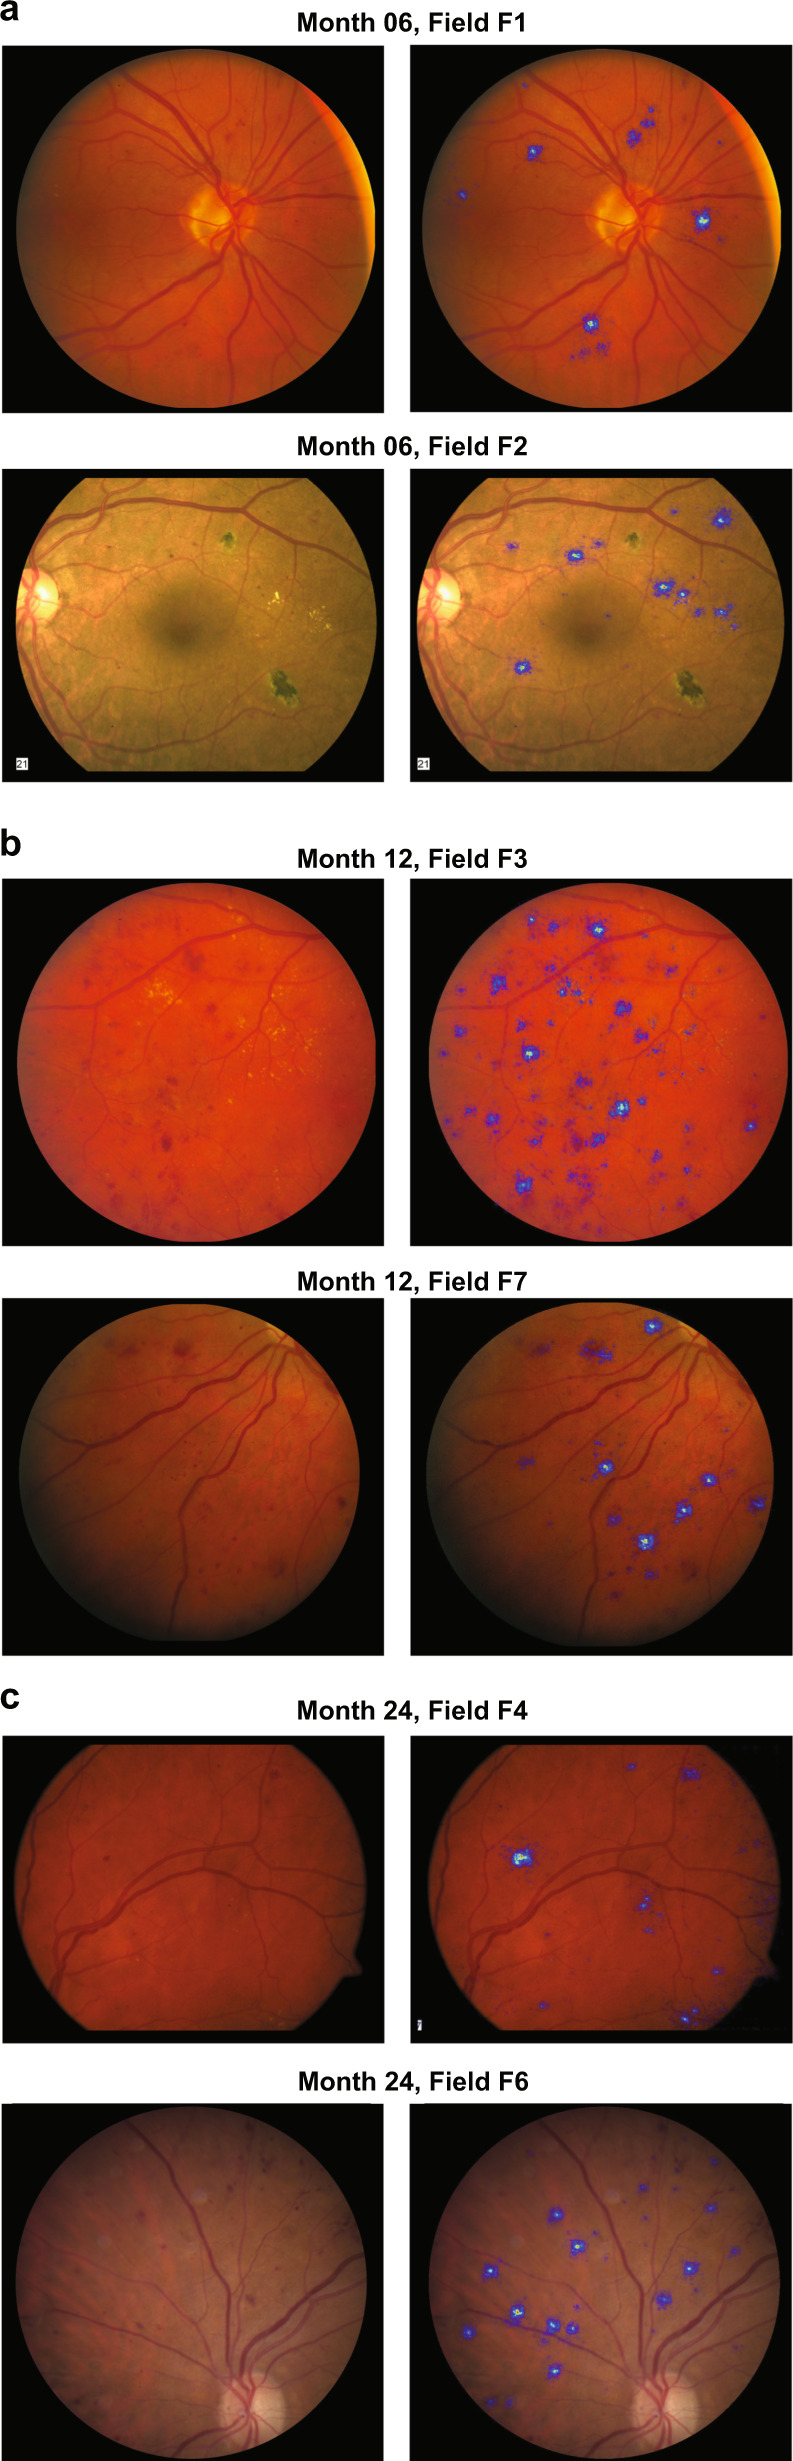
The global burden of diabetic retinopathy (DR) continues to worsen and DR remains a leading cause of vision loss worldwide. Here, we describe an algorithm to predict DR progression by means of deep learning (DL), using as input color fundus photographs (CFPs) acquired at a single visit from a patient with DR. The proposed DL models were designed to predict future DR progression, defined as 2-step worsening on the Early Treatment Diabetic Retinopathy Diabetic Retinopathy Severity Scale, and were trained against DR severity scores assessed after 6, 12, and 24 months from the baseline visit by masked, well-trained, human reading center graders. The performance of one of these models (prediction at month 12) resulted in an area under the curve equal to 0.79. Interestingly, our results highlight the importance of the predictive signal located in the peripheral retinal fields, not routinely collected for DR assessments, and the importance of microvascular abnormalities. Our findings show the feasibility of predicting future DR progression by leveraging CFPs of a patient acquired at a single visit. Upon further development on larger and more diverse datasets, such an algorithm could enable early diagnosis and referral to a retina specialist for more frequent monitoring and even consideration of early intervention. Moreover, it could also improve patient recruitment for clinical trials targeting DR.

Keywords: Macular degeneration; Predictive markers; Vision disorders.


Conflict of interest statement

Competing interestsF.A., F.B., M.P., and A.M. are employees and shareholders of Roche, Inc. J.W. and Z.H. are employees and shareholders of Genentech, Inc.

Figures

Fig. 1
Fig. 1
An overview of retinal imaging features analyzed to assess diabetic retinopathy (DR) severity and a schematic of the study design. a Example of fovea-centered color fundus photographs (CFPs) of a patient without DR (left) and a patient with signs of DR (right). In the CFP of the patient with signs of DR (right), one example each of hemorrhage, exudate, and a microaneurysm are highlighted. Both examples have been selected from the Kaggle DR dataset. b Schematic of the Diabetic Retinopathy Severity Scale (DRSS) established by the Early Treatment Diabetic Retinopathy Study (ETDRS) group to measure DR worsening over time. c Schematic of the two-phase modeling to detect two-step or more DRSS worsening over time. In phase I, field-specific Inception-v3 deep convolutional neural networks (DCNNs) called “field-specific DCNNs” or “pillars” are trained by means of transfer learning to predict whether the patient will progress two ETDRS DRSS steps. In phase II, the probabilities independently generated by the field-specific DCNNs are aggregated by means of random forest
Fig. 2
Fig. 2
Summary of the results for the prediction of two-step or more diabetic retinopathy progression at months 6, 12, and 24 using 7-field color fundus photographs of patients at baseline. AUC area under the curve, CI confidence interval, CV cross-validation, ROC receiver operating characteristic, SD standard deviation, SENS sensitivity, SPEC specificity
Fig. 3
Fig. 3
SHAP plots summarizing the pointwise and average contribution of each deep convolutional neural network (DCNN) to the random forest aggregation. SHAP plots outlining the pointwise contribution of each DCNN. In this example, the SHAP analysis is related to the five folds used for the prediction of DR progression at month 24 is showed. The DCNNs are ordered in importance from top to bottom. The naming convention of the DCNNs highlights the field (‘f1,’ ‘f2,’ etc.) and repetition (‘rep00,’ ‘rep01,’ etc.)
Fig. 4
Fig. 4
Example of attribution maps placed side by side to the original test color fundus image. In each set, the original image is on the left and the attribution map is on the right. The attribution of the deep convolutional neural networks focuses mainly on microaneurysms, hemorrhages, and exudates. a Two examples of attribution maps for the model predicting diabetic retinopathy (DR) progression at month 6. b Two examples of attribution maps for the artificial intelligence model predicting DR progression at month 12. c Two examples of attribution maps for the model predicting DR progression at month 24

References

    1. International Diabetes Federation. IDF diabetes atlas: 8th edn. http://www.diabetesatlas.org/ (2017).
    1. Fong DS, et al. American Diabetes Association. Retinopathy in diabetes. Diabetes Care. 2004;27:S84–S87. doi: 10.2337/diacare.27.2007.S84. - DOI - PubMed
    1. Brar, M. & Ho, A. C. Diabetic eye disease: a multidisciplinary discussion on managing diabetic eye disease. EyeNet Magazine Suppl. 1–4 (2016).
    1. Murchison AP, et al. Nonadherence to eye care in people with diabetes. BMJ Open Diab. Res. Care. 2017;5:e000333. doi: 10.1136/bmjdrc-2016-000333. - DOI - PMC - PubMed
    1. Mazhar K, et al. Los Angeles Latino Eye Study Group Severity of diabetic retinopathy and health-related quality of life: the Los Angeles Latino Eye Study. Ophthalmology. 2011;118:649–655. doi: 10.1016/j.ophtha.2010.08.003. - DOI - PMC - PubMed