. 2019 Sep 20:2:349.
doi: 10.1038/s42003-019-0594-0. eCollection 2019.

Mycobacterium tuberculosis sensor kinase DosS modulates the autophagosome in a DosR-independent manner

Affiliations

Mycobacterium tuberculosis sensor kinase DosS modulates the autophagosome in a DosR-independent manner

Uma S Gautam et al. Commun Biol. .

Abstract

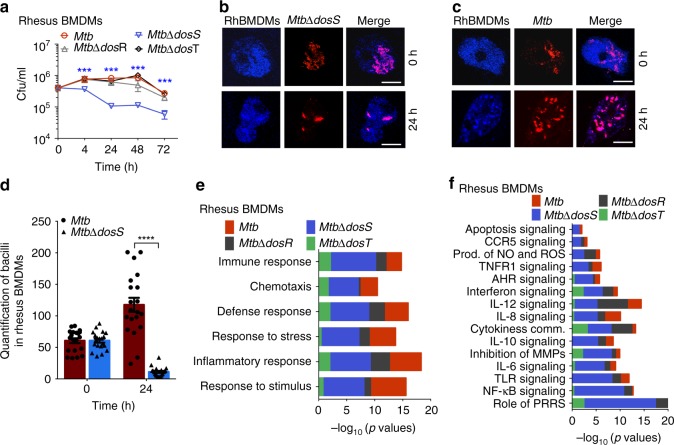
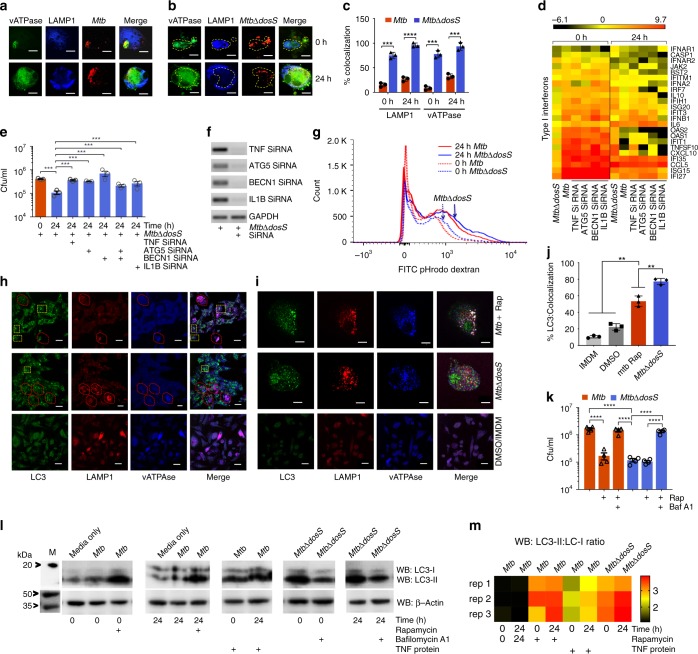
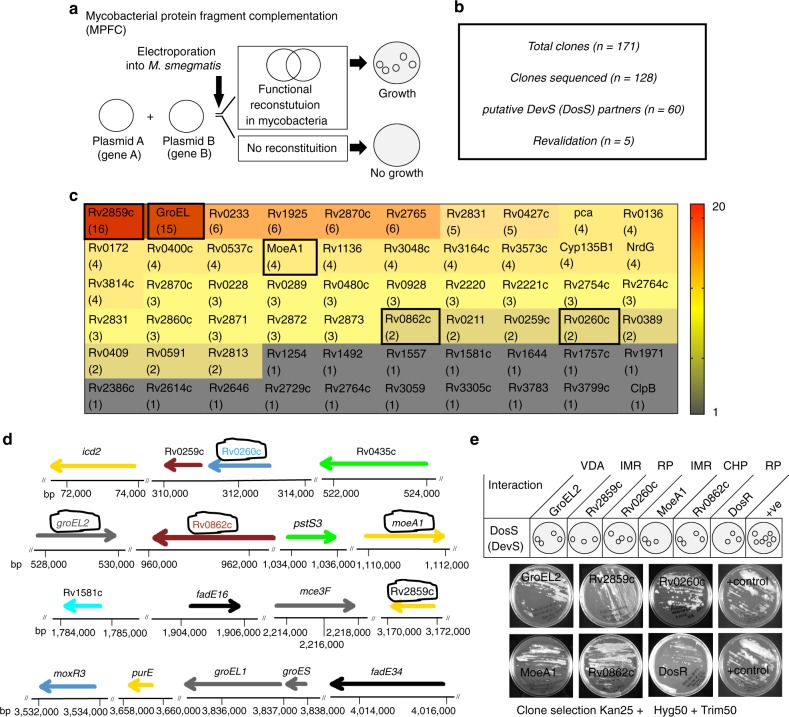
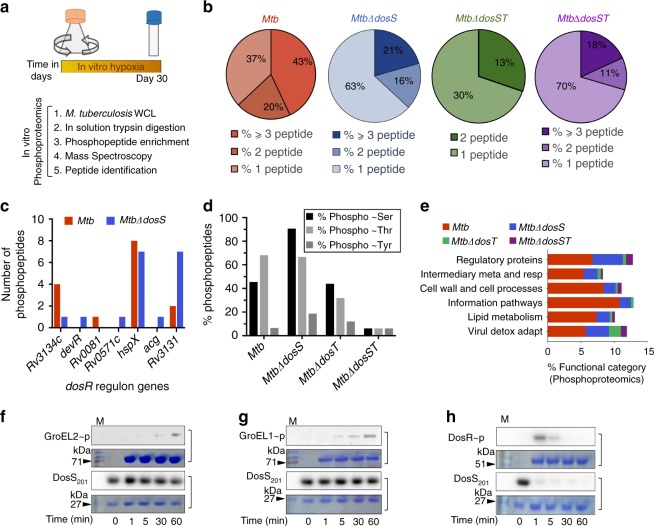
Dormancy is a key characteristic of the intracellular life-cycle of Mtb. The importance of sensor kinase DosS in mycobacteria are attributed in part to our current findings that DosS is required for both persistence and full virulence of Mtb. Here we show that DosS is also required for optimal replication in macrophages and involved in the suppression of TNF-α and autophagy pathways. Silencing of these pathways during the infection process restored full virulence in MtbΔdosS mutant. Notably, a mutant of the response regulator DosR did not exhibit the attenuation in macrophages, suggesting that DosS can function independently of DosR. We identified four DosS targets in Mtb genome; Rv0440, Rv2859c, Rv0994, and Rv0260c. These genes encode functions related to hypoxia adaptation, which are not directly controlled by DosR, e.g., protein recycling and chaperoning, biosynthesis of molybdenum cofactor and nitrogen metabolism. Our results strongly suggest a DosR-independent role for DosS in Mtb.

Keywords: Immunopathogenesis; Microbial genetics.


Conflict of interest statement

Competing interestsThe authors declare no competing interests.

Figures

Fig. 1
Fig. 1
Replication of Mtb, MtbΔdosR, MtbΔdosS, and MtbΔdosT in rhesus macaque bone marrow derived macrophages (RhBMDMs) and animal models. a CFU assay in RhBMDMs showing growth progression of Mtb, MtbΔdosR, MtbΔdosT, and growth reduction of MtbΔdosS. The reductions in CFU numbers of MtbΔdosS are statistically significant (***P = 0.00116399, P = 0.00342701, P = 0.00114028 using t-test at 24, 48, and 72 h. b, c Confocal microscopy. Visual comparison of MtbΔdosS (b) and Mtb (c) (red), and RhBMDMs (blue) at 0 and 24 h post infection. Scale bars 20 μm in panels b and c. d Quantitation of bacilli within macrophages under a fixed magnification using a TCS-SP2 confocal microscope (Leica Microsystems) (obtained from panels b, c). e Macrophage response to Mtb and mutant strains using rhesus macaque specific microarrays. Relative differences in immune responses in significance were plotted as negative logarithms (to the base 10) of P-values for Mtb (red), MtbΔdosR (black), MtbΔdosS (blue), and MtbΔdosT (green). f Various signaling pathways obtained using DAVID. For Statistics, unpaired Student’s t-test (parametric test) was performed using SAS 9.2 (SA Institute, Cary, NC). The data are shown from three biological replicates. Scale bar is 20 μm and applies to all images in panels b and c
Fig. 2
Fig. 2
Effects of TNF gene silencing on bacillary load, supervised hierarchical clustering, and global gene-ontology analysis. RhBMDMs immune responses at 24 h post infection a–j and intraphagosomal Mtb responses within macrophages kn. ai Expression analyses of RhBMDMs infected with MtbΔdosS with or without silencing by TNF siRNA a, b. Hierarchical clustering of a TNF superfamily-coregulated genes and b apoptotic genes from two replicates are shown. Visual image from gel electrophoresis showing TNF silencing by real time PCR c. The symbolic label below panel c applies to both panels a and b, i.e. MtbΔdosS infected only (left), MtbΔdosS infected as well as silenced for TNF expression (right). Red and blue colors indicate higher and lower expression, respectively, relative to uninfected macrophages (baseline). The bars above each panel indicate gene expression magnitude. Measurement of TNF levels by Real-time PCR d; cytokine assay e; CFU assay f; enumeration of apoptotic cells g; transcriptomics of RhBMDMs infected with MtbΔdosS (blue), infected with MtbΔdosS, and silenced for TNF (blue/gray tiled), or Mtb (red) h; confocal microscopy-based detection of TNF secretion [scale bars; top panel (7 μm), middle and bottom panels (30 μm)] I and macrophages infected with MtbΔdosS or Mtb and undergoing apoptosis as shown by TUNEL positivity (green), macrophages (red) and nuclei (blue) j, images for nuclei (green), TNF (red), and macrophages (blue) with merge image shown in the right panel for panels i and j [scale bars; top panel (30 μm), bottom panel (30 μm)]; k A linear regression plot (r2 = 0.42, P < 0.0001) is shown for intraphagosomal Mtb gene expression in RhBMDMs infected with Mtb or MtbΔdosS; ln Gene expression analysis of MtbΔdosS and Mtb grown in RhBMDMs l; Functional categories as per TubercuList m; The expression of DosR regulon genes in intraphagosomal MtbΔdosS and Mtb n; real-time PCR of Mtb genes in intraphagosomal bacteria; Mtb vs. MtbΔdosS **P < 0.05 using Bonferroni unpaired Student’s t-test
Fig. 3
Fig. 3
Autophagy analyses with MtbΔdosS. a–c Intracellular co-localization of Mtb a and MtbΔdosS b with vATPase (green), mycobacteria (red), and LAMP1 (blue); scale bars 10 μm. Colocalization of MtbΔdosS with phagolysosomal marker LAMP1 and vATPase is shown by yellow dotted line on merged images. c Percentage of mycobacteria colocalized. d Heat map of PCR array on Type I interferon signaling (black—low expression, red—high expression). The detection of bacilli at 0 and 24 h post infection in silencing versus non-silencing samples; e CFU assay. f RT-PCR detected TNF-α, IL1B, ATG5, or BECN1 during macrophage infection. g Measurement of pHrodo Dextran at 24 h post infection. h, i LC3, LAMP1, vATPase detection in macrophages infected with Mtb, as well as induced with rapamycin (top panels h and i); infected with MtbΔdosS (center panel h and i). The images in panel i are representative magnified image from panel h top and panel h center. The images in left panel hMtb-infected macrophages; right bottom panel i—uninfected cells. Bottom panels h and i, cells in IMDM media with DMSO as control; scale bars 40 μm (panel h and bottom only panel i), 10 μm (top and center panel i). j % Co-localization of LC3, LAMP1, and vATPase in MtbΔdosS vs. Mtb-infected macrophages k. Bacterial burden in cells infected with Mtb or MtbΔdosS in the with or without rapamycin and bafilomycin-A1. l, m Immunoblotting detects LC3I and LC3II l, their visual heat map m. Western blot data is shown from three biological replicates (uncropped images of the membranes used for imumunodetection are available in Supplementary Fig. 5). Heat map, red higher levels of LC3II detected in the Mtb-infected cells treated with rapamycin (positive control) or infected with MtbΔdosS alone without rapamycin treatment. The data are means ± SEM of three independent experiments. ***P < 0.005 using t-test
Fig. 4
Fig. 4
Protein-protein interactions. a Layout design of principle of MPFC assay in M. smegmatis. b Summary of number of clones obtained by MPFC assays and their validation by DNA sequencing followed by cloning of putative positive clones. c Screening of Mtb H37Rv library identified several DosS-interacting partners in Mtb genome. The vertical bar shows a heat map with clones detected in library screening at least once (black) or multiples times (up to 20, red). d Location of genes for DosS-interacting partners in Mtb genome. The M. smegmatis containing interacting control plasmids grown on 7H11/Trimethoprim confirms the assay validation. VDA virulence and detoxification, IMR intermediary metabolism and respiration, RP regulatory proteins, CHP conserved hypotheticals. e The clones repetitively identified and shown with a circular line drawn in the panel d were further revalidated by MPFC assay against DosS. Growth of bacteria on selection plates indicates protein–protein interactions between DosS and GroEL2 or Rv2859c or Rv0994 or Rv0260c
Fig. 5
Fig. 5
In vitro phosphoproteomics, functional classification of phosphoproteins and phosphotransfer assay. a Schematic design of hypoxia study and various steps used in phosphoproteomics. b The distribution of proteins detected in hypoxia is shown as a percentage of various functional categories in Mtb genome as per TubercuList (http://tuberculist.epfl.ch/). c The number of phosphopeptides representing dosR regulon in Mtb and MtbΔdosS mutant. The percent phosphorylated proteins at either the residue serine or threonine or tyrosine d and functional category detected as per TubercuList e in Mtb and dos mutants. f and g In vitro phosphotransfer assay using purified proteins; phosphotransfer from DosS to GroEL2 f, GroEL1 g and DosR h. DosR protein was used as a positive control. Uncropped images of the membranes used for imumunodetection are available in Supplementary Fig. 6

References

    1. Russell DG. Who puts the tubercle in tuberculosis? Nat. Rev. Microbiol. 2007;5:39–47. doi: 10.1038/nrmicro1538. - DOI - PubMed
    1. Paige C, Bishai WR. Penitentiary or penthouse condo: the tuberculous granuloma from the microbe’s point of view. Cell. Microbiol. 2010;12:301–309. doi: 10.1111/j.1462-5822.2009.01424.x. - DOI - PubMed
    1. Wayne LG, Diaz GA. Autolysis and secondary growth of Mycobacterium tuberculosis in submerged culture. J. Bacteriol. 1967;93:1374–1381. - PMC - PubMed
    1. Gautam US, Sikri K, Vashist A, Singh V, Tyagi JS. Essentiality of DevR/DosR interaction with SigA for the dormancy survival program in Mycobacterium tuberculosis. J. Bacteriol. 2014;196:790–799. doi: 10.1128/JB.01270-13. - DOI - PMC - PubMed
    1. Rustad TR, Sherrid AM, Minch KJ, Sherman DR. Hypoxia: a window into Mycobacterium tuberculosis latency. Cell. Microbiol. 2009;11:1151–1159. doi: 10.1111/j.1462-5822.2009.01325.x. - DOI - PubMed

Publication types

MeSH terms

Substances