. 2019 Dec;30(12):2694-2703.
doi: 10.1111/jce.14201. Epub 2019 Oct 3.

STAR mapping method to identify driving sites in persistent atrial fibrillation: Application through sequential mapping

Affiliations

STAR mapping method to identify driving sites in persistent atrial fibrillation: Application through sequential mapping

Shohreh Honarbakhsh et al. J Cardiovasc Electrophysiol. 2019 Dec.

Abstract

Introduction: The optimal way to map localized drivers in persistent atrial fibrillation (AF) remains unclear. The objective of the study was to apply a novel vector mapping approach called Stochastic Trajectory Analysis of Ranked signals (STAR) in AF.

Methods and results: Patients having persistent AF ablation were included. Early sites of activation (ESA) identified on global STAR maps created with basket catheters were used to guide AF ablation post-pulmonary vein isolation (PVI). All patients also had sequential STAR maps created with ≥10 PentaRay recordings of 30 seconds. These were validated offline in their ability to identify the ESA targeted with a study-defined ablation response (AF termination or cycle length [CL] slowing of ≥30 ms). Thirty-two patients were included in whom 92 ESA were identified on the global STAR maps, with 73 of 83 targeted sites demonstrating an ablation response (24 AF termination and 49 CL slowing). Sixty-one out of 73 (83.6%) ESA were also identified on the sequential STAR maps. These showed greater consistency (P < .001), were seen pre- and post-PVI (P < .001) and were more likely to be associated with AF termination on ablation (P = .007). The sensitivity and specificity of sequential mapping for the detection of ESA with an ablation response was 84.9% (95% confidence interval [CI] = 74.6-92.2) and 90.0% (95% CI = 55.5-99.8), respectively. During a follow-up of 19.4 ± 3.7 months, 28 (80%) patients were free from AF/atrial tachycardia.

Conclusions: STAR mapping consistently identified ESA in all patients and the ablation response was compatible with ESA being driver sites. Mechanistically important ESA were successfully identified using sequential recordings.

Keywords: atrial fibrillation; atrial tachycardia; catheter ablation; drivers; mapping.


Figures

Figure 1
Figure 1
CONSORT flow diagram summarizing procedural outcomes
Figure 2
Figure 2
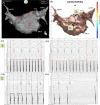
A‐C, Patient ID 9. Demonstrates (A) CARTO LA map in an anterior‐posterior view that shows localized ablation for 2.2 minutes at the low anterior wall post‐PVI which was guided by (B) a global STAR LA map in an anterior‐posterior view that shows an ESA mapped to this area (highlighted by the number 1). C, As shown on the electrograms obtained from BARD ablation here resulted in CL slowing from 168 to 203 ms when measured across 10 beats with the PentaRay catheter positioned in the LA appendage. In the study, 30 beats were used to assess CL slowing however, for figure illustration, 10 beats were used to allow greater electrogram resolution. The global STAR map also highlights two further ESA, one mapped to the high lateral wall and one mapped to the roof. Ablation at the ESA on the lateral wall resulted in AF termination to sinus rhythm. The ESA on the roof was therefore not targeted. AF, atrial fibrillation; CL, cycle length; ESA, early sites of activation; LA, left atrial; LAA, left atrial appendage; LUPV, left upper pulmonary vein; MVA, mitral valve annulus; PVI, pulmonary vein isolation; RUPV, right upper pulmonary vein; STAR, Stochastic Trajectory Analysis of Ranked
Figure 3
Figure 3
A‐C, Patient ID 11. Demonstrates (A) a CARTO LA map in an anterior‐posterior view that shows WACAs to achieve PVI and cluster ablation at mid anterior wall and roof as guided by (B) a global STAR LA map in an anterior‐posterior view which highlights two ESA, (1) mid anterior wall (highlighted by number 1) (2) roof (highlighted by number 2) (Ci‐iv) where ablation for (i‐ii) 3.0 minutes resulted in CL slowing (from 198 to 248 ms) with ablation of the first ESA and (iii‐iv) 2.2 minutes at second ESA resulted in AF termination to AT which was ablated and sinus rhythm achieved as shown on the BARD electrograms. AF, atrial fibrillation; AT, atrial tachycardia; CL, cycle length; ESA, early sites of activation; LA, left atrial; LAA, left atrial appendage; LUPV, left upper pulmonary vein; MVA, mitral valve annulus; PVI, pulmonary vein isolation; RUPV, right upper pulmonary vein; STAR, Stochastic Trajectory Analysis of Ranked; WACA, wide area circumferential ablation
Figure 4
Figure 4
A‐D, Patient ID 32. Demonstrates (A) a CARTO LA map in a tilted lateral view where 3.0 minutes of ablation resulted in (B) AT as shown on the electrograms obtained from BARD. (C) The ablation was guided by the global STAR LA map in a lateral view that shows an ESA. The electrograms obtained at the ESA as highlighted by an asterix is leading neighboring electrodes. The red cross highlights the site of annotation of the atrial electrograms by the STAR mapping method. (D) A sequential STAR LA map in a lateral view demonstrates the same ESA and again the electrograms obtained at the ESA is leading neighboring electrodes. AT, atrial tachycardia; ESA, early sites of activation; LA, left atrial; LAA, left atrial appendage; LUPV, left upper pulmonary vein; MVA, mitral valve annulus; STAR, Stochastic Trajectory Analysis of Ranked
Figure 5
Figure 5
A‐C, Patient ID 22. Demonstrates (A) a global STAR map in anterior‐posterior view highlighting two ESA. Ablation of the ESA mapped to the anterior LAA (highlighted by number 1) resulted in CL slowing. The ESA mapped to the anteroseptum (highlighted by number 2) also resulted in CL slowing on ablation. B, Amalgamation STAR map of eight sequential PentaRay recordings in anterior‐posterior view highlighting the same two ESA that were identified on the global STAR map. C, BARD signals demonstrating CL slowing from 145 to 182 ms on ablation at the ESA at the anteroseptum. CL, cycle length; ESA, early sites of activation; LAA, left atrial appendage; LUPV, left upper pulmonary vein; MVA, mitral valve annulus; RUPV, right upper pulmonary vein; STAR, Stochastic Trajectory Analysis of Ranked

References

    1. Haissaguerre M, Hocini M, Denis A, et al. Driver domains in persistent atrial fibrillation. Circulation. 2014;130(7):530‐538. - PubMed
    1. Honarbakhsh S, Schilling RJ, Dhillon G, et al. A novel mapping system for panoramic mapping of the left atrium: application to detect and characterize localized sources maintaining atrial fibrillation. JACC Clin Electrophysiol. 2018;4(1):124‐134. - PMC - PubMed
    1. Honarbakhsh S, Schilling RJ, Providencia R, et al. Characterization of drivers maintaining atrial fibrillation: correlation with markers of rapidity and organization on spectral analysis. Heart Rhythm. 2018;15:1296‐1303. - PubMed
    1. Narayan SM, Baykaner T, Clopton P, et al. Ablation of rotor and focal sources reduces late recurrence of atrial fibrillation compared with trigger ablation alone: extended follow‐up of the CONFIRM trial (Conventional Ablation for Atrial Fibrillation With or Without Focal Impulse and Rotor Modulation). J Am Coll Cardiol. 2014;63(17):1761‐1768. - PMC - PubMed
    1. Lee G, Kumar S, Teh A, et al. Epicardial wave mapping in human long‐lasting persistent atrial fibrillation: transient rotational circuits, complex wavefronts, and disorganized activity. Eur Heart J. 2014;35(2):86‐97. - PubMed

Publication types

MeSH terms