. 2019 Sep 24;28(13):3353-3366.e5.
doi: 10.1016/j.celrep.2019.07.065.

Smad7 Controls Immunoregulatory PDL2/1-PD1 Signaling in Intestinal Inflammation and Autoimmunity

Affiliations

Smad7 Controls Immunoregulatory PDL2/1-PD1 Signaling in Intestinal Inflammation and Autoimmunity

Lucien P Garo et al. Cell Rep. .

Abstract

Smad7, a negative regulator of TGF-β signaling, has been implicated in the pathogenesis and treatment of inflammatory bowel diseases (IBDs), including Crohn's disease (CD) and ulcerative colitis (UC). Here, we found that Smad7 mediates intestinal inflammation by limiting the PDL2/1-PD1 axis in dendritic cells (DCs) and CD4+T cells. Smad7 deficiency in DCs promotes TGF-β responsiveness and the co-inhibitory molecules PDL2/1 on DCs, and it further imprints T cell-PD1 signaling to promote Treg differentiation. DC-specific Smad7 deletion mitigates DSS-induced colitis by inducing CD103+PDL2/1+DCs and Tregs. In addition, Smad7 deficiency in CD4+T cells promotes PD1 and PD1-induced Tregs in vitro. The transfer of Smad7-deficient CD4+T cells enhances Tregs in vivo and protects against T cell-mediated colitis. Furthermore, Smad7 antisense ameliorates DSS-induced UC, increasing TGF-β and PDL2/1-PD1 signaling. Enhancing PD1 signaling directly via Fc-fused PDL2/1 is also beneficial. Our results identify how Smad7 mediates intestinal inflammation and leverages these pathways therapeutically, providing additional strategies for IBD intervention.

Keywords: CD103; DC; IBD; PD1; PDL1; PDL2; Smad7; TGF-β; Treg; UC; dendritic cell; inflammatory bowel disease; ulcerative colitis.


Figures

Figure 1.
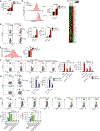
Figure 1.. Smad7 Deficiency Promotes a PDL2+CD103+ Regulatory Phenotype in DCs
(A) Representative fluorescence-activated cell sorting (FACS) histograms (left) and median fluorescence intensities (MFIs) (right) of PDL2, PDL1, and CD103 in CD11c+ MLN DCs from naive Smad7fl/fl and DC-Smad7−/− mice (n = 11). (B) ELISA quantification of secreted TGF-β by MLN DCs from these mice (n = 4). (C) Representative FACS histograms (left) and MFIs (right) of PDL2, PDL1, and CD103 in CD11c+ BMDCs generated with or without TGF-β (30 ng/mL) from WT mice (n = 5). (D) Western blot of Smad7 in WT CD11c+ BMDCs stimulated with or without TGF-β (2.5 ng/mL) for 30 min. (E) ChIP analysis of Smad3 binding promoter regions of Pdcdl2 (PDL2), Pdcdl1 (PDL1), and Itgae (CD103) in WT CD11c+ DCs stimulated with or without TGF-β (10 ng/mL). ChIP data expressed as fold enrichment as compared to input control (n = 3). (F and G) Luciferase reporter activity of Pdcdl2, Pdcdl1, and Itgae promoters in HEK293 cells stimulated (F) with control or Smad3 construct or (G) with or without TGF-β (2 ng/mL) (n = 3). Luciferase activity as relative activity fold change (FC) from (F) control or (G) media condition. (H) Representative FACS histograms (left) and MFIs (right) of PDL2 and PDL1 in CD103+ and CD103 MLN CD11c+ DCs from WT mice (n = 4). Data representative of ≥3 independent experiments. MFI data reflective of CD11c+ population and expressed as FC from (A) Smad7fl/fl condition, (C) media condition, or (H) CD103 condition. Means ± SEMs. *p < 0.05, **p < 0.01, and ***p < 0.001 by unpaired t test. See also Figure S1.
Figure 2.
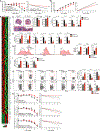
Figure 2.. Smad7 Restricts DC Responsiveness to TGF-β and Their Ability to Induce Tregs
(A) ELISA quantification of secreted TGF-β from Smad7fl/fl and Smad7−/− MLN CD11c+ DCs stimulated with or without TGF-β (0.5 ng/mL), for 12 h, washed, and cultured for another 48 h (n = 4). (B) Representative FACS histograms (left) and MFIs (right) of phospho-Smad2/3 in BMDCs stimulated with or without TGF-β (2 ng/mL), for 1 h (n = 6). (C) qRT-PCR (using Qiagen Mouse TGF-β Signaling Pathway RT2 Profiler PCR Array) of TGF-β and associated TGF-β signaling molecules in Smad7fl/fl and Smad7−/− CD11c+ DCs stimulated with or without TGF-β (10 ng/mL), for 10 h. (D) Representative FACS plots (left), frequencies (center), and cell counts per well (right) of Foxp3-GFP+ populations in naive CD4+ Foxp3-GFPT cells co-cultured with MLN CD11c+ DCs from Smad7fl/fl or DC-Smad7−/− mice at a 1:3 DC:T cell ratio, with or without TGF-β (0.5 ng/mL), for 4 days (n = 8). (E) Representative FACS histograms (left) and frequencies (right) of PD1 in naive CD4+ T cells co-cultured with MLN CD11c+ DCs from Smad7fl/fl or DC-Smad7−/− mice at a 1:3 DC:T cell ratio, for 18 h. (F) Representative FACS plots (left), frequencies (center), and cell counts per well (right) of Foxp3-GFP+ populations in naive CD4+Foxp3-GFP T cells co-cultured with MLN CD11c+ DCs from Smad7fl/fl or DC-Smad7−/− mice at a 1:3 DC:T cell ratio, with or without anti-TGF-β (10 μg/mL) and/or anti-PD1 (10 μg/mL), for 4 days (n = 3). (G) Representative FACS plots (left), frequencies (center), and cell counts per well (right) of Foxp3+ populations in naive CD4+ T cells from WT or PD1-deficient mice co-cultured with CD103 or CD103+ DCs from WT mice at a 1:3 DC:T cell ratio, for 3 days (n = 3). (H) Representative FACS plots (top), frequencies (bottom left), and cell counts per well (bottom right) of Foxp3-GFP+ populations in naive CD4+Foxp3-GFP T cells stimulated with or without TGF-β (0.5 ng/mL), recombinant plate-bound PDL1-Fc or PDL2-Fc (30 μg/mL), and/or anti-TGF-β (10 μg/mL), for 4 days (n = 6). MFI data reflective of (B) CD11c+ or (E) CD4+ populations and expressed as FC from Smad7fl/fl condition. Data representative of ≥3 independent experiments. Means ± SEMs. *p < 0.05, **p < 0.01, and ***p < 0.001 by unpaired t test. See also Figure S2.
Figure 3.
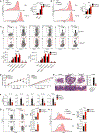
Figure 3.. Smad7 Deficiency in DCs Protects Mice against DSS-Induced Colitis
(A) Percentage body weight changes (left) and linear regression analysis (right) of Smad7fl/fl and DC-Smad7−/− mice treated with 3% DSS in drinking water for 7 days (n = 8). (B) Disease activity index, a composite of body weight loss, blood in stool, and consistency of stool (higher score corresponds to colitis severity) (left) and linear regression analysis (right) of Smad7fl/fl and DC-Smad7−/− mice treated with 3% DSS in drinking water for 7 days (n = 9). (C) Representative histological sections with H&E (left) and scores (n = 10) (right) of colitic mice based on degree of ulceration at day 7, scored blinded by a pathologist at HRHCF. Scale bars represent ~1 mm (top) and ~100 μm (bottom). (D) Colon lengths of colitic mice at day 7 (n = 13). (E) Representative NanoString (immunology panel) heatmap of inflammatory and regulatory genes in distal colon from colitic Smad7fl/fl and DC-Smad7−/− mice. Important upregulated and downregulated genes of interest in DC-Smad7−/− are highlighted in red and green, respectively. (F) qRT-PCR validation of selected genes, including IL-1β, IL-6, TNF-α, and IL-18 expression in these samples (n = 3). (G) qRT-PCR of TGF-β, CD103, IL-12, IL-1β, IL-6, IL-23, and TNF-α expression in MLN CD11c+ DCs from colitic mice (n = 5). (H) Representative FACS histograms (left) and MFIs (right) of PDL2, PDL1, and CD103 in MLN CD11c+ DCs from colitic mice (n = 3). MFI data reflective of CD11c+ population and expressed as FC from Smad7fl/fl condition. (I) qRT-PCR of Foxp3, IFN-γ, and IL-17a in MLN CD4+ T cells (n = 5). (J) Representative FACS plots (left) and frequencies (right) of Foxp3+, IFN-γ+, and IL-17a+ populations in MLN (top) and lamina propria (LP) (bottom) CD4+ T cells (n = 4–10). (K) Percentage of body weight scores (left) and linear regression analyses (right) of Smad7fl/fl and DC-Smad7−/− mice treated during DSS administration, as indicated. Mice were treated with either immunoglobulin (Ig) control, (top) anti-CD25 (500 μg) (center), or anti-PD1 (250 μg) (bottom), given i.p. every other day 4 times, starting with DSS administration at day 0 (n = 3–4). Only control colitis body weight loss data for anti-CD25 are shown. Control data for anti-PD1 are identical (data not shown). Data representative of ≥3 independent experiments. qRT-PCR data expressed as FC from Smad7fl/fl condition. Means ± SEMs. *p < 0.05, **p < 0.01, ***p < 0.001 by unpaired t test. See also Figure S3.
Figure 4.
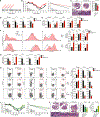
Figure 4.. Smad7 Limits PD1 on CD4+ T Cells and PD1-Mediated Treg Differentiation and Promotes T Cell-Mediated Colitis
(A) Representative FACS histograms (left) and MFIs (right) of phospho-Smad2/3 in naive CD4+ T cells from Smad7fl/fl and T-Smad7−/− mice stimulated with or without TGF-β (2.5 ng/mL), for 1 h (n = 4). (B) Representative FACS histograms (left) and MFIs (right) of PD1 in naive CD4+ T cells from these mice stimulated with low-dose plate-bound anti-CD3/CD28 (1 μg/mL) with or without TGF-β (2.5 ng/mL), for 18 h (n = 8). (C) Representative FACS plots (top), frequencies (bottom left), and cell counts per well (bottom right) of Foxp3+ populations in naive CD4+ T cells from these mice stimulated with or without TGF-β (0.5 ng/mL) and recombinant plate-bound PDL1-Fc or PDL2-Fc (30 μg/mL), for 4 days (n = 5). (D–H) Colitis was induced by adoptive transfer of 6 × 10⁵ CD4+CD45RBhi T cells i.p. into Rag-1 mice, followed by monitoring for 7 weeks. (D) Percentage body weight changes (left) and linear regression analysis (right) of Rag-1−/− mice injected with CD4+CD45RBhi T cells from Smad7fl/fl or T-Smad7−/− mice (n = 8). (E) Representative histological sections stained with H&E of distal colons (left) and histological scores (n = 8) (right) from recipient Rag-1−/− mice, based on the degree of epithelial damage, as scored blinded by a pathologist at HRHCF. Scale bars represent ~1 mm (top) and ~100 μm (bottom). (F) qRT-PCR of IL-12, IL-1β, IL-6, IL-23, and TNF-α in colitic tissue from recipient mice (n = 8). (G) Representative FACS plots (left) and frequencies (right) of Foxp3+ populations in MLN (top) and splenic (bottom) CD4+ T cells from recipient mice at 7 weeks (n = 5–8). (H) Representative FACS histograms (left) and frequencies (right) of PD1 in MLN (top) and splenic (bottom) CD4+ T cells from recipient mice at 1 week (n = 6). Data representative of ≥2 independent experiments. qRT-PCR and MFI (reflective of CD4+ population) data expressed as FC from Smad7fl/fl media condition. Statistical comparisons to Smad7fl/fl condition. Means ± SEMs. *p < 0.05, **p < 0.01, and ***p < 0.001 by unpaired t test. See also Figures S4 and S5.
Figure 5.
Figure 5.. Smad7 Inhibition Ameliorates DSS-Induced Colitis in Mice
(A) Schematic of DSS colitis induction (3% DSS in water for 7 days, untreated drinking water for 7 days) and Smad7-as treatment i.p. (250 μg per mouse every other day 4 times). (B) Percentage body weight changes (left) and linear regression analysis (right) of colitic mice treated with Smad7-as or its oligonucleotide control (n = 8). (C) Representative histopathological sections with H&E (left) and scores (n = 8) (right) based on the degree of ulceration at day 14, scored blinded by a pathologist at HRHCF. Scale bars represent ~1 mm (top) and ~100 μm (bottom). (D) qRT-PCR of Smad7, IL-1β, IL-6, and TNF-α expression in colitic tissue (n = 10–15). (E) qRT-PCR of Smad7, TGF-β, PDL2, PDL1, and CD103 expression in MLN CD11c+ DCs from colitic mice (n = 10). (F) Representative FACS histograms (left) and MFIs (right) of PDL2, PDL1, and CD103 in MLN (top) and splenic (bottom) CD11c+ DCs from colitic mice (n = 5–10). MFI data reflective of CD11c+ population and expressed as FC from control condition. (G) qRT-PCR of Smad7, Foxp3, IFN-γ, IL-17a, and PD1 expression in CD4+ MLN T cells (n = 5–10). (H) Representative FACS plots (left) and frequencies (right) of Foxp3+, IFN-γ+, and IL-17a+ populations in CD4+ MLN (top), splenic (center), and LP (bottom) T cells (n = 4–5). (I–K) DSS colitis was induced (3% DSS in water for 7 days, untreated drinking water for 7 days) and PDL1-fc or PDL2-fc treatment were given i.p. (100 μg per mouse every other day 4 times) as in (A). (I) Percentage body weight changes (left) and linear regression analysis (right) of colitic mice treated with PDL1-Fc, PDL2-Fc, or Ig control (n = 5–7). (J) Representative histopathological sections (left) and scores (right) based on the degree of ulceration, scored blinded by a pathologist at HRHCF (n = 8). Scale bars represent ~1 mm (top) and ~100 μm (bottom). (K) qRT-PCR of Foxp3 expression in colitic tissue (n = 4–5). Data representative of ≥3 independent experiments. qRT-PCR and MFI data expressed as FC from control condition. Means ± SEMs. *p < 0.05, **p < 0.01, and ***p < 0.001 by unpaired t test.

Similar articles

Cited by

References

    1. Afrakhte M, Morén A, Jossan S, Itoh S, Sampath K, Westermark B, Heldin CH, Heldin NE, and ten Dijke P (1998). Induction of inhibitory Smad6 and Smad7 mRNA by TGF-beta family members. Biochem. Biophys. Res. Commun 249, 505–511. - PubMed
    1. Ajay AK, Kim TM, Ramirez-Gonzalez V, Park PJ, Frank DA, and Vaidya VS (2014). A bioinformatics approach identifies signal transducer and activator of transcription-3 and checkpoint kinase 1 as upstream regulators of kidney injury molecule-1 after kidney injury. J. Am. Soc. Nephrol 25, 105–118. - PMC - PubMed
    1. Bain CC, Montgomery J, Scott CL, Kel JM, Girard-Madoux MJH, Martens L, Zangerle-Murray TFP, Ober-Blöbaum J, Lindenbergh-Kortleve D, Samsom JN, et al. (2017). TGFβR signalling controls CD103+CD11b+ dendritic cell development in the intestine. Nat. Commun 8, 620. - PMC - PubMed
    1. Baugé C, Attia J, Leclercq S, Pujol JP, Galéra P, and Boumédiene K (2008). Interleukin-1beta up-regulation of Smad7 via NF-kappaB activation in human chondrocytes. Arthritis Rheum. 58, 221–226. - PubMed
    1. Bertha M, Bellaguara E, Kuzel T, and Hanauer S (2017). Checkpoint Inhibitor-Induced Colitis: A New Type of Inflammatory Bowel Disease? ACG Case Rep. J 4, e112. - PMC - PubMed

Publication types