. 2019 Sep 24;9(10):1363.
doi: 10.3390/nano9101363.

Two-Step Exfoliation of WS2 for NO2, H2 and Humidity Sensing Applications

Affiliations

Two-Step Exfoliation of WS2 for NO2, H2 and Humidity Sensing Applications

Valentina Paolucci et al. Nanomaterials (Basel). .

Abstract

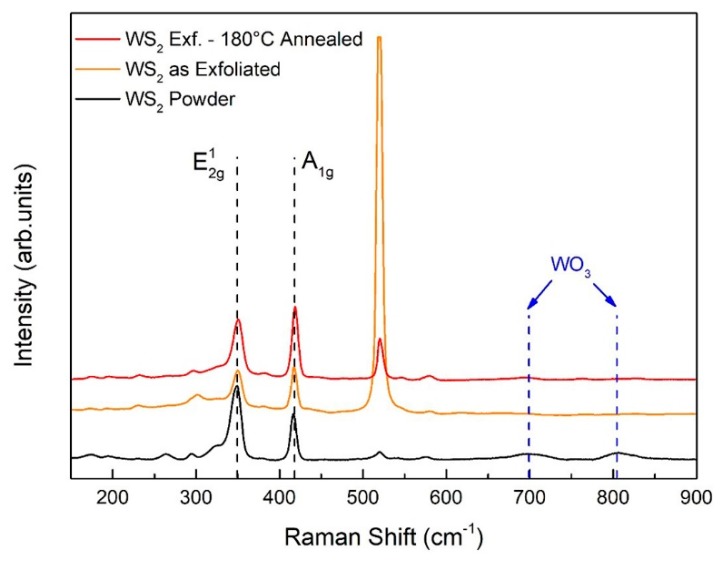
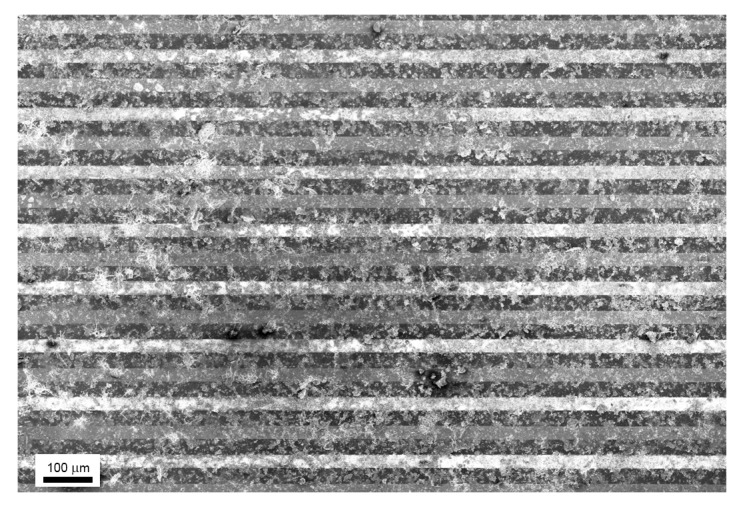
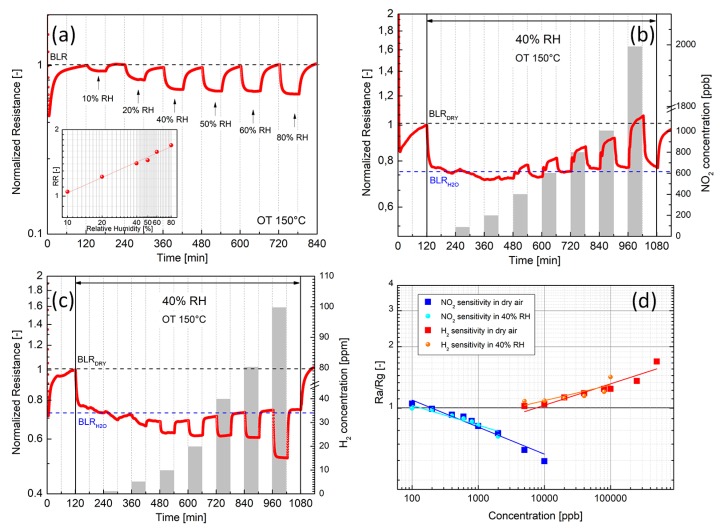
WS2 exfoliated by a combined ball milling and sonication technique to produce few-layer WS2 is characterized and assembled as chemo-resistive NO2, H2 and humidity sensors. Microstructural analyses reveal flakes with average dimensions of 110 nm, "aspect ratio" of lateral dimension to the thickness of 27. Due to spontaneous oxidation of exfoliated WS2 to amorphous WO3, films have been pre-annealed at 180 °C to stabilize WO3 content at ≈58%, as determined by X-ray Photoelectron Spectroscopy (XPS), Raman and grazing incidence X-ray Diffraction (XRD) techniques. Microstructural analysis repeated after one-year conditioning highlighted that amorphous WO3 concentration is stable, attesting the validity of the pre-annealing procedure. WS2 films were NO2, H2 and humidity tested at 150 °C operating Temperature (OT), exhibiting experimental detection limits of 200 ppb and 5 ppm to NO2 and H2 in dry air, respectively. Long-term stability of the electrical response recorded over one year of sustained conditions at 150 °C OT and different gases demonstrated good reproducibility of the electrical signal. The role played by WO3 and WS2 upon gas response has been addressed and a likely reaction gas-mechanism presented. Controlling the microstructure and surface oxidation of exfoliated Transition Metal Dichalcogenides (TMDs) represents a stepping-stone to assess the reproducibility and long-term response of TMDs monolayers in gas sensing applications.

Keywords: 2D-materials; H2; NO2; WS2; cross sensitivity; exfoliation; gas sensors.


Conflict of interest statement

The authors declare no conflict of interest. The funders had no role in the design of the study, in the collection, analyses, or interpretation of data, in the writing of the manuscript, or in the decision to publish the results.

Figures

Figure 1
Figure 1
Comparison of the effect of long-time ball milling on WS2 exfoliation: (a) Comparison of the particle size distribution of the starting WS2 commercial powder (blue), 72 h ball milled (red) and 72 h ball milled and 90 min sonicated (green), (b) AFM picture of 72 h ball milled and 90 min sonicated and associated thickness profile along the white line, (c) TEM picture of the 72 h ball milled and 90 min sonicated WS2, (d) Comparison of the particle size distribution in case of 2 h ball milling, (e) AFM picture of 2 h ball milled and 90 min sonicated and associated thickness profile, (f) TEM picture of the flakes obtained by 2 h ball milling and 90 min sonication of WS2.
Figure 2
Figure 2
(a) AFM picture of the 2 h ball milled and 90 min sonicated WS2, (b) thickness profile of the stacked flake along the white line of Figure (a), (c) low-resolution TEM picture of an exfoliated flake.
Figure 3
Figure 3
(a,c) TEM of 2 h ball milled and 90 min sonicated WS2, (b) HRTEM corresponding to the circled area shown in figure (a) with highlighted the interlayer distance (0.63 nm) and lattice spacing (0.27 nm and 0.25 nm), corresponding to (100) and (101) planes of WS2 respectively, (d) HRTEM of the edge of the flake corresponding to the circled area shown in figure (c) with highlighted the 7 nm thick edge corresponding to 11 layers. The inset shows the Selected Area Electron Diffraction (SAED) of the flake.
Figure 4
Figure 4
(ad) AFM images of WS2 exfoliated corresponding to four different samples prepared under the same conditions (i.e., 2 h ball milling and 90 min sonication). Statistical analysis corresponding to thickness distribution (e), Lateral dimensions (f) and surface area coverage (g).
Figure 5
Figure 5
X-Ray Photoemission Spectroscopy (XPS) spectra of W 4f core level acquired respectively on (a) pristine WS2 commercial powder (WS2 PWD), (b) Exfoliated WS2 by ball milling and sonication at 25 °C, (c) WS2 exfoliated and post-annealed at 180 °C. All the components and their relative atomic percentages are labelled in the figure.
Figure 6
Figure 6
Raman spectra of WS2 bulk powder, WS2 as-exfoliated and WS2 flakes post-annealed at 180 °C.
Figure 7
Figure 7
SEM image of sensor obtained by drop casting exfoliated WS2 and annealing at 180 °C on Si3N4 substrate provided with Pt finger-type electrodes (30 microns apart).
Figure 8
Figure 8
Electrical responses of the exfoliated WS2 post-annealed at 180 °C, at 150 °C operating temperature in dry air. (a) Comparison of the normalized dynamic response to NO2 (100 ppb–5 ppm) and H2 (1–250 ppm), (b) NO2 cross-sensitivity to H2: first panel, the response to 120 ppm H2 in dry air, second panel, response to 120 ppm H2 with 600 ppb NO2, third panel, response to 120 ppm H2 (as to first panel) for comparison, (c) Reproducibility and baseline recovery by exposing the film to both pulse and cumulative H2 concentrations in the range 40–100 ppm. H2 concentrations are highlighted in the figure by grey shadowed rectangular plots.
Figure 9
Figure 9
WS2 exfoliated and post-annealed at 180 °C. (a) Long-term stability properties of the electrical resistances of the baseline (lower curve) and 800 ppb NO2 over a period of 12 months (equivalent to approximately 5 months of continuous operation at 150 °C operating temperature). Average resistance values with associated standard deviations are calculated over a set of 5 consecutive measurements. (b) Comparison of the XPS signals of the as-exfoliated WS2 annealed at 180 °C (lower curve) and the same sample after one-year conditioning to various gases and 150 °C operating temperature.
Figure 10
Figure 10
Electrical responses of the exfoliated WS2 post-annealed at 180 °C (150 °C operating temperature) to different Relative Humidity (RH) conditions. (a) Normalized dynamic response to humidity (10–80% RH). The inset depicts the corresponding sensitivity plot. (b) Dynamic response to increasing NO2 concentrations in air with 40% RH, (c) Dynamic response to increasing H2 concentrations in in air with 40% RH, (d) Comparison of the sensitivity plots to NO2 and H2 in dry air and 40% RH, respectively.
Figure 11
Figure 11
HRTEM images of the WS2 film pre-annealed at 180 °C. (b) Magnification of the yellow area of Figure 11 (a) displaying the presence of ordered structures (i.e., inside the red square) referred to crystalline WS2 and the presence of disordered ones (i.e., inside the green square) attributed to amorphous WO3. Related Selected Area Electron Diffraction (SAED) patterns are shown in (c) and (d), highlighting the occurrence of sharper reflections (d) associated to crystalline WS2.
Figure 12
Figure 12
Chemical composition, crystalline structure and microstructural features of a fully oxidized WO3 thin film. (a) W 4f core level XPS spectra, (b) XRD grazing incidence spectra. Top right inset shows the close up of the 2θ region characteristic of crystalline WO3 (corresponding peaks of crystalline WO3, according to ICDS 98-001-7003, are highlighted by dashed green lines), (c) electrical response of the fully oxidized WO3 amorphous film to NO2 and different OTs.

References

    1. Yang W., Gan L., Li H., Zhai T. Two-dimensional layered nanomaterials for gas-sensing applications. Inorg. Chem. Front. 2016;3:433–451. doi: 10.1039/C5QI00251F. - DOI
    1. Late D.J., Huang Y.K., Liu B., Acharya J., Shirodkar S.N., Luo J., Yan A., Charles D., Waghmare U.V., Dravid V.P., et al. Sensing behavior of atomically thin-layered MoS2 transistors. ACS Nano. 2013;7:4879–4891. doi: 10.1021/nn400026u. - DOI - PubMed
    1. Voiry D., Yamaguchi H., Li J., Silva R., Alves D.C.B., Fujita T., Chen M., Asefa T., Shenoy V.B., Eda G., et al. Enhanced catalytic activity in strained chemically exfoliated WS2 nanosheets for hydrogen evolution. Nat. Mater. 2013;12:850–855. doi: 10.1038/nmat3700. - DOI - PubMed
    1. Voiry D., Yang J., Chhowalla M. Recent Strategies for Improving the Catalytic Activity of 2D TMD Nanosheets Toward the Hydrogen Evolution Reaction. Adv. Mater. 2016;28:6197–6206. doi: 10.1002/adma.201505597. - DOI - PubMed
    1. Mak K.F., Shan J. Photonics and optoelectronics of 2D semiconductor transition metal dichalcogenides. Nat. Photonics. 2016;10:216–226. doi: 10.1038/nphoton.2015.282. - DOI

LinkOut - more resources