. 2019 Sep 24;8(10):1133.
doi: 10.3390/cells8101133.

Leptin Promotes Expression of EMT-Related Transcription Factors and Invasion in a Src and FAK-Dependent Pathway in MCF10A Mammary Epithelial Cells

Affiliations

Leptin Promotes Expression of EMT-Related Transcription Factors and Invasion in a Src and FAK-Dependent Pathway in MCF10A Mammary Epithelial Cells

Monserrat Olea-Flores et al. Cells. .

Abstract

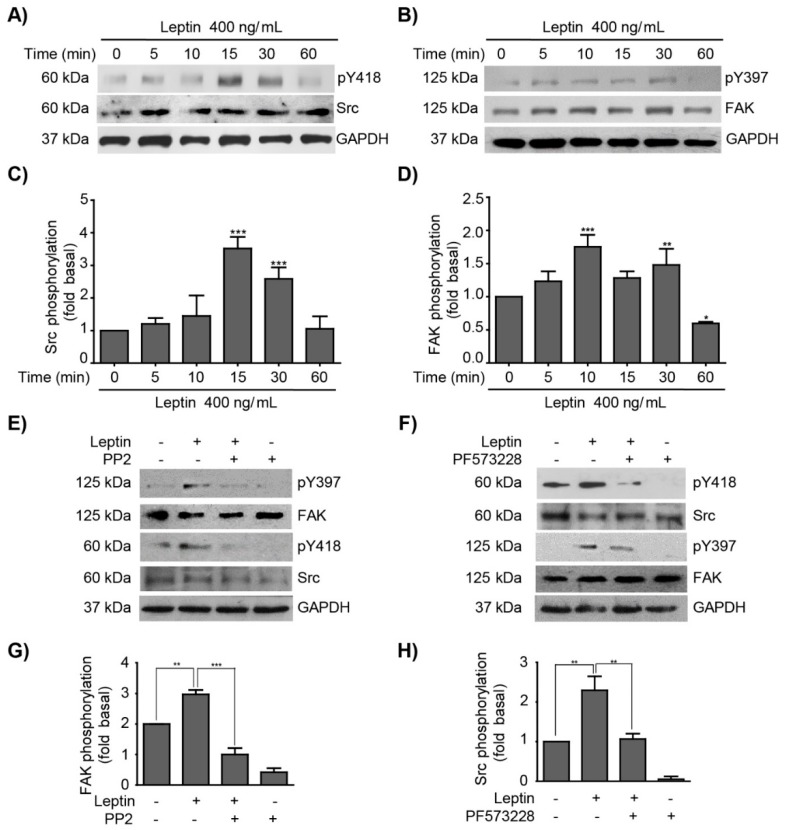
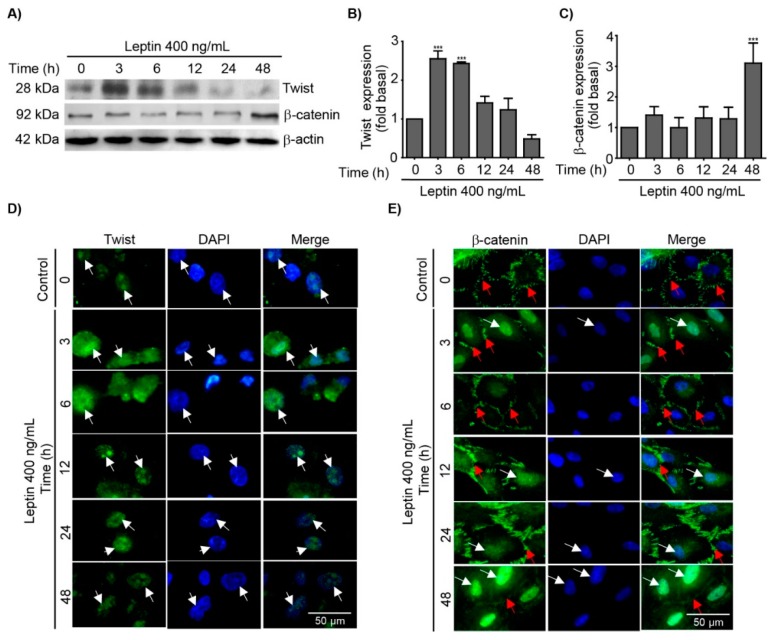
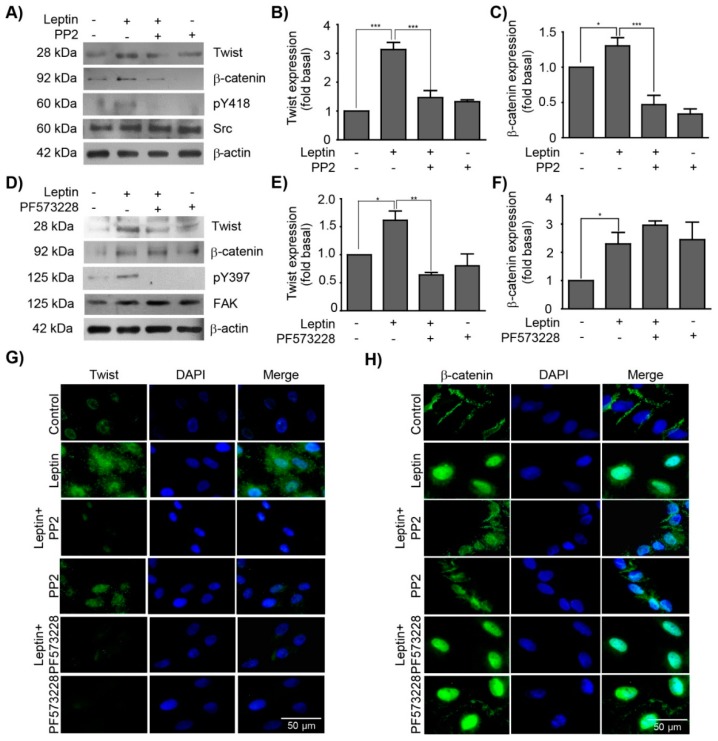
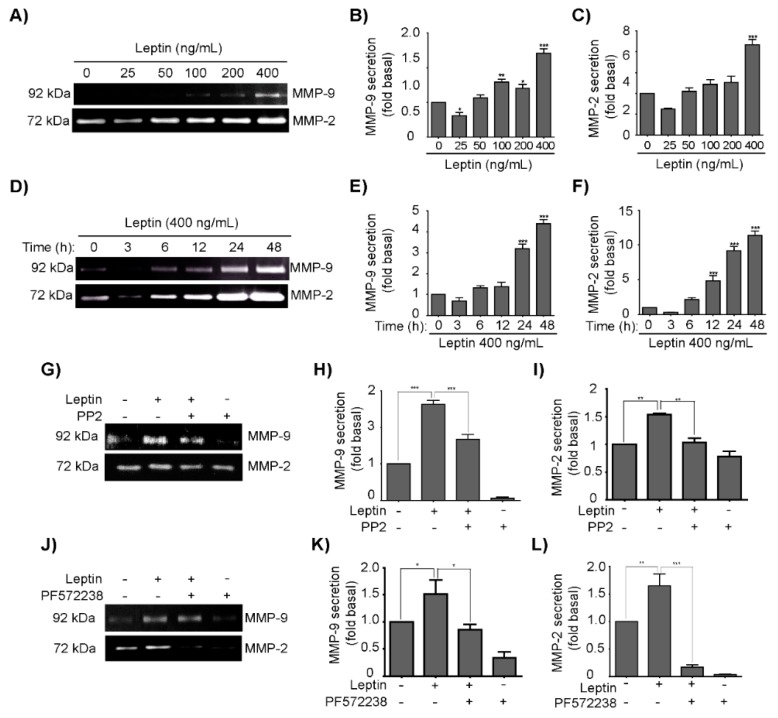
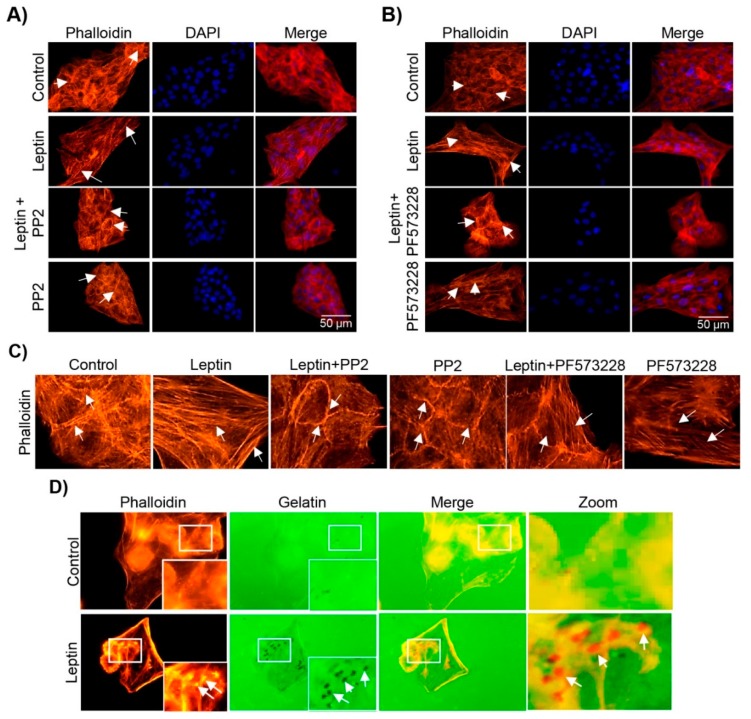
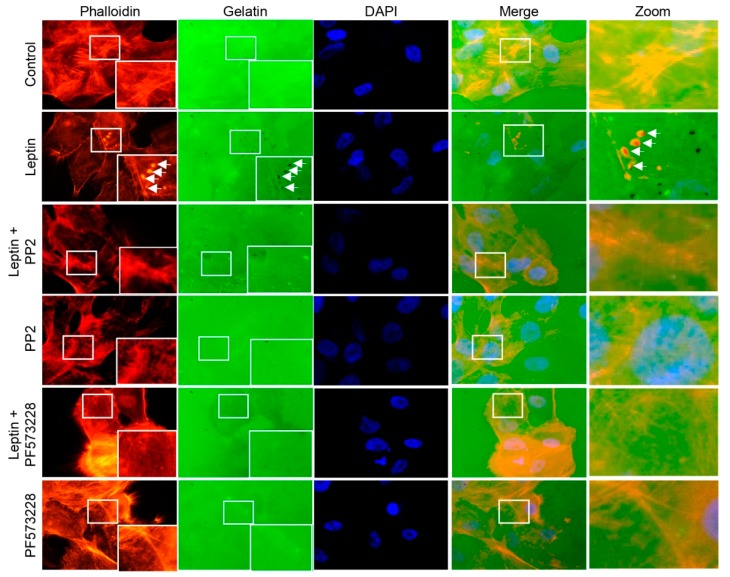
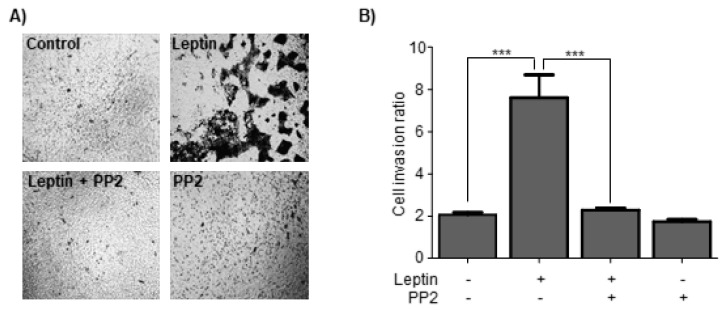
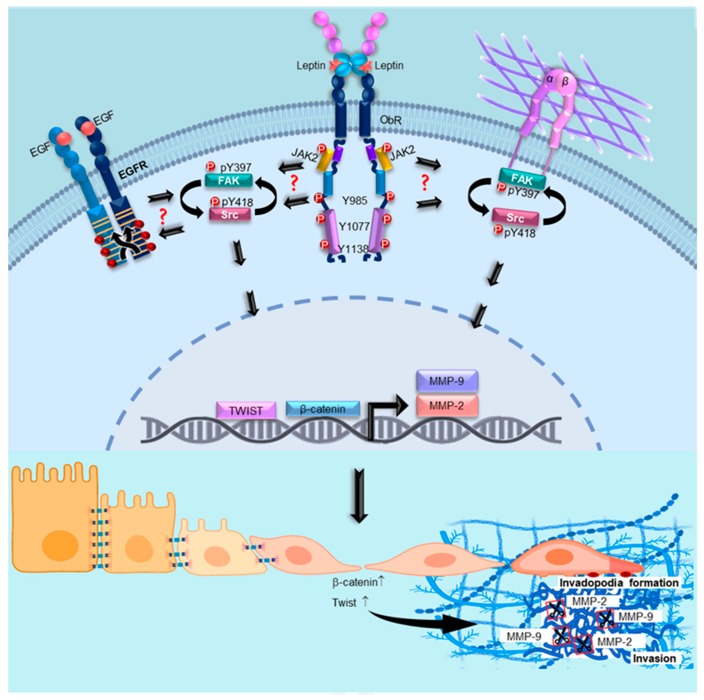
Leptin is one of the main adipokines secreted in breast tissue. Leptin promotes epithelial-mesenchymal transition (EMT), cell migration and invasion in epithelial breast cells, leading to tumor progression. Although, the molecular mechanisms that underlie these events are not fully understood, the activation of different signaling pathways appears to be essential. In this sense, the effects of leptin on the activation of kinases like Src and FAK, which regulate signaling pathways that activate the EMT program, are not completely described. Therefore, we investigated the involvement of these kinases using an in vitro model for leptin-induced EMT process in the non-tumorigenic MCF10A cell line. To this end, MCF10A cells were stimulated with leptin, and Src and FAK activation was assessed. Specific events occurring during EMT were also evaluated in the presence or absence of the kinases' chemical inhibitors PP2 and PF-573228. For instance, we tested the expression and subcellular localization of the EMT-related transcription factors Twist and β-catenin, by western blot and immunofluorescence. We also evaluated the secretion and activation of matrix metalloproteases (MMP-2 and MMP-9) by gelatin zymography. Invasiveness properties of leptin-stimulated cells were determined by invadopodia formation assays, and by the Transwell chamber method. Our results showed that leptin promotes EMT through Src and FAK activation, which leads to the secretion and activation of MMP-2 and MMP-9, invadopodia formation and cell invasion in MCF10A cells. In conclusion, our data suggest that leptin promotes an increase in the expression levels of Twist and β-catenin, the secretion of MMP-2, MMP-9, the invadopodia formation and invasion in MCF10A cells in a Src and FAK-dependent manner.

Keywords: EMT; FAK; Src; invasion; leptin; transcription factors.


Conflict of interest statement

The authors declare no conflict of interest.

Figures

Figure 1
Figure 1
Leptin activates Src and FAK in the non-tumorigenic breast epithelial cell line MCF10A. Representative Western blots of whole cell extracts obtained at different time points from MCF10A cells stimulated with 400 ng/mL of leptin. (A) Effect of leptin in Src activation was detected with an anti-p-Y418 antibody and was compared to total Src. (B) Effect of leptin in FAK activation was detected with an anti-p-Y397 antibody and was compared to total FAK. GAPDH was used as loading control. Densitometric analyses of (C) Src, and (D) FAK phosphorylation dependent on leptin. MCF10A cells were pre-treated with Src (PP2) or FAK (PF-573228) inhibitors, and subsequently with leptin 400 ng/mL. Representative western blots of Src phosphorylated in Y418 (E), and FAK phosphorylated in Y397 (F). Control blots showing loss of pY418-Src and pY397-FAK in the presence of inhibitors, PP2 and PF573228 are shown. GAPDH was used as a loading control. Densitometric analyses of leptin-dependent (G) FAK, and (H) Src phosphorylation in the presence of the inhibitors. The values are shown in means ± SD of three independent experiments and are expressed as changes with respect to the control (unstimulated cells). The asterisks indicate the comparison made with respect to the control. * p < 0.05, ** p < 0.01 and *** p < 0.001 by one-way ANOVA (Dunnett’s and Newman-Keuls’s test).
Figure 2
Figure 2
Leptin induces the expression of the epithelial–mesenchymal transition (EMT)-related transcription factors, Twist and β-catenin in MCF10A cells. MCF10A cells were treated with leptin 400 ng/mL for different times and the expression and localization of Twist and β-catenin was analyzed. (A) Representative western blot of Twist and β-catenin. β-actin was used as a loading control. Densitometric and statistical analysis of the bands obtained by western blot for Twist (B) and β-catenin (C); the values are shown in means ± SD of three independent experiments, and are expressed as changes in respect to the control (unstimulated cells). The asterisks indicate the comparison made with respect to the control. *** p < 0.001 by one-way ANOVA (Dunnett´s test). Representative immunofluorescence microscopy images showing in green, the expression of Twist (D) and β-catenin (E), the nucleus was counterstained with DAPI. White arrows indicate the nucleus; red arrows indicate cell membranes. Images were acquired using the 100× magnification.
Figure 3
Figure 3
Src and FAK regulate the expression and subcellular localization of Twist and β-catenin. MCF10A cells were pre-treated with Src (PP2) or FAK (PF-573228) inhibitors, and subsequently with 400 ng/mL of leptin. (A) Representative western blots of Twist and β-catenin expression upon Src inhibition. Densitometric analyses of (B) Twist and (C) β-catenin expression upon Src inhibition. (D) Representative western blots of Twist and β-catenin expression upon FAK inhibition. Densitometric analyses of (E) Twist and (F) β-catenin expression upon FAK inhibition. β-actin was used as a loading control. The values represent the mean ± SD of three independent experiments and are expressed as changes with respect to the control (unstimulated cells). The asterisks indicate the comparison made with respect to the control. * p < 0.05 and *** p < 0.001 by one-way ANOVA (Newman–Keuls’s test). Representative images of epifluorescence microscopy using a 40× magnification. MCF10A cells were pre-treated with PP2 and PF-573228 and subsequently stimulated with leptin (400 ng/mL). The subcellular localization of (G) Twist and (H) β-catenin is shown in green, and in blue the DNA was counterstained with DAPI.
Figure 4
Figure 4
Leptin promotes invasion-related processes by activating MMPs in a Src- and FAK-dependent manner in MCF10A cells. MCF10A cells were treated with leptin 400 ng/mL for different times and MMP activity by degradation of bovine gelatin was evaluated. (A) Representative zymogram gels from culture supernatants of MCF10A cells treated with increasing concentrations of leptin corresponding to the degradation bands of MMP-9 (92 kDa) and MMP-2 (72 kDa). The plots represent the densitometric and statistical analyses of the bands obtained by gelatin zymography shown for (B) MMP-9, and (C) MMP-2. (D) Representative zymogram gels from culture supernatants of MCF10A cells treated with 400 ng/mL of leptin for different times corresponding to the degradation bands of MMP-9 and MMP-2. The plots represent the densitometric and statistical analysis of the bands obtained by gelatin zymography shown for (E) MMP-9, and (F) MMP-2. (G) Effect of Src inhibition on MMP-9 and MMP-2 activation. MCF10A cells were treated or not with 400 ng/mL of leptin and 10 µM PP2. The plots represent the densitometric and statistical analysis of the bands obtained by gelatin zymography shown for (H) MMP-9, and (I) MMP-2 upon inhibition of Src. (J) Effect of FAK inhibition on MMP-9 and MMP-2 activation. MCF10A cells were treated or not with 400 ng/mL of leptin and 10 µM PF573228. The plots represent the densitometric and statistical analysis of the bands obtained by gelatin zymography shown for (K) MMP-9, and (L) MMP-2 upon inhibition of FAK. The values are shown in means ± SD of three independent experiments and are expressed as changes with respect to the control (unstimulated cells). The asterisks indicate the comparison made with respect to the control. * p < 0.05, ** p < 0.01 and *** p < 0.001 by a one-way ANOVA (Dunnett´s and Newman–Keuls’s test).
Figure 5
Figure 5
Leptin stimulation leads to the re-arrangement of the actin cytoskeleton and formation of invadopodia. Representative images of MCF10A cells pre-treated or not with PP2 (A) or PF-573228 (B) for 30 min and subsequently with leptin (400 ng/mL) for 24 h. Actin filaments were detected with Phalloidin-TRITC (red) and DNA was counterstained with DAPI. Images were acquired using the 40× magnification. (C) Enlarged images of actin cytoskeleton of MCF10A cells grown in the presence or absence of leptin, and the Src and FAK inhibitors. White arrows indicate structures of actin. (D) Representative images of invadopodia formation assays. Actin puncta was detected with phalloidin (red) and Alexa 488-labeled gelatin (green) was used as a specific substrate for the membrane-bound MMP-14 located at the edge of invadopodia. Arrows indicate areas of gelatin degradation. Images were acquired using a 100× magnification.
Figure 6
Figure 6
Src and FAK regulate the invasion capacity of MCF10A cells stimulated with leptin. Representative images of MCF10A cells pre-treated or not with PP2 or PF-573228 (10 µM) for 30 min and subsequently incubated in the presence or absence of leptin (400 ng/mL) for 24 h. Actin puncta was detected with phalloidin (red) and Alexa 488-labeled gelatin (green) was used as a specific substrate for the membrane-bound MMP-14 located at the edge of invadopodia. Arrows indicate areas of gelatin degradation. Images were acquired using a 100× magnification.
Figure 7
Figure 7
Leptin induce invasion in MCF10A cells in a Src-dependent manner. (A) Representative light microscopy images of invasion assays of MCF10A cells pre-treated with AraC and grown in the presence or absence of leptin, and the Src inhibitor PP2. (B) Quantitative analyses of the invasion assays presented in (A); the values represent the mean ± SD of three independent experiments, and are expressed as a cell invasion ratio (between invading and non-invading cells). The asterisks indicate the comparison made with respect to the control. *** p < 0.001 by a one-way ANOVA (Newman-Keuls’s test).
Figure 8
Figure 8
Model for leptin-induced EMT via Src and FAK signaling pathways. Leptin activates FAK and Src in a positive feedback pathway, which in turn regulate the expression and subcellular localization of β-catenin and Twist, promoting the expression of MMP-2 and MMP-9 as well as EMT-related events such as invadopodia formation and cell invasion. ? indicates an unknown mechanism.

Similar articles

Cited by

References

    1. Cirillo D., Rachiglio A.M., La Montagna R., Giordano A., Normanno N. Leptin signaling in breast cancer: An overview. J. Cell. Biochem. 2008;105:956–964. doi: 10.1002/jcb.21911. - DOI - PubMed
    1. Ando S., Barone I., Giordano C., Bonofiglio D., Catalano S. The Multifaceted Mechanism of Leptin Signaling within Tumor Microenvironment in Driving Breast Cancer Growth and Progression. Front. Oncol. 2014;4:1–6. doi: 10.3389/fonc.2014.00340. - DOI - PMC - PubMed
    1. Olea-Flores M., Juárez-Cruz J.C., Mendoza-Catalán M.A., Padilla-Benavides T., Navarro-Tito N. Signaling Pathways Induced by Leptin during Epithelial-Mesenchymal Transition in Breast Cancer. Int. J. Mol. Sci. 2018;19 doi: 10.3390/ijms19113493. - DOI - PMC - PubMed
    1. Gu L., Wang C.-D., Cao C., Cai L.-R., Li D.-H., Zheng Y.-Z. Association of serum leptin with breast cancer. Medicine. 2019;98:e14094. doi: 10.1097/MD.0000000000014094. - DOI - PMC - PubMed
    1. Saxena N.K., Sharma D. Multifaceted Leptin network: The molecular connection between obesity and breast cancer. J. Mammary Gland Biol. Neoplasia. 2016;25:289–313. doi: 10.1007/s10911-013-9308-2. - DOI - PMC - PubMed

Publication types

MeSH terms

LinkOut - more resources