. 2019 Sep 24;20(19):4742.
doi: 10.3390/ijms20194742.

Causes and Consequences of A Glutamine Induced Normoxic HIF1 Activity for the Tumor Metabolism

Affiliations

Causes and Consequences of A Glutamine Induced Normoxic HIF1 Activity for the Tumor Metabolism

Matthias Kappler et al. Int J Mol Sci. .

Abstract

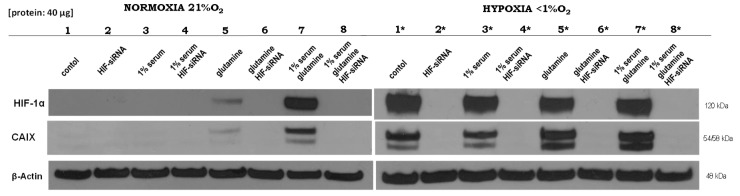
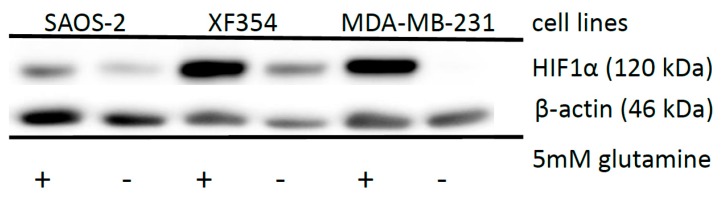
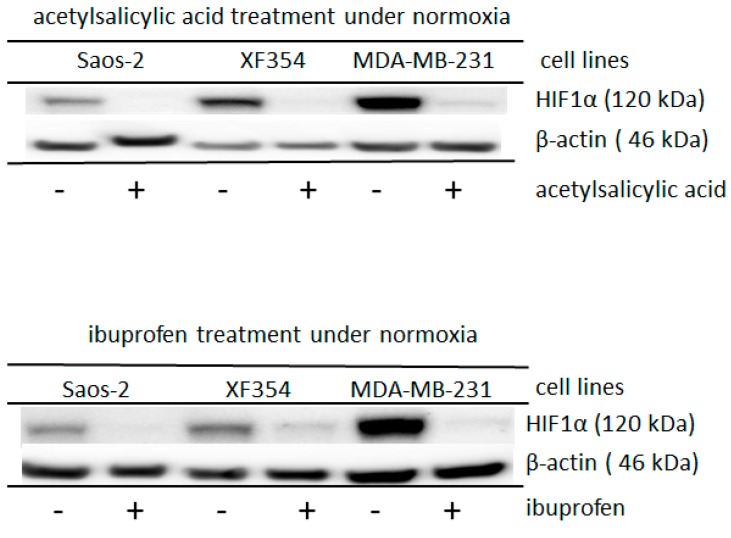
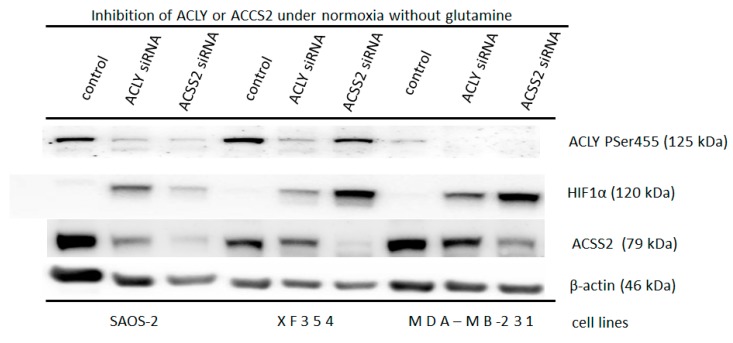
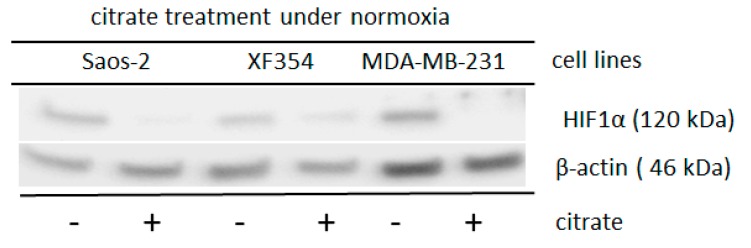
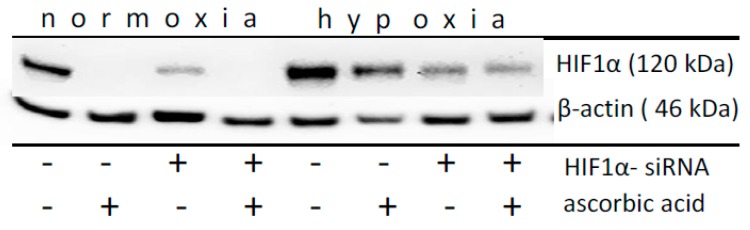
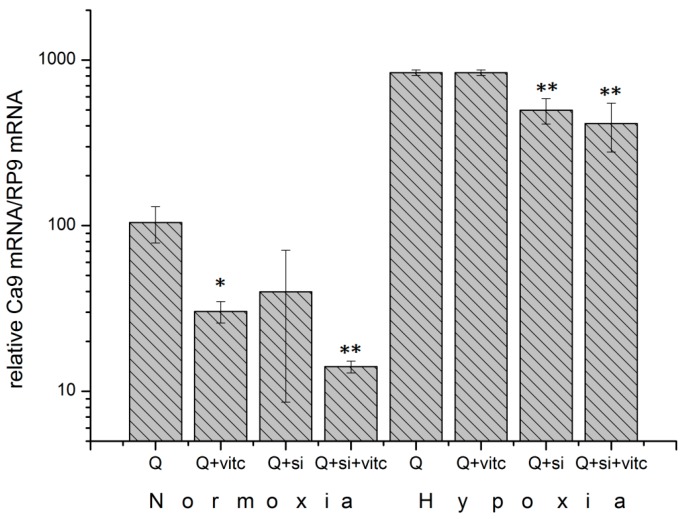
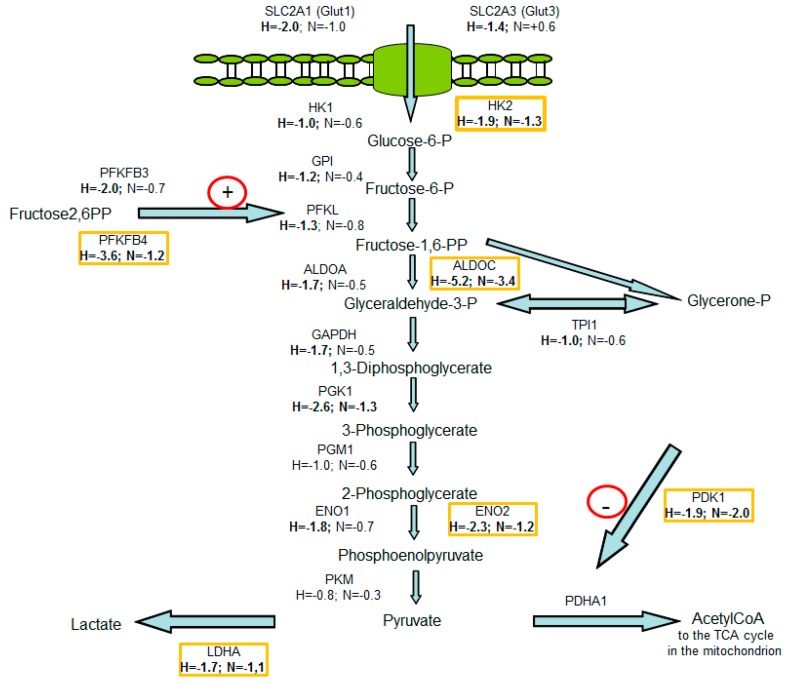
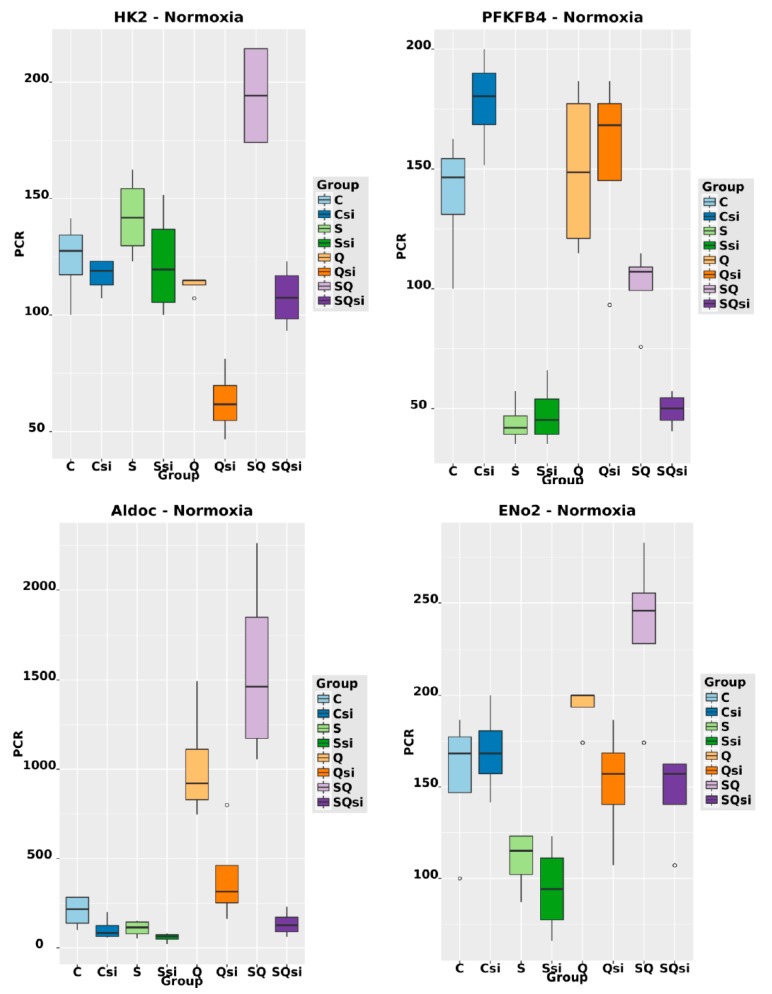
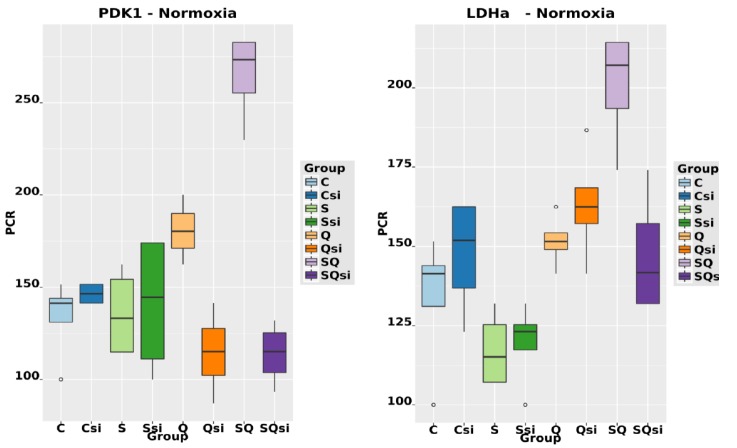
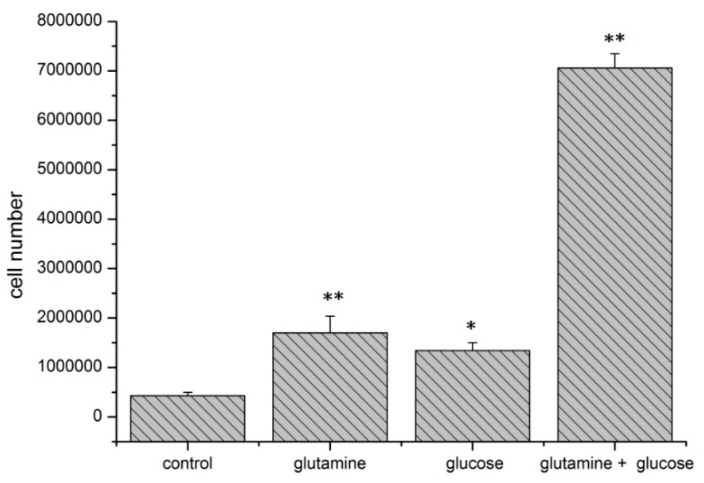
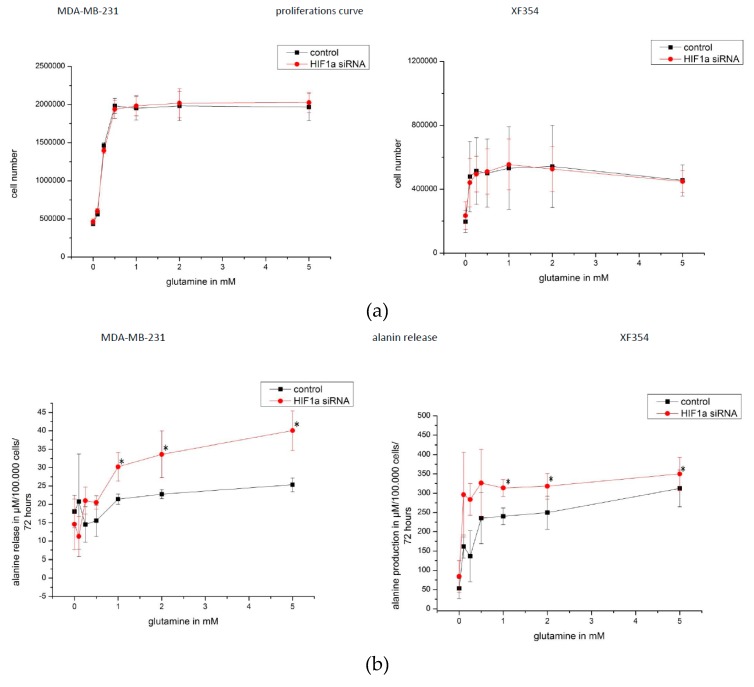
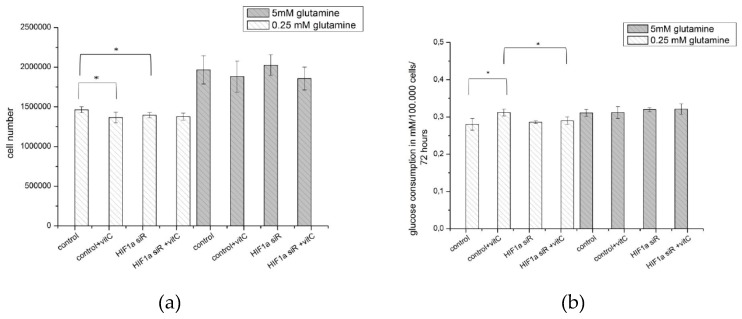
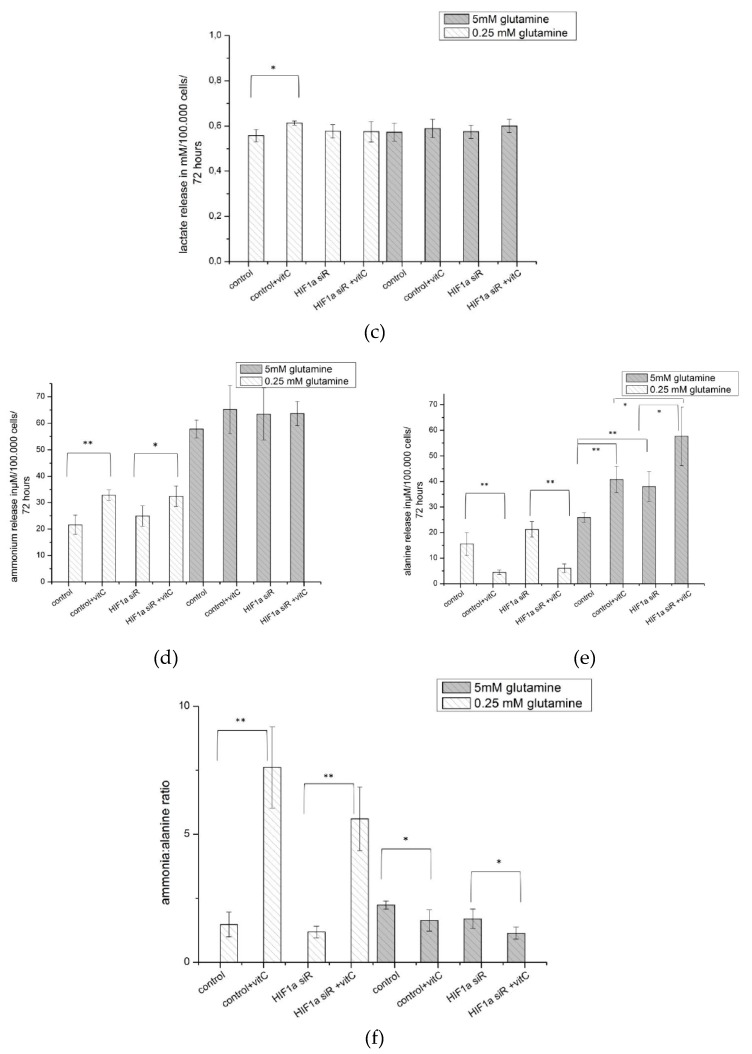
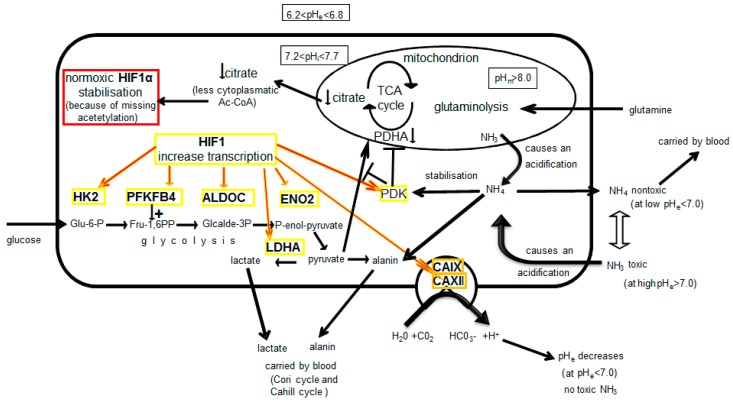
The transcription factor hypoxia-inducible factor 1 (HIF1) is the crucial regulator of genes that are involved in metabolism under hypoxic conditions, but information regarding the transcriptional activity of HIF1 in normoxic metabolism is limited. Different tumor cells were treated under normoxic and hypoxic conditions with various drugs that affect cellular metabolism. HIF1α was silenced by siRNA in normoxic/hypoxic tumor cells, before RNA sequencing and bioinformatics analyses were performed while using the breast cancer cell line MDA-MB-231 as a model. Differentially expressed genes were further analyzed and validated by qPCR, while the activity of the metabolites was determined by enzyme assays. Under normoxic conditions, HIF1 activity was significantly increased by (i) glutamine metabolism, which was associated with the release of ammonium, and it was decreased by (ii) acetylation via acetyl CoA synthetase (ACSS2) or ATP citrate lyase (ACLY), respectively, and (iii) the presence of L-ascorbic acid, citrate, or acetyl-CoA. Interestingly, acetylsalicylic acid, ibuprofen, L-ascorbic acid, and citrate each significantly destabilized HIF1α only under normoxia. The results from the deep sequence analyses indicated that, in HIF1-siRNA silenced MDA-MB-231 cells, 231 genes under normoxia and 1384 genes under hypoxia were transcriptionally significant deregulated in a HIF1-dependent manner. Focusing on glycolysis genes, it was confirmed that HIF1 significantly regulated six normoxic and 16 hypoxic glycolysis-associated gene transcripts. However, the results from the targeted metabolome analyses revealed that HIF1 activity affected neither the consumption of glucose nor the release of ammonium or lactate; however, it significantly inhibited the release of the amino acid alanine. This study comprehensively investigated, for the first time, how normoxic HIF1 is stabilized, and it analyzed the possible function of normoxic HIF1 in the transcriptome and metabolic processes of tumor cells in a breast cancer cell model. Furthermore, these data imply that HIF1 compensates for the metabolic outcomes of glutaminolysis and, subsequently, the Warburg effect might be a direct consequence of the altered amino acid metabolism in tumor cells.

Keywords: HIF1α; L-ascorbic acid; Warburg effect; acetylsalicylic acid; glutamine; glutaminolysis; glycolysis; hypoxia; metabolism; normoxia; tumor.


Conflict of interest statement

The authors declare that they have no conflict of interest.

Figures

Figure 1
Figure 1
Altered HIF1α-dependent effects of normoxia and hypoxia under different culture conditions. Western blot analysis was performed 24 h after the application of different treatments for HIF1α and carbonic anhydrase (CAIX), while β-actin served as a control. (Lane 1) Medium control; (lane 2) siRNA against HIF1α; (lane 3) 1% fetal bovine serum; (lane 4) 1% fetal bovine serum and siRNA against HIF1α; (lane 5) 5 mM glutamine; (lane 6) 5 mM glutamine and siRNA against HIF1α; (lane 7) 1% fetal bovine serum and 5 mM glutamine; and, (lane 8) 1% fetal bovine serum, 5 mM glutamine and siRNA against HIF1α under normoxic or hypoxic (*) conditions in MDA-MB-231 cells. The experiments were performed in RPMI 1640 in the presence of 11.1 mM glucose, but without glutamine. Deep sequencing analysis was performed for each of the corresponding RNA samples (lanes 7, 8, 7*, and 8*) from four independent experiments (Please see Supplemental Figure S3 and the results from the densitometric evaluation of the Western blots of four independent experiments).
Figure 2
Figure 2
Effects of glutamine application on HIF1α expression in different tumor cell lines. Saos-2, XF354 and MDA-MB-231 cells were left untreated or treated with 5 mM glutamine in RPMI 1640 medium without glutamine under normoxic conditions for 24 h followed by Western blot analysis of HIF1α and β-actin as a loading control. Data from three independent experiments (Please see Supplemental Figure S4 and the results from the densitometric evaluation of the Western blots).
Figure 3
Figure 3
Altered HIF1α expression after the application of acetylsalicylic acid or ibuprofen in different cell lines under normoxia. Saos-2, XF354 and MDA-MB-231 cells were treated with 10 mM acetylsalicylic acid or 3 mM ibuprofen in RPMI 1640 medium with 5 mM glutamine under normoxic conditions for 24 h. Western blot analysis was performed with anti-HIF1α monoclonal antibody and anti-β-actin monoclonal antibody as a control. Acetylsalicylic acid or ibuprofen significantly reduced the glutamine-induced expression level of the normoxic HIF1α. Data from three independent experiments (Please see Supplemental Figure S5 and for the densitometric evaluation of the Western blots). For the results of experiments under hypoxic conditions, please see Supplemental Figure S6.
Figure 4
Figure 4
Glutamine independent induction of normoxic HIF1α via down regulation of ACLY or ACSS2. Application of 20 nM siRNA against ATP citrate lyase (ACLY) or the cytosolic form of the acetyl-CoA synthetase (ACSS2) in Saos-2, XF354 and MDA-MB-231 cells in RPMI 1640 medium without glutamine under normoxic conditions for 48 h. This was followed by Western blot analysis of HIF1α, ACLY (Ser 455), and ACSS2 and β-actin as a loading control. Data from three independent experiments (Please see Supplemental Figure S9a–c and the results from the densitometric evaluation of the Western blots).
Figure 5
Figure 5
Altered HIF1α expression after the application of sodium citrate in cells of different lineages under normoxia after simultaneously treatment with glutamine. Saos-2, XF354 and MDA-MB-231 cells were treated with 8 mM (the XF354 cells were treated with only 4 mM sodium citrate) in RPMI 1640 medium with 5 mM glutamine under normoxic conditions for 24 h. Western blot analysis was performed with anti-HIF1α monoclonal antibody and anti-β-actin monoclonal antibody as a control. Sodium citrate significantly reduces the glutamine-induced normoxic HIF1 α-level. Data are from three independent experiments (Please see Supplemental Figure S10 and the results from the densitometric evaluation of the Western blots).
Figure 6
Figure 6
Impact of ascorbic acid on the normoxic and hypoxic HIF1α level in MDA-MB-231 cell. After the of application of HIF1α-siRNA and/or the simultaneously application of 5 mM glutamine and/or 100 µM ascorbic acid for 24 h under normoxic or hypoxic conditions, western blot analysis of HIF1α and β-actin as a loading control was performed. Ascorbic acid significantly reduces the glutamine-induced normoxic HIF1 α-level. Data from three independent experiments. (Please see Supplemental Figure S12 and the results from the densitometric evaluation of the Western blots).
Figure 7
Figure 7
Reduction of relative CA9 mRNA expression under normoxia and hypoxia (<0.1% oxygen) 24 h after the application of 5 mM glutamine (Q) and 100 µM ascorbic acid (vitc) or HIF1α siRNA (si) in MDA-MB-231 cell. Data correspond to the protein data presented in Figure 6 and demonstrate the transcriptional activity of HIF1 under the influence of ascorbic acid (vitc). Ascorbic acid significantly reduces the CA9 mRNA expression under normoxia. (* −p-value < 0.05; ** −p-value < 0.01, Student t-test as compared to control (Q)).
Figure 8
Figure 8
Gene mRNA levels using deep sequencing data of genes involved in glycolysis after HIF1α was knocked down in the MDA-MB-231 cells. RNA was harvested 24 h after the start of the experiments. The experiments were performed in RPMI 1640 medium without glutamine but with 11.1 mM glucose. In this scheme, the mRNA levels are depicted as a ratio of untreated cells to HIF-siRNA transfected cells either under normoxic (N) or under hypoxic (H) conditions. Deep sequencing analysis was performed while using the hypoxic samples after the application of 5 mM L-glutamine and 1% fetal bovine serum (corresponding to lane 7* in Figure 1) and hypoxic samples that were additionally treated with HIF1α-specific siRNA (corresponding to lane 8* in Figure 1) in four independent experiments. H (hypoxia)-describes the quotients of the transcript level of genes from the hypoxic HIF1-positive samples (corresponding to lane 7* in Figure 1) divided by the transcript level from the hypoxic HIF1-negative samples (corresponding to lane 8* in Figure 1). N (normoxia) describes quotients of the transcript level of the normoxic HIF1-positive samples (corresponding to lane 7 in Figure 1) divided by the transcript level of the normoxic HIF1-negative samples (corresponding to lane 8 in Figure 1). Genes marked yellow were significantly upregulated by HIF1 under normoxic conditions, as was validated using qPCR (Supplemental Figure S16, Supplemental Tables S1 and S2). Figure was adapted from [34].
Figure 9
Figure 9
Relative mRNA levels of HK2, PFKFB4, ALDOC, ENO2, PDK1, and LDHA normalized each to the RPL9 mRNA level, after the application of 5 mM L-glutamine (Q) corresponding to Figure 1 (lanes 5–8), 1% fetal bovine serum (S) (lanes 3, 4, 7, and 8) and/or 5 nM HIF1α-specific siRNA (si) (lanes 2, 4, 6, and 8) or medium without glutamine, serum and siRNA (c -control) lane 1 under normoxic conditions in the MDA-MB-231 cells 24 h after the start of the treatment. The transcription of these genes was significantly regulated by HIF1 under normoxic conditions due to the stabilization of HIF1α via glutamine and fetal bovine serum. (For p-values, please refer to Supplemental Tables S1 and S2; see also Supplemental Figure S16).
Figure 9
Figure 9
Relative mRNA levels of HK2, PFKFB4, ALDOC, ENO2, PDK1, and LDHA normalized each to the RPL9 mRNA level, after the application of 5 mM L-glutamine (Q) corresponding to Figure 1 (lanes 5–8), 1% fetal bovine serum (S) (lanes 3, 4, 7, and 8) and/or 5 nM HIF1α-specific siRNA (si) (lanes 2, 4, 6, and 8) or medium without glutamine, serum and siRNA (c -control) lane 1 under normoxic conditions in the MDA-MB-231 cells 24 h after the start of the treatment. The transcription of these genes was significantly regulated by HIF1 under normoxic conditions due to the stabilization of HIF1α via glutamine and fetal bovine serum. (For p-values, please refer to Supplemental Tables S1 and S2; see also Supplemental Figure S16).
Figure 10
Figure 10
Effect of glutamine and glucose on the cell proliferation of MDA-MB-231 cells. One million cells were cultured in DMEM (with or without glucose and/or glutamine) containing 10% fetal bovine serum (1) without glucose or glutamine, (2) with 5 mM glutamine, (3) with 11.1 mM glucose, and (4) with 5 mM glutamine and 11.1 mM glucose for 72 h. Then, the cells were counted. Compared to the single application of either substance, the use of both glutamine and glucose resulted in rapid cell proliferation. (* -p-value < 0.05; ** -p-value < 0.01, Student t-test as compared to control.
Figure 11
Figure 11
(a) Glutamine-mediated effects on proliferation and alanine release in HIF1α-silenced tumor cells. Cell proliferation assay for MDA-MB-231 and XF354 cells were performed with a total of 200,000 cells, which were cultivated for 72 h with different levels of glutamine 0-5 mM in 4 mL medium (RPMI or DMEM each with glucose). The number of cells were counted. MDA-MB-231 cells reached a maximum number at approximately 2,000,000 cells (cultivated in RPMI), and XF354 (cultivated in DMEM) reached a maximum number at approximately 550,000 cells within 72 h of proliferation, respectively. The application of glutamine increased the proliferation of both cells, whereas the treatment with HIF1α-specific siRNA did not. (b) The release of alanine, a second waste product of glutamine catabolism, was determined for the MDA-MB-231 and XF 354 cells, which were cultivated for 72 h with different levels of glutamine (0–5 mM in 4 mL of medium). In the MDA-MB-231 treated with lower concentrations of glutamine cells (≤0.5 mM glutamine), the relative alanine level was approximately 20 µM/100,000 cells as compared to the cells that were cultivated with higher levels of glutamine (>1 mM), for which the alanine level was greater. In the presence of 1–5 mM glutamine, a significant increase in the alanine level released by the cells was found for HIF1α-silenced cells compared to the amount of released alanine from the control cells. After glutamine (>0.1 mM) was added to the XF354 cells, the release of alanine was increased such that it was in the range from 100 µM to 300 µM/100,000 cells within 72 h, while the addition of 1–5 mM glutamine led to a significant increase in the alanine level released from cells that were treated with HIF1α-specific siRNA compared to amount of alanine released from the control cells. After 72 h of cultivation in a medium without alanine, the MDA-MB-231 released the maximum alanine concentration at approximately 930 µM, and for XF354 cells, a maximum of 2000 µM alanine was released after 72 h of cultivation. The application of HIF1α-specific siRNA had a significant effect on the amount of alanine released at glutamine levels >1 mM.
Figure 12
Figure 12
Effect of HIF1α silencing and/or ascorbic acid on the proliferation and metabolic substances under normoxia (a,b) The results from the analysis of the therapeutic effect of ascorbic acid (vitc) in MDA-MB-231 cells cultivated for 72 h under normoxic conditions with 0.25 mM or 5 mM glutamine and with or without HIF1α-specific siRNA. This experiment was initiated with 200,000 cells. After 72 h of proliferation, the cell number was higher with 5 mM glutamine treatment then it was with 0.25 mM glutamine treatment (see also Figure 11a). At low glutamine levels, the application of ascorbic acid or siRNA against HIF1α resulted in a very limited reduction of the cell number. At a higher level of glutamine application (5 mM), such an effect could not be found. The uptake of glucose from the medium was approximately 0.3 mM glucose /100,000 cells and marginally lower compared to the uptake after ascorbic acid treatment. (c) Results from the analysis of the release of lactate from the MDA-MB-231 cells into the medium. The lactate level/100,000 cells within 72 h was marginally increased by the application of ascorbic acid but only at low levels of glutamine. (d,e) The release of ammonium from the MDA-MB-231 cells into the medium was analyzed. A significant increase in the release of ammonium due to the influence of ascorbic acid, but not HIF1 siRNA, was found at low levels of glutamine (0.25 mM). At high levels of glutamine (5 mM), neither HIF1α-specific siRNA nor ascorbic acid had any effect. The release of alanine was also analyzed for the MDA-MB-231 cells. At lower levels of glutamine (0.25 mM), ascorbic acid significantly reduced the concentration of alanine released, independent of HIF1α silencing, while at higher concentrations of glutamine (5 mM), ascorbic acid induced the opposite effect, with an increased release of alanine into the medium surrounding the cultivated cells. This effect was HIF1α-dependent, which enhanced the concentration of alanine released into the medium. (f) Results from the analysis of the ratio of released ammonium to alanine; this ratio was strongly dependent on the presence of ascorbic acid. At low glutamine levels, the application of ascorbic acid caused a HIF1α-independent increase in the ratio, which suggested the release of higher levels of ammonium, but lower levels of alanine. At a higher concentration of glutamine (5 mM), this correlation seems to be inverse of the situation at lower glutamine levels. (* −p-value < 0.05; ** −p-value < 0.01, Student t-test as compared to control.
Figure 12
Figure 12
Effect of HIF1α silencing and/or ascorbic acid on the proliferation and metabolic substances under normoxia (a,b) The results from the analysis of the therapeutic effect of ascorbic acid (vitc) in MDA-MB-231 cells cultivated for 72 h under normoxic conditions with 0.25 mM or 5 mM glutamine and with or without HIF1α-specific siRNA. This experiment was initiated with 200,000 cells. After 72 h of proliferation, the cell number was higher with 5 mM glutamine treatment then it was with 0.25 mM glutamine treatment (see also Figure 11a). At low glutamine levels, the application of ascorbic acid or siRNA against HIF1α resulted in a very limited reduction of the cell number. At a higher level of glutamine application (5 mM), such an effect could not be found. The uptake of glucose from the medium was approximately 0.3 mM glucose /100,000 cells and marginally lower compared to the uptake after ascorbic acid treatment. (c) Results from the analysis of the release of lactate from the MDA-MB-231 cells into the medium. The lactate level/100,000 cells within 72 h was marginally increased by the application of ascorbic acid but only at low levels of glutamine. (d,e) The release of ammonium from the MDA-MB-231 cells into the medium was analyzed. A significant increase in the release of ammonium due to the influence of ascorbic acid, but not HIF1 siRNA, was found at low levels of glutamine (0.25 mM). At high levels of glutamine (5 mM), neither HIF1α-specific siRNA nor ascorbic acid had any effect. The release of alanine was also analyzed for the MDA-MB-231 cells. At lower levels of glutamine (0.25 mM), ascorbic acid significantly reduced the concentration of alanine released, independent of HIF1α silencing, while at higher concentrations of glutamine (5 mM), ascorbic acid induced the opposite effect, with an increased release of alanine into the medium surrounding the cultivated cells. This effect was HIF1α-dependent, which enhanced the concentration of alanine released into the medium. (f) Results from the analysis of the ratio of released ammonium to alanine; this ratio was strongly dependent on the presence of ascorbic acid. At low glutamine levels, the application of ascorbic acid caused a HIF1α-independent increase in the ratio, which suggested the release of higher levels of ammonium, but lower levels of alanine. At a higher concentration of glutamine (5 mM), this correlation seems to be inverse of the situation at lower glutamine levels. (* −p-value < 0.05; ** −p-value < 0.01, Student t-test as compared to control.
Figure 13
Figure 13
A model for the role of normoxic HIF1 in the regulation of glycolysis and glutaminolysis. The uptake of the amino acid glutamine and the subsequent deamination called glutaminolysis occurs at high rates in tumor cells [13]. The process of glutaminolysis is completed inside the mitochondria, and the mitochondrial pH value (pHm) is higher than the pH value in the cytosol. This model demonstrates that the consumption of amino acids such as glutamine reaches a critical point for the pH value-dependent release of ammonia. As the catabolism of glutamine usually occurs in the mitochondrial matrix, the basic intra-mitochondrial pH value leads to the increased concentration of toxic ammonia. Gaseous ammonia, but not ammonium, can diffuse across all membranes, even the impermeable membrane of a mitochondrion, but it will be protonated to ammonium in the intramembranous space, which is populated by protons. The equilibrium between ammonia and ammonium is ph value dependent. The ammonia gas is generated only at a pH value >7.0. Diffuse ammonia from the mitochondria decreases the cytoplasmic pH value. Extracellularly excreted ammonium is able to reenter the cell again as gaseous ammonia when the extracellular pH value is higher than 7.0, which also leads to decreased pHi. Ammonia/ammonium is able to activate pyruvate dehydrogenase kinase (PDK) [56,57]. PDK is able to inhibit pyruvate dehydrogenase (PDHA), which is essential for the function of the tricarboxylic acid (TCA) cycle [57]. Such an ammonia-triggered mechanism shut down the TCA cycle, which leads to a reduced level of mitochondrial citrate. Citrate is necessary for the generation of cytoplasmic acetyl-CoA (Ac-CoA), which is required for the modification of proteins through acetylation. The subunit HIF1α is not only modified by hydroxylation but also by acetylation. Low levels of cytoplasmic Ac-CoA inhibit the acetylation of normoxic HIF1α, which results in the stabilization of HIF1α [33]. The accumulation of HIF1α enables the transcriptional activity of HIF1 (composed of two subunits, α and β). This result could explain the observed increase in the mRNA levels of HIF1 target genes (HK2, PFKFB4, ALDOC, ENO2, LDHA, PDK1, CAIX, and CAXII). Thus, it seems that normoxic HIF1 has several mechanisms by which it compensate for the negative effects of the generation of ammonia/ammonium, including (i) stabilizing the energy balance by increasing the rate of glycolysis through the transcriptional activation of glycolysis-associated genes, when ammonia/ammonium is suppressing the activity of the TCA cycle. (ii) Additionally, it stabilizes the intracellular pH value by reducing the extracellular pH value via HIF1-activated CAIX and CAXII, which makes it impossible for ammonia to reenter the cell (at pHe < 7.0). Moreover, the excretion of ammonium requires energy, and the reentry of ammonia into the cell requires additional energy for excretion of ammonium. (iii) Furthermore, the enhancement of glycolysis increases the level of pyruvate, which is able to bind ammonium and form alanine, which can be further regenerated, in a manner that is similar to lactate in the Cori cycle. Indeed, 50% of the surplus nitrogen is secreted as alanine (50% as ammonium) out of cells [8]. In addition, lactate can induce glutamine uptake and metabolism [58] and, then, whole cycle as described. Altogether, the toxic nature of ammonia requires a transcriptional reaction of the genome, which is, in our interpretation, the activation of the transcription factor HIF1. Therefore, normoxic HIF1 functions as a pH sensor, rather than an oxygen/hypoxia sensor, and it is involved in glycolysis and glutaminolysis to maintain the energy and metabolic balance of the cell. (Figure adapted from [13] Figure 5).

References

    1. Lu J., Tan M., Cai Q. The Warburg effect in tumor progression: Mitochondrial oxidative metabolism as an anti-metastasis mechanism. Cancer Lett. 2015;356:156–164. doi: 10.1016/j.canlet.2014.04.001. - DOI - PMC - PubMed
    1. Warburg O. On respiratory impairment in cancer cells. Science. 1956;124:269–270. - PubMed
    1. Koppenol W.H., Bounds P.L., Dang C.V. Otto Warburg’s contributions to current concepts of cancer metabolism. Nat. Rev. Cancer. 2011;11:325–337. doi: 10.1038/nrc3038. - DOI - PubMed
    1. Vander Heiden M.G., Cantley L.C., Thompson C.B. Understanding the Warburg effect: The metabolic requirements of cell proliferation. Science. 2009;324:1029–1033. doi: 10.1126/science.1160809. - DOI - PMC - PubMed
    1. DeBerardinis R.J., Lum J.J., Hatzivassiliou G., Thompson C.B. The biology of cancer: Metabolic reprogramming fuels cell growth and proliferation. Cell Metab. 2008;7:11–20. doi: 10.1016/j.cmet.2007.10.002. - DOI - PubMed

MeSH terms

LinkOut - more resources