. 2019 Sep 26;20(1):196.
doi: 10.1186/s13059-019-1805-1.

Divergent neuronal DNA methylation patterns across human cortical development reveal critical periods and a unique role of CpH methylation

Affiliations

Divergent neuronal DNA methylation patterns across human cortical development reveal critical periods and a unique role of CpH methylation

Amanda J Price et al. Genome Biol. .

Abstract

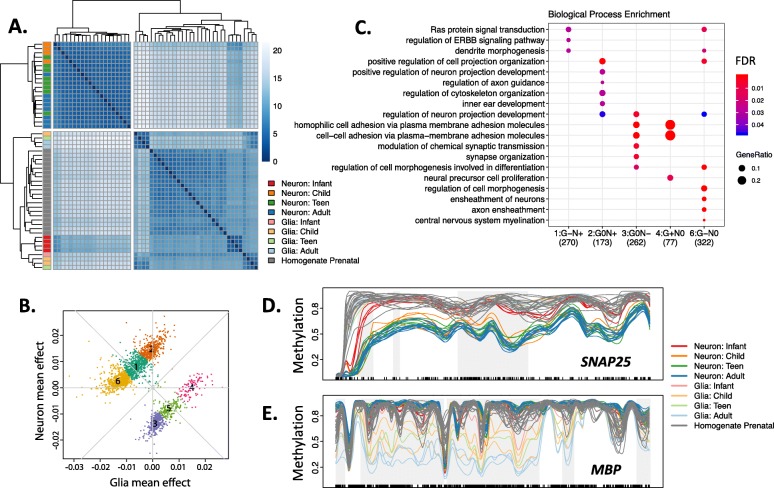
Background: DNA methylation (DNAm) is a critical regulator of both development and cellular identity and shows unique patterns in neurons. To better characterize maturational changes in DNAm patterns in these cells, we profile the DNAm landscape at single-base resolution across the first two decades of human neocortical development in NeuN+ neurons using whole-genome bisulfite sequencing and compare them to non-neurons (primarily glia) and prenatal homogenate cortex.

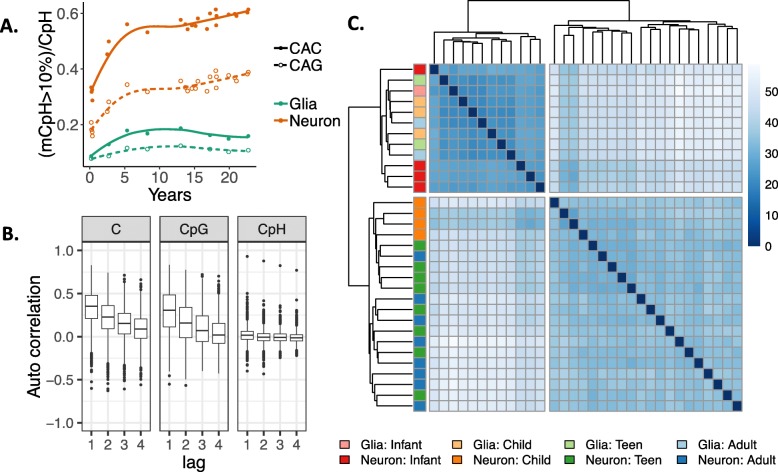
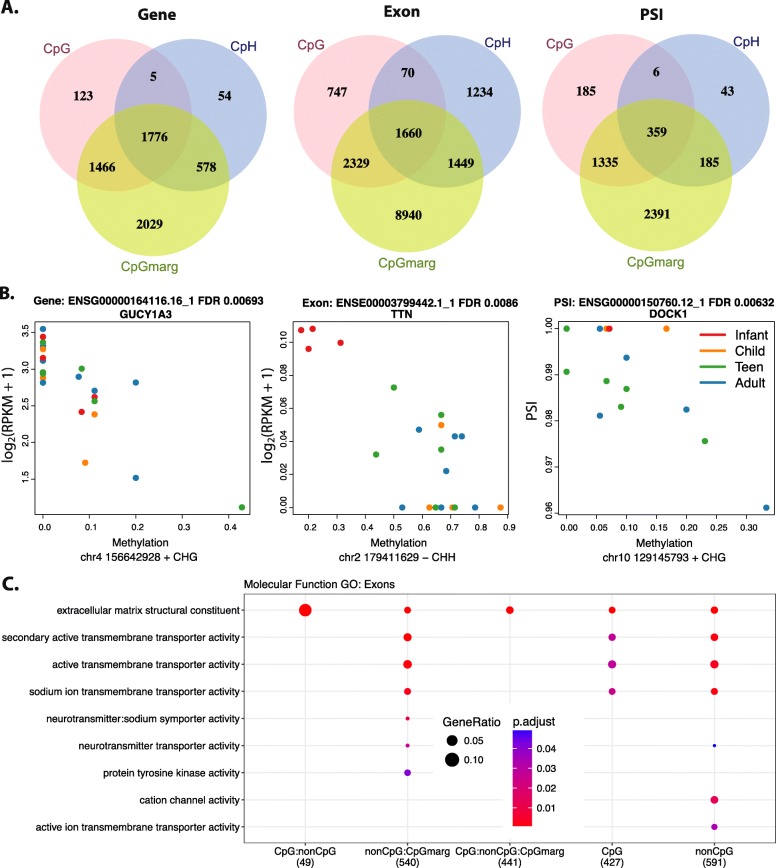
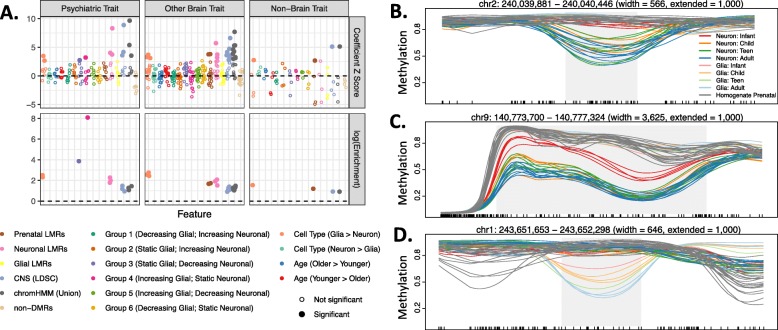
Results: We show that DNAm changes more dramatically during the first 5 years of postnatal life than during the entire remaining period. We further refine global patterns of increasingly divergent neuronal CpG and CpH methylation (mCpG and mCpH) into six developmental trajectories and find that in contrast to genome-wide patterns, neighboring mCpG and mCpH levels within these regions are highly correlated. We integrate paired RNA-seq data and identify putative regulation of hundreds of transcripts and their splicing events exclusively by mCpH levels, independently from mCpG levels, across this period. We finally explore the relationship between DNAm patterns and development of brain-related phenotypes and find enriched heritability for many phenotypes within identified DNAm features.

Conclusions: By profiling DNAm changes in NeuN-sorted neurons over the span of human cortical development, we identify novel, dynamic regions of DNAm that would be masked in homogenate DNAm data; expand on the relationship between CpG methylation, CpH methylation, and gene expression; and find enrichment particularly for neuropsychiatric diseases in genomic regions with cell type-specific, developmentally dynamic DNAm patterns.

Keywords: DNA methylation; Gene expression; Neurodevelopment; Non-CpG methylation.


Conflict of interest statement

The funders had no role in the study design, data collection and analysis, decision to publish, or preparation of the manuscript. The authors declare that they have no competing interests.

Figures

Fig. 1
Fig. 1
Regional cell type-specific developmental mCpG trajectories. a Euclidean distances between the samples within cdDMRs show that older neuronal samples cluster separately from infant neuronal samples, glia regardless of age, and bulk prenatal cortex. b Decomposing cdDMR patterns into six clusters using k-means based on glia and neuron mean mCpG changes per year of life. c The top five most enriched Gene Ontology terms for each of the six groups in b highlight diverse biological processes among the groups. No terms were enriched for group 5. d Example of group 3 cdDMR within SNAP25. e Example of group 6 cdDMR within MBP. Gray shading indicates the boundaries of the cdDMR, and black tick marks on the x-axis indicate the position of CpGs. Key: neuron (NeuN+), glia (NeuN−), infant (0–1 year), child (1–10 years), teen (11–17 years), and adult (18+ years)
Fig. 2
Fig. 2
CpH methylation patterns across brain development. a The proportion of CAC and CAG sites that are greater than 10% methylated in neurons and non-neurons (glia) across brain development. The y-axis reflects the number of > 10% methylated CAC or CAG sites divided by the number of CAH sites in that trinucleotide context. b Autocorrelation levels for different cytosine contexts in neurons. Autocorrelation levels were similar for mCpG and all cytosines, with uncorrelated levels in the CpH context. c Euclidean distances between samples based on mCpH within cdDMRs again cluster infant neurons (dark red) with glia of all ages (light colors) rather than with older neurons
Fig. 3
Fig. 3
Methylation associations with expression. a Venn diagrams of the methylation associations by unique feature for the gene, exon, and PSI. The sets are determined by if the association is FDR < 5% genome-wide for CpG and CpH or if it is a CpG marginally significant within ± 1-kb window of a CpH association. b Example associations between methylation and expression at the gene level colored by age: red, infant; orange, child; green, teen; blue, adult. GUCY1A3 contains one of the top CpH differentially expressed between neurons and glia. Expression of an exon of TTN, an autism-associated gene, is negatively associated with mCpH. DOCK1 PSI of an alternative end site is negatively associated with mCpH. c Enriched molecular function ontology terms for methylation-associated exons by the Venn diagram groups from a
Fig. 4
Fig. 4
DNAm patterns and brain trait heritability. a Results assessing enrichment for heritability of 30 phenotypes within 16 groups of DNAm features using stratified linkage disequilibrium score regression (LDSC). Each dot represents the results for a single phenotype: DNAm feature pair. The color indicates the DNAm feature, and the phenotypes are stratified by column into psychiatric phenotypes, other brain-related phenotypes (i.e., neurological or behavioral-cognitive), or non-brain-related traits. The upper row shows the coefficient z-score for each tested phenotype: DNAm pair, or the amount of additional heritability explained by the DNAm feature over 53 baseline features in the model. The lower row shows the enrichment score or the proportion of heritability attributed to the feature divided by the proportion of SNPs in the feature. For clarity, enrichment scores of only the significant feature-trait combination are depicted. Filled in circles indicate significantly enriched heritability for a phenotype in a feature (coefficient p value corrected using Holms method ≤ 0.05). b A cdDMR overlapping HDAC4, a gene associated with autism spectrum disorder (ASD), shows the group 3 pattern of decreasing neuronal and static glial DNAm. c A cdDMR overlapping CACNA1B, a gene associated with ASD, shows the group 5 pattern of decreasing neuronal and increasing glial DNAm. d A cdDMR overlapping AKT3, a gene associated with schizophrenia, shows the group 6 pattern of decreasing glial and static neuronal DNAm. Gray shading indicates the boundaries of the cdDMR, and black tick marks on the x-axis indicate the position of CpGs

References

    1. Lister R, Mukamel EA, Nery JR, Urich M, Puddifoot CA, Johnson ND, et al. Global epigenomic reconfiguration during mammalian brain development. Science. 2013;341:1237905. doi: 10.1126/science.1237905. - DOI - PMC - PubMed
    1. Jaffe AE, Gao Y, Deep-Soboslay A, Tao R, Hyde TM, Weinberger DR, et al. Mapping DNA methylation across development, genotype and schizophrenia in the human frontal cortex. Nat Neurosci. 2016;19:40–47. doi: 10.1038/nn.4181. - DOI - PMC - PubMed
    1. Jaffe AE, Irizarry RA. Accounting for cellular heterogeneity is critical in epigenome-wide association studies. Genome Biol. 2014;15:R31. doi: 10.1186/gb-2014-15-2-r31. - DOI - PMC - PubMed
    1. Schultz MD, He Y, Whitaker JW, Hariharan M, Mukamel EA, Leung D, et al. Human body epigenome maps reveal noncanonical DNA methylation variation. Nature. 2015;523:212–216. doi: 10.1038/nature14465. - DOI - PMC - PubMed
    1. Mo A, Mukamel EA, Davis FP, Luo C, Henry GL, Picard S, et al. Epigenomic signatures of neuronal diversity in the mammalian brain. Neuron. 2015;86:1369–1384. doi: 10.1016/j.neuron.2015.05.018. - DOI - PMC - PubMed

Publication types