. 2019 Dec;9(12):1708-1719.
doi: 10.1158/2159-8290.CD-19-0329. Epub 2019 Sep 25.

The Phenotypes of Proliferating Glioblastoma Cells Reside on a Single Axis of Variation

Affiliations

The Phenotypes of Proliferating Glioblastoma Cells Reside on a Single Axis of Variation

Lin Wang et al. Cancer Discov. 2019 Dec.

Abstract

Although tumor-propagating cells can be derived from glioblastomas (GBM) of the proneural and mesenchymal subtypes, a glioma stem-like cell (GSC) of the classic subtype has not been identified. It is unclear whether mesenchymal GSCs (mGSC) and/or proneural GSCs (pGSC) alone are sufficient to generate the heterogeneity observed in GBM. We performed single-cell/single-nucleus RNA sequencing of 28 gliomas, and single-cell ATAC sequencing for 8 cases. We found that GBM GSCs reside on a single axis of variation, ranging from proneural to mesenchymal. In silico lineage tracing using both transcriptomics and genetics supports mGSCs as the progenitors of pGSCs. Dual inhibition of pGSC-enriched and mGSC-enriched growth and survival pathways provides a more complete treatment than combinations targeting one GSC phenotype alone. This study sheds light on a long-standing debate regarding lineage relationships among GSCs and presents a paradigm by which personalized combination therapies can be derived from single-cell RNA signatures, to overcome intratumor heterogeneity. SIGNIFICANCE: Tumor-propagating cells can be derived from mesenchymal and proneural glioblastomas. However, a stem cell of the classic subtype has yet to be demonstrated. We show that classic-subtype gliomas are comprised of proneural and mesenchymal cells. This study sheds light on a long-standing debate regarding lineage relationships between glioma cell types.See related commentary by Fine, p. 1650.This article is highlighted in the In This Issue feature, p. 1631.


Conflict of interest statement

Disclosure of Potential Conflicts of Interest

S. Muller is a scientist at and has ownership interest (including patents) in Genentech. No potential conflicts of interest were disclosed by the other authors.

Figures
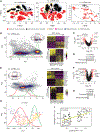
Figure 1.
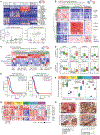
Figure 1.
Single-cell sequencing reveals a single axis of variation in proliferating GBM cells. A, Left, t-SNE plot of 8,992 10× scRNA-seq cells from 6 patients; center, t-SNE plot of 15,975 nuclei from 10 patients; right, t-SNE plot of 568 cells from 7 patients. Cells/nuclei are colored by the presence (red) or absence (black) of clonal CNVs. B, Top, PCA of neoplastic cells from 10× scRNA-seq of IDH-wild-type GBMs. Curves represent the density of a Gaussian mixture model fit to PC1 sample scores. Heat maps display the expression of top-loading PC1 genes across cells, sorted by PC1 sample score. C, Differentially expressed genes between PCA clusters (abs. log2 fold change > 1 and Padj < 0.001 in red). D, Fractions of cycling cells. ***, Fisher P < 0.001. E-G, PCA and analysis as in B-D for 10× snRNA-seq of IDH-wild-type GBMs. ***, Fisher P < 0.001. H, PCA of neoplastic cells from C1 scRNA-seq of IDH-wild-type GBMs. I, Correlations between the C1-scRNA-seq and 1×-scRNA-seq loadings. PCC, Pearson correlation coefficient.
Figure 2.
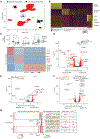
Figure 2.
mGSCs and pGSCs explain the genetic and phenotypic heterogeneity of GBM. A, Expression of mGSC and pGSC markers in single cells from nonmalignant human brain. B, Hierarchical clustering of Pearson correlations between mGSC, pGSC, and cell-cycle genes in IDH-wild-type (IDH-WT) GBM RNA-seq samples from TCGA (n = 144). Heat map (C) and box plots (D) of the relative contributions of predictor cell types to the overall variance explained by a linear model fit to each TCGA sample. E, Kaplan-Meier analysis comparing survival of IDH-wild-type GBMs from TCGA to average expression of the mGSC and pGSC gene signatures in patient-matched RNA sequencing. F and G, MGSC, pGSC, and cell-cycle signatures in Ivy GAP RNA-seq of GBM-anatomic structures. H, Percentages of CD44+ DLL3+ cells also positive for CA9/Ki-67. ***, Wilcoxon P < 0.001. DAB, 3,3ˊ-diaminobenzidine.
Figure 3.
Figure 3.
In silico genetic and transcriptomic lineage tracing supports a mGSC to pGSC hierarchy. A, Left, RNA velocities of cycling neoplastic 10× scRNA-seq IDH-wild-type GBM cells are projected onto a PCA axis. Center, velocyto-based lineage reconstruction identifies a stable mGSC root population and pGSC terminal population. Right, gene expression and velocity for mGSC and pGSC marker genes. B, The percent of expressed mitochondrial mutations found in a given cell, out of all mitochondrial mutations in a patient’s sample. C, Percent expressed mitochondrial mutations are compared between pGSCs and mGSCs. D, PCA analysis as in A, but for 10× snRNA-seq IDH-wild-type GBM data.
Figure 4.
Figure 4.
A, t-SNE plot of IDH-wild-type GBM scATAC-seq annotated by the presence of clonal mutations. B, Clustering of scATAC-seq gene-body activity scores of nonneoplastic cells. C, Clustering of scATAC-seq gene-body activity scores of neoplastic cells, with box plots of activity scores for Verhaak-subtype gene sets annotated above. *, Wilcoxon P < 0.05. D-F, Differential motif enrichment tests between neoplastic cell clusters. G, Neoplastic cluster-specific motifs and associated transcription factors. Int, intermediate; MES, mesenchymal; PN, proneural; TF, transcription factor.
Figure 5.
Figure 5.
A, A schematic overview of the drug screen. B, HSA synergy scores and dose responses for drug combinations screened in U87 cells in vitro.

Comment in

References

    1. Verhaak RG, Hoadley KA, Purdom E, Wang V, Qi Y, Wilkerson MD, et al. Integrated genomic analysis identifies clinically relevant subtypes of glioblastoma characterized by abnormalities in PDGFRA, IDH1, EGFR, and NF1. Cancer Cell 2010;17:98–110. - PMC - PubMed
    1. Patel AP, Tirosh I, Trombetta JJ, Shalek AK, Gillespie SM, Wakimoto H, et al. Single-cell RNA-seq highlights intratumoral heterogeneity in primary glioblastoma. Science 2014;344:1396–401. - PMC - PubMed
    1. Müller S, Liu SJ, Di Lullo E, Malatesta M, Pollen AA, Nowakowski TJ, et al. Single-cell sequencing maps gene expression to mutational phylogenies in PDGF and EGF driven gliomas. Mol Syst Biol 2016;12:889. - PMC - PubMed
    1. Jin X, Kim LJY, Wu Q, Wallace LC, Prager BC, Sanvoranart T, et al. Targeting glioma stem cells through combined BMI1 and EZH2 inhibition. Nat Med 2017;23:1352–61. - PMC - PubMed
    1. Diaz A, Liu SJ, Sandoval C, Pollen A, Nowakowski TJ, Lim DA, et al. SCell: integrated analysis of single-cell RNA-seq data. Bioinformatics 2016;32:2219–20. - PMC - PubMed