. 2019 Nov 4;151(11):1272-1286.
doi: 10.1085/jgp.201912424. Epub 2019 Sep 25.

Low temperature traps myosin motors of mammalian muscle in a refractory state that prevents activation

Affiliations

Low temperature traps myosin motors of mammalian muscle in a refractory state that prevents activation

Marco Caremani et al. J Gen Physiol. .

Abstract

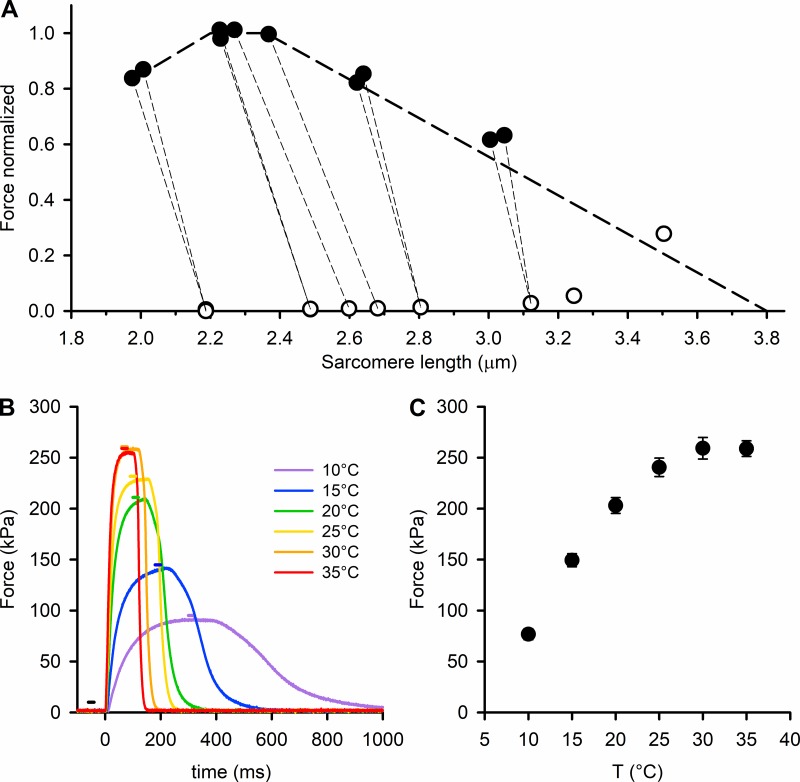
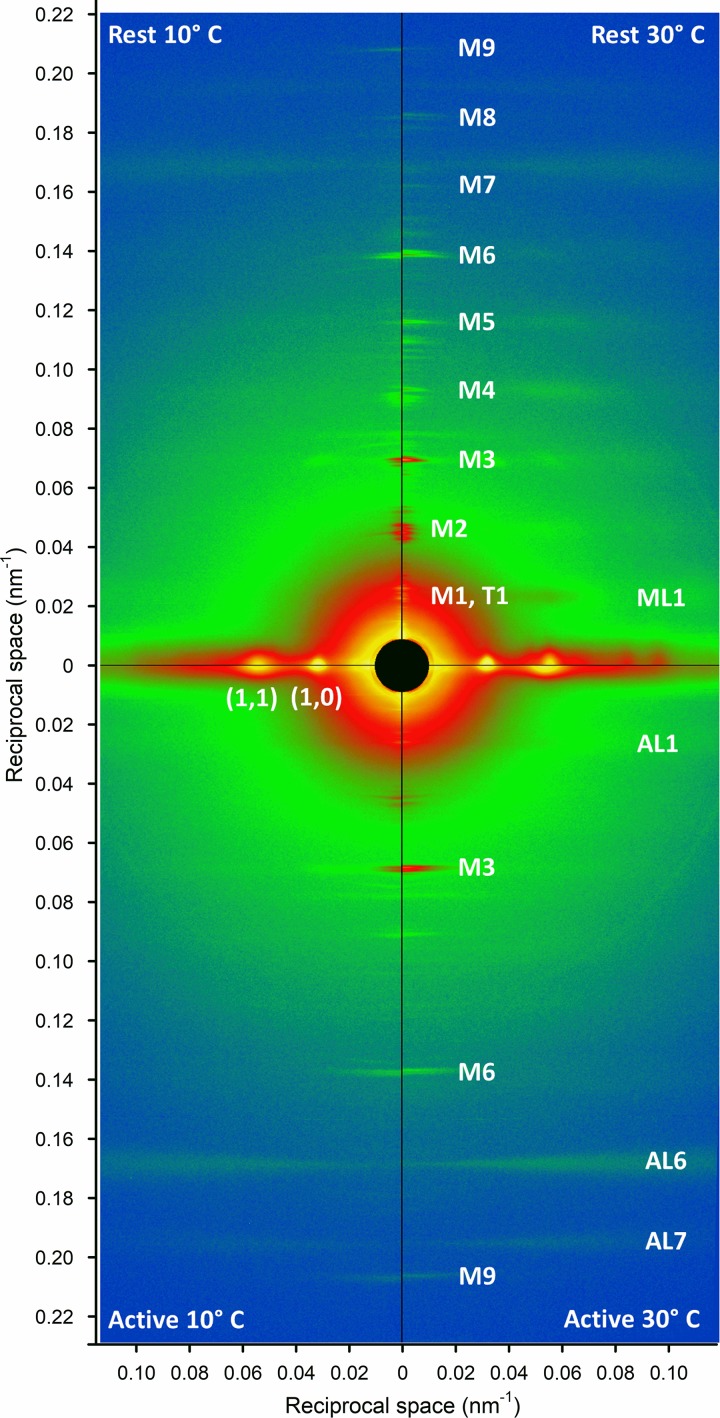
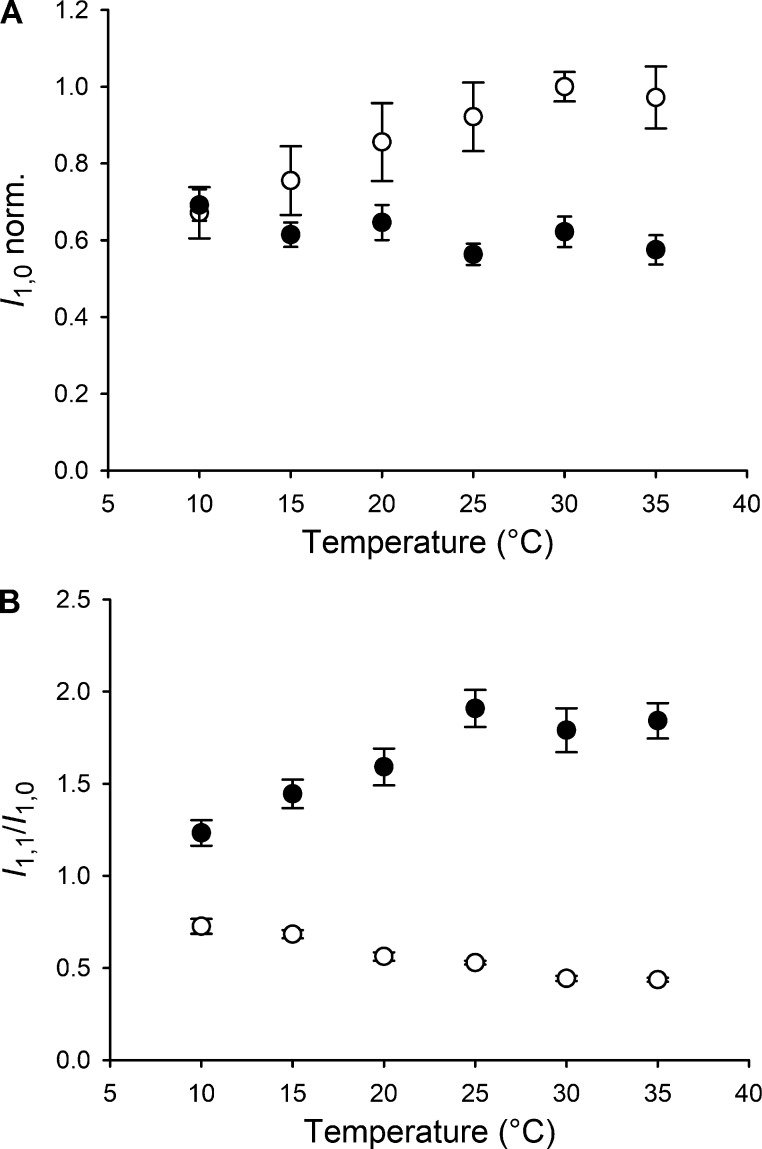
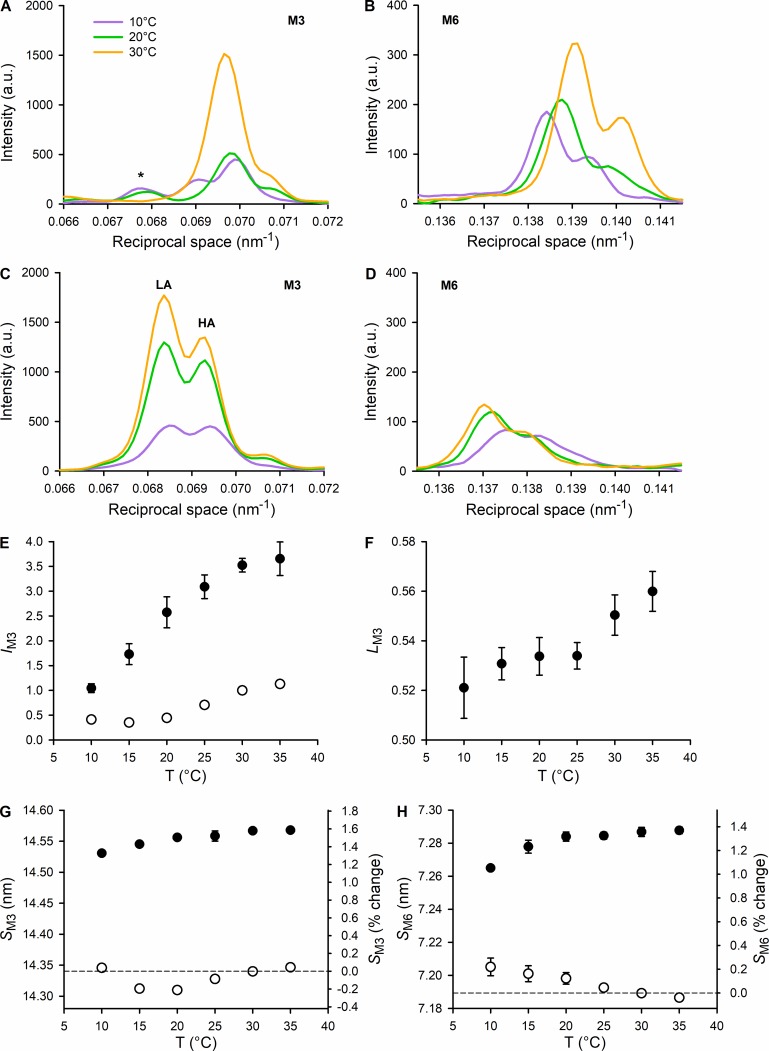
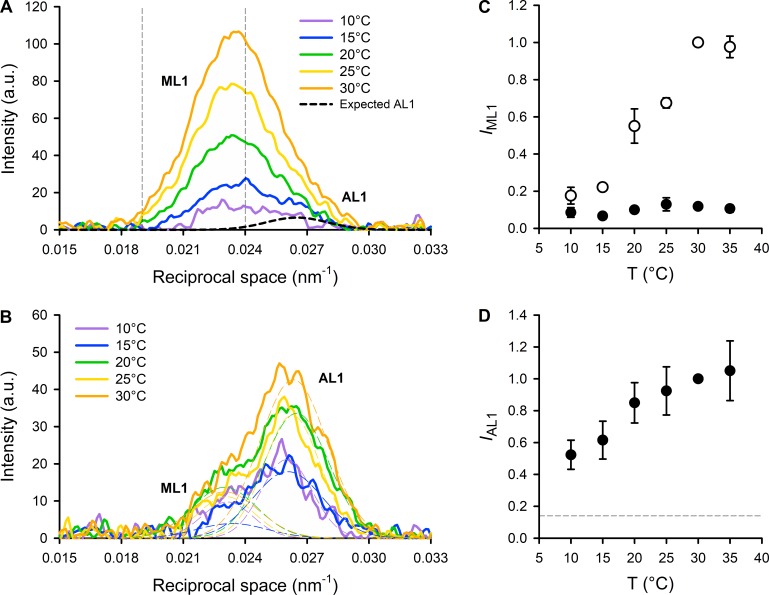
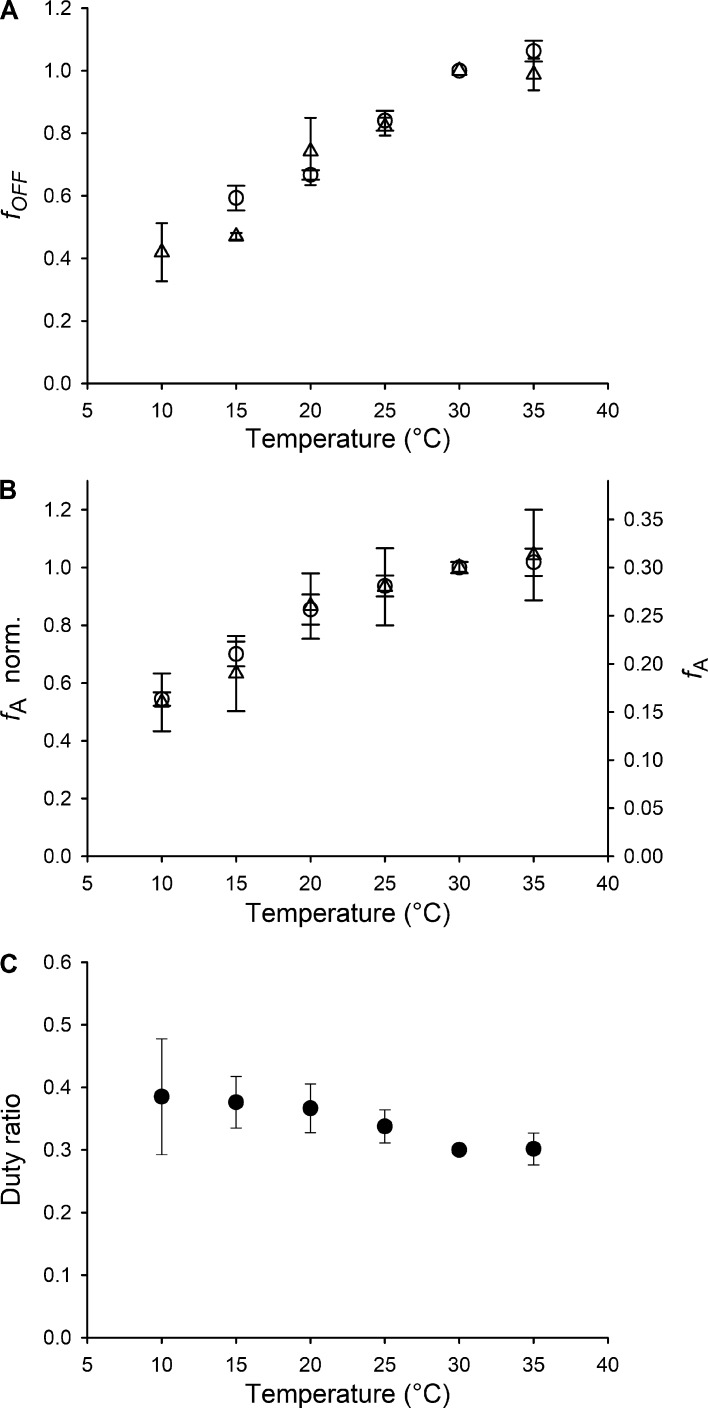
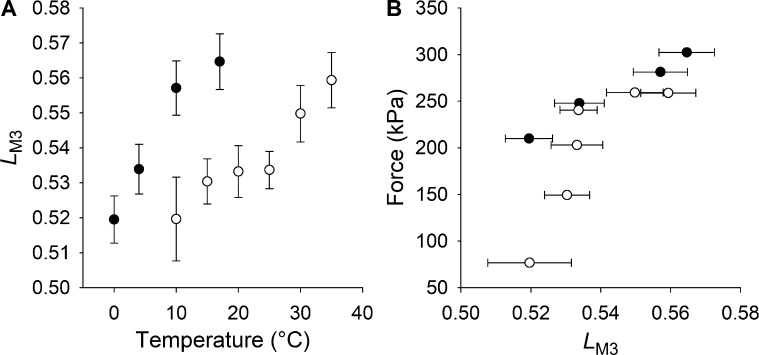
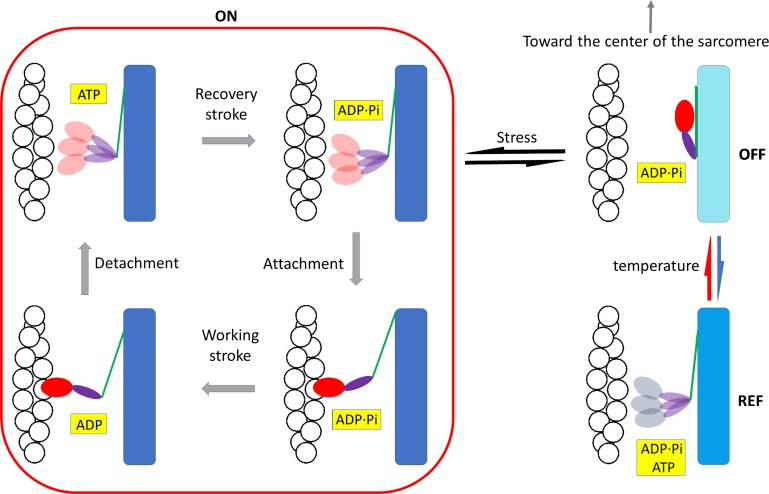
Myosin motors in the thick filament of resting striated (skeletal and cardiac) muscle are trapped in an OFF state, in which the motors are packed in helical tracks on the filament surface, inhibiting their interactions with actin and utilization of ATP. To investigate the structural changes induced in the thick filament of mammalian skeletal muscle by changes in temperature, we collected x-ray diffraction patterns from the fast skeletal muscle extensor digitorum longus of the mouse in the temperature range from near physiological (35°C) to 10°C, in which the maximal isometric force (T 0) shows a threefold decrease. In resting muscle, x-ray reflections signaling the OFF state of the thick filament indicate that cooling produces a progressive disruption of the OFF state with motors moving away from the ordered helical tracks on the surface of the thick filament. We find that the number of myosin motors in the OFF state at 10°C is half of that at 35°C. At T 0, changes in the x-ray signals that report the fraction and conformation of actin-attached motors can be explained if the threefold decrease in force associated with lowering temperature is due not only to a decrease in the force-generating transition in the actin-attached motors but also to a twofold decrease in the number of such motors. Thus, lowering the temperature reduces to the same extent the fraction of motors in the OFF state at rest and the fraction of motors attached to actin at T 0, suggesting that motors that leave the OFF state accumulate in a disordered refractory state that makes them unavailable for interaction with actin upon stimulation. This regulatory effect of temperature on the thick filament of mammalian skeletal muscle could represent an energetically convenient mechanism for hibernating animals.


Figures

Figure 1.
Figure 1.
Temperature dependence of the isometric force developed by the EDL muscle. (A) Relation between sarcomere length (SL) and force either at rest (open circles) or at the isometric tetanus plateau (filled circles). Temperature 29°C. The thin dashed lines join the rest and tetanus plateau values of the same record to show the SL shortening during force development. Measurements done at the ID02 beamline of the ESRF. The thick dashed line shows the force–SL relation calculated using the value of 2.2 µm for the total length of the thin filaments reported for mouse muscle (Close, 1972) and 0.16 µm for the bare zone (Linari et al., 2000). (B) Force responses to tetanic stimulation of an EDL muscle at different temperatures (color code in the inset). Time zero marks the start of the stimulation. The horizontal bars indicate the 20-ms exposure windows, with the same color code as the force traces (black for exposure at rest). (C) Temperature (T) dependence of the maximal isometric force (mean ± SEM, n = 12; six muscles).
Figure 2.
Figure 2.
Low-angle x-ray diffraction patterns from EDL muscle. The left and the right quadrants are collected at 10°C and 30°C respectively, both at rest (upper quadrants) and at the plateau of the isometric tetanus (lower quadrants). The vertical (meridional) axis is parallel to the muscle axis. Each quadrant is obtained with 2 × 20-ms exposure windows with 3.5-m camera length. On the meridional axis are indicated the myosin-based (M) and troponin-based (T) reflections. On the horizontal (equatorial) axis are indicated the strong 1,0 and 1,1 reflections arising from the filament lattice. The myosin (ML) and actin (AL) layer lines that extend in the radial direction are due to the helical arrangement of the two proteins in the thick and thin filaments.
Figure 3.
Figure 3.
Temperature dependence of the equatorial reflections. (A) Intensity of the 1,0 equatorial reflection both at rest (open circles) and at the plateau of the isometric tetanus (black circles), normalized (norm.) for the value at rest at 30°C. (B) Intensity ratio of the 1,1 and 1,0 reflections, at rest (open circles) and at the plateau of the isometric tetanus (black circles); mean ± SEM, n = 12; six muscles.
Figure 4.
Figure 4.
Temperature dependence of the myosin-based meridional reflections that signal the regulatory state of the thick filament. (A and B) Intensity profiles at rest of the M3 and M6 reflections, at 10°, 20°, and 30°C (color code in the inset). *, A peak present at the lower temperature that is not part of the M3. (C and D) Intensity profiles at the plateau of the isometric tetanus of the M3 and M6 reflections, at 10°, 20°, and 30°C (same color code as in A and B). The two main peaks of M3 fine structure are indicated. All the profiles shown in A–D are obtained from one EDL muscle (the same as in Fig. 2) by adding 2 × 20-ms exposures for each state and each temperature. (E) Temperature (T) dependence of the intensity of the M3 reflection at rest (open circles) and at the plateau of the isometric tetanus (black circles), normalized for the value at rest at 30°C. (F) Temperature dependence of the ratio between the intensity of the LA peak and the total intensity of the M3 (LM3) at the plateau of the isometric tetanus. (G and H) Temperature dependence of the spacing of the M3 and M6 reflections, respectively, at rest (open circles) and at the plateau of the isometric tetanus (black circles). Vertical scale: on the left, nm; on the right, percentage difference from the value at rest at 30°C. Data in E–H are mean ± SEM; six muscles.
Figure 5.
Figure 5.
Temperature dependence of the first myosin- and actin-based layer lines. (A and B) Intensity profiles, parallel to the meridional axis, of the myosin- and actin-layer lines (ML1 and AL1), in the range 10°–30°C (color code in the insets) at rest (A) and at the plateau of the isometric tetanus (B), from one muscle. In A, the thin vertical dashed lines represent the limits of integration for the estimate of the temperature dependence of the intensity of ML1 (IML1). The thick black dashed line represents the Gaussian intensity distribution expected for AL1 at rest (see text). In B, the thin dashed lines represent the results of the Gaussian fit used to separate the contribution of ML1 (left) and AL1 (right). See text for details. All the profiles shown in A and B are obtained from the same EDL muscle as in Fig. 2 by adding 2 × 20-ms exposures for each state and each temperature. a.u., arbitrary units. (C) Temperature (T) dependence of the intensity of the ML1 layer line at rest (open circles) and at the plateau of the isometric tetanus (black circles), normalized for the value at rest at 30°C. (D) Temperature dependence of the intensity of the AL1 layer line (IAL1) at the plateau of the isometric tetanus (black circles), normalized for its value at 30°C. The horizontal dashed line represents the expected value of IAL1 at rest (0.15, see text). Data in C and D are mean ± SEM; six muscles.
Figure 6.
Figure 6.
Fraction of OFF motors at rest and of motors attached in isometric contraction. (A) Fraction of motors in the OFF (ordered) conformation, fOFF, at rest as a function of temperature, calculated from the intensity of the M3 (circles, from six muscles) and ML1 (triangles, from three muscles). (B) Fraction of motors attached at the plateau of the isometric tetanus, fA, calculated from the intensity of the M3 (circles, from six muscles) and AL1 (triangles, from three muscles), as described in the text. On the left ordinate axis, fA has been normalized to its value at 30°C for a direct comparison with fOFF in A. (C) Duty ratio (r), calculated as explained in the text. Values in A–C are mean ± SEM.
Figure 7.
Figure 7.
Comparison of the M3 fine structure in frog and mouse muscles. (A) Temperature dependence of the M3 fine structure, measured by LM3 (see text), in frog (filled circles) and mouse (open circles) skeletal muscle. (B) Relation between force and LM3 in isometric tetanic contraction at different temperatures for frog skeletal muscle (filled circles, temperature range 0°–17°C) and for mouse skeletal muscle (open circles, temperature range 10°–35°C). Data are mean ± SEM. The data for frog muscle are from Linari et al. (2005).
Figure 8.
Figure 8.
Scheme of the regulatory effect of temperature on thick filament. Myosin motors at rest either lie on the surface of the thick filament in the ordered OFF state, folded back toward the center of the sarcomere, or are in a disordered state refractory to activation, REF. Lowering the temperature (blue arrow) favors the REF state, while increasing the temperature (red arrow) favors the OFF state. Upon muscle activation, only the fraction of motors in the OFF state are recruited, in relation to the stress on the thick filament (black arrows), into the disordered ON ADP.Pi-state, from which they can attach to actin and enter the mechanochemical cycle (bounded by the red line). The state of the ligand in the nucleotide-binding pocket of the motor is highlighted in yellow. The motor domain of the head is red except in the REF state (gray), for which the state of the ligand is not defined. The backbone of the thick filament has a shorter periodicity in the OFF state (cyan), which increases both in the REF state (light blue) or when the thick filament is switched ON (blue) because motors have moved away from the ordered helical disposition along the surface of the filament.

Comment in

References

    1. Bershitsky S.Y., Tsaturyan A.K., Bershitskaya O.N., Mashanov G.I., Brown P., Burns R., and Ferenczi M.A.. 1997. Muscle force is generated by myosin heads stereospecifically attached to actin. Nature. 388:186–190. 10.1038/40651 - DOI - PubMed
    1. Bordas J., Lowy J., Svensson A., Harries J.E., Diakun G.P., Gandy J., Miles C., Mant G.R., and Towns-Andrews E.. 1995. X-ray evidence that in contracting live frog muscles there exist two distinct populations of myosin heads. Biophys. J. 68(4 Suppl):99S–104S. - PMC - PubMed
    1. Brenner B., and Yu L.C.. 1991. Characterization of radial force and radial stiffness in Ca(2+)-activated skinned fibres of the rabbit psoas muscle. J. Physiol. 441:703–718. 10.1113/jphysiol.1991.sp018774 - DOI - PMC - PubMed
    1. Brunello E., Fusi L., Reconditi M., Linari M., Bianco P., Panine P., Narayanan T., Piazzesi G., Lombardi V., and Irving M.. 2009. Structural changes in myosin motors and filaments during relaxation of skeletal muscle. J. Physiol. 587:4509–4521. 10.1113/jphysiol.2009.176222 - DOI - PMC - PubMed
    1. Burkholder T.J., Fingado B., Baron S., and Lieber R.L.. 1994. Relationship between muscle fiber types and sizes and muscle architectural properties in the mouse hindlimb. J. Morphol. 221:177–190. 10.1002/jmor.1052210207 - DOI - PubMed

Publication types