. 2019 Dec;25(12):1793-1805.
doi: 10.1261/rna.070987.119. Epub 2019 Sep 25.

Exon size and sequence conservation improves identification of splice-altering nucleotides

Affiliations

Exon size and sequence conservation improves identification of splice-altering nucleotides

Maliheh Movassat et al. RNA. 2019 Dec.

Abstract

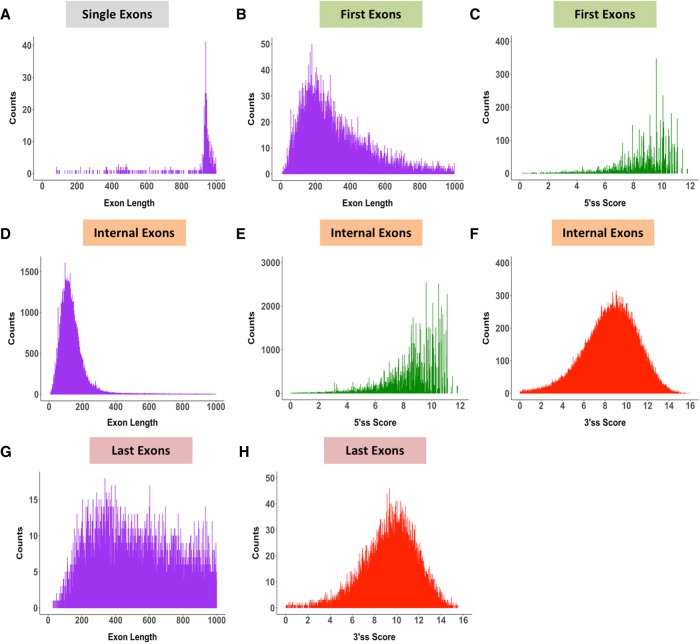
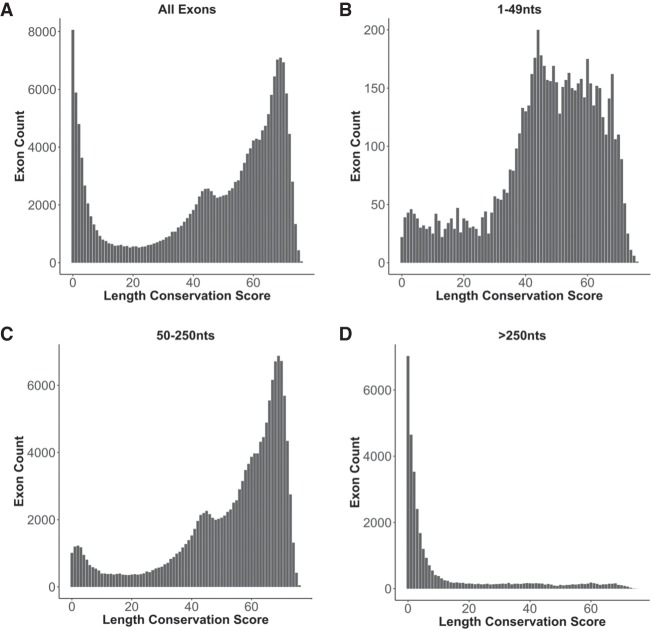
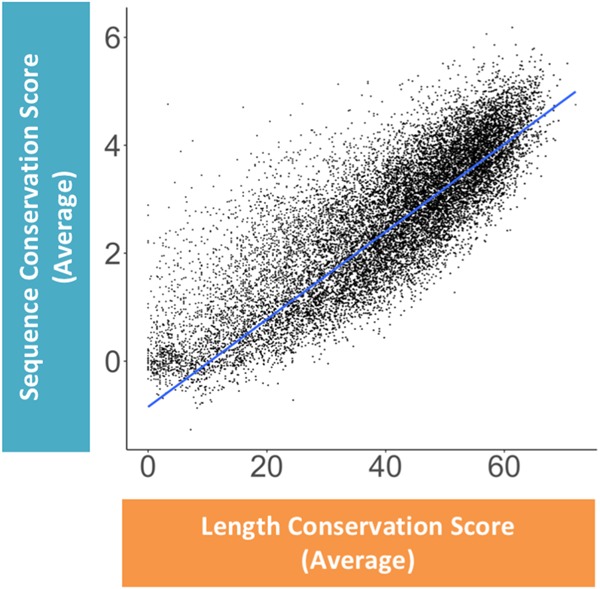
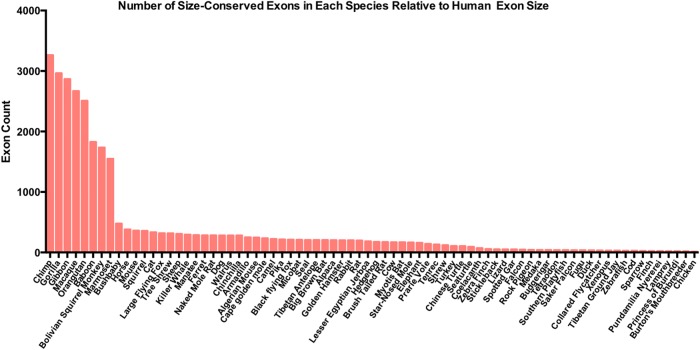
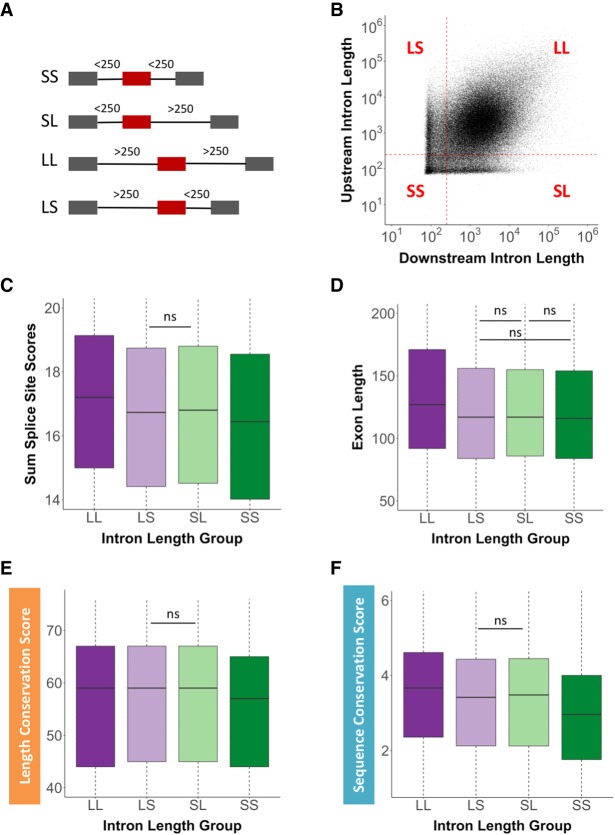
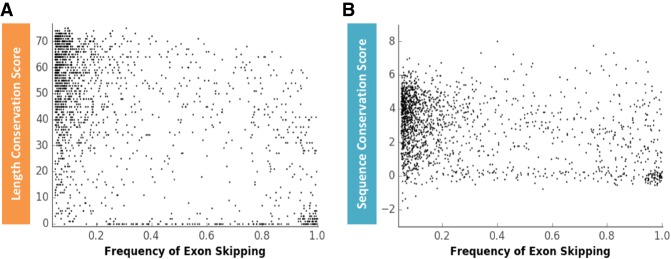
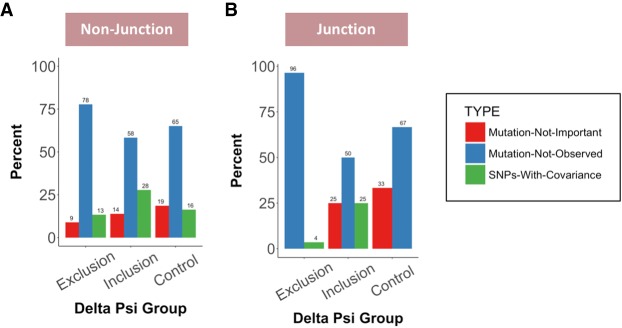
Pre-mRNA splicing is regulated through multiple trans-acting splicing factors. These regulators interact with the pre-mRNA at intronic and exonic positions. Given that most exons are protein coding, the evolution of exons must be modulated by a combination of selective coding and splicing pressures. It has previously been demonstrated that selective splicing pressures are more easily deconvoluted when phylogenetic comparisons are made for exons of identical size, suggesting that exon size-filtered sequence alignments may improve identification of nucleotides evolved to mediate efficient exon ligation. To test this hypothesis, an exon size database was created, filtering 76 vertebrate sequence alignments based on exon size conservation. In addition to other genomic parameters, such as splice-site strength, gene position, or flanking intron length, this database permits the identification of exons that are size- and/or sequence-conserved. Highly size-conserved exons are always sequence-conserved. However, sequence conservation does not necessitate exon size conservation. Our analysis identified evolutionarily young exons and demonstrated that length conservation is a strong predictor of alternative splicing. A published data set of approximately 5000 exonic SNPs associated with disease was analyzed to test the hypothesis that exon size-filtered sequence comparisons increase detection of splice-altering nucleotides. Improved splice predictions could be achieved when mutations occur at the third codon position, especially when a mutation decreases exon inclusion efficiency. The results demonstrate that coding pressures dominate nucleotide composition at invariable codon positions and that exon size-filtered sequence alignments permit identification of splice-altering nucleotides at wobble positions.

Keywords: SNPs; alternative splicing; exon conservation; phylogenetics; splicing.


Figures

FIGURE 1.
FIGURE 1.
Architecture of the human genome. Exons categorized into four distinct types (single, first, internal, and last exons) contain varying exon length distributions but maintain strong splice-site scores. (A) Exon length distribution of single exons. (B) Exon length distribution of first exons. (C) 5′ss score of first exons. (D) Exon length distribution of internal exons. (E) 5′ss score of internal exons. (F) 3′ss score of internal exons. (G) Exon length distribution of last exons. (H) 3′ss score of last exons.
FIGURE 2.
FIGURE 2.
Distribution of exons across 76 length-conserved species. The length conservation score is defined as the number of species with length-conserved exons when compared to human. The number of exons in each length conservation bin is plotted for (A) all types of exons, (B) all exons between 1 and 49 nt in length, (C) exons between 50 and 250 nt in length, and (D) exons longer than 250 nt in length.
FIGURE 3.
FIGURE 3.
Correlation between average length and sequence conservation of internal exons. The correlation between the average sequence conservation score and the average length conservation score of all internal exons within a single gene is shown. Each dot denotes a single gene represented by the average sequence and length conservation score for all its internal exons. The blue line represents a regression fit to the data, R = 0.84.
FIGURE 4.
FIGURE 4.
Exon size comparison between human and other species. The number of size-conserved internal exons within the 0–10 Ultra-In group of exons are reported for each of the 76 species used in the exon size database. Species names are listed on the x-axis and count of exons per each species is depicted on the y-axis.
FIGURE 5.
FIGURE 5.
Distribution of intron lengths flanking internal exons. (A) Cartoon depiction of the four intron length-defined exon groups. Exons that are flanked by (SS) short short, (SL) short long, (LL) long long, or (LS) long short introns. Gray boxes represent flanking exons, red boxes represent internal exons, and black lines represent introns of various lengths. The numbers above the introns indicate length definitions. (B) Correlation between upstream and downstream intron lengths flanking internal exons. Each quadrant is defined by the length of the upstream and downstream intron length, respectively. The red dotted lines depict the intron length of 250 nt, the established transition from intron to exon definition. Each black dot represents a single internal exon. The four exon groups were correlated with (C) the sum of the 5′ss and 3′ss scores, (D) the internal exon length, (E) the length conservation score, and (F) the sequence conservation score. All intron length comparisons are statistically significant (P < 0.05) unless marked by “ns” (not significant).
FIGURE 6.
FIGURE 6.
Correlation between the frequency of alternative exon skipping and exon length or sequence conservation. (A) Correlation between exon length conservation (Ultra-In score) and the frequency of exon skipping (Pearson correlation coefficient: −0.484, P-value: 1.5 × 10−97). (B) Correlation between exon sequence conservation (phyloP score) and the frequency of exon skipping (Pearson correlation coefficient: −0.327, P-value: 1.5 × 10−42). Each black dot represents a skipped exon. X-axis scale: 0 = no exon skipping, 1 = 100% exon skipping.
FIGURE 7.
FIGURE 7.
Splice-altering SNPs at the wobble position are selected against. The evolutionary conservation of exonic SNPs at wobble positions are compared between the delta psi groups that lead to increased exon exclusion, increased exon inclusion, or the control group that do not change exon inclusion levels. The relative representation of “Mutation-Not-Important” (red bars), “Mutation-Not-Observed” (blue bars), or “SNPs-With-Covariance” (green bars) are shown for (A) nonjunction exonic positions and (B) junction exonic positions.

References

    1. Alekseyenko AV, Kim N, Lee CJ. 2007. Global analysis of exon creation versus loss and the role of alternative splicing in 17 vertebrate genomes. RNA 13: 661–670. 10.1261/rna.325107 - DOI - PMC - PubMed
    1. Berget SM. 1995. Exon recognition in vertebrate splicing. J Biol Chem 270: 2411–2414. - PubMed
    1. Blanchette M, Kent WJ, Riemer C, Elnitski L, Smit AFA, Roskin KM, Baertsch R, Rosenbloom K, Clawson H, Green ED, et al. 2004. Aligning multiple genomic sequences with the threaded blockset aligner. Genome Res 14: 708–715. 10.1101/gr.1933104 - DOI - PMC - PubMed
    1. Busch A, Hertel KJ. 2013. HEXEvent: a database of Human EXon splicing Events. Nucleic Acids Res 41: D118–D124. 10.1093/nar/gks969 - DOI - PMC - PubMed
    1. Busch A, Hertel KJ. 2015. Splicing predictions reliably classify different types of alternative splicing. RNA 21: 813–823. 10.1261/rna.048769.114 - DOI - PMC - PubMed

Publication types