. 2019 Sep 25;10(1):4352.
doi: 10.1038/s41467-019-12239-w.

FRQ-CK1 interaction determines the period of circadian rhythms in Neurospora

Affiliations

FRQ-CK1 interaction determines the period of circadian rhythms in Neurospora

Xiao Liu et al. Nat Commun. .

Erratum in

Abstract

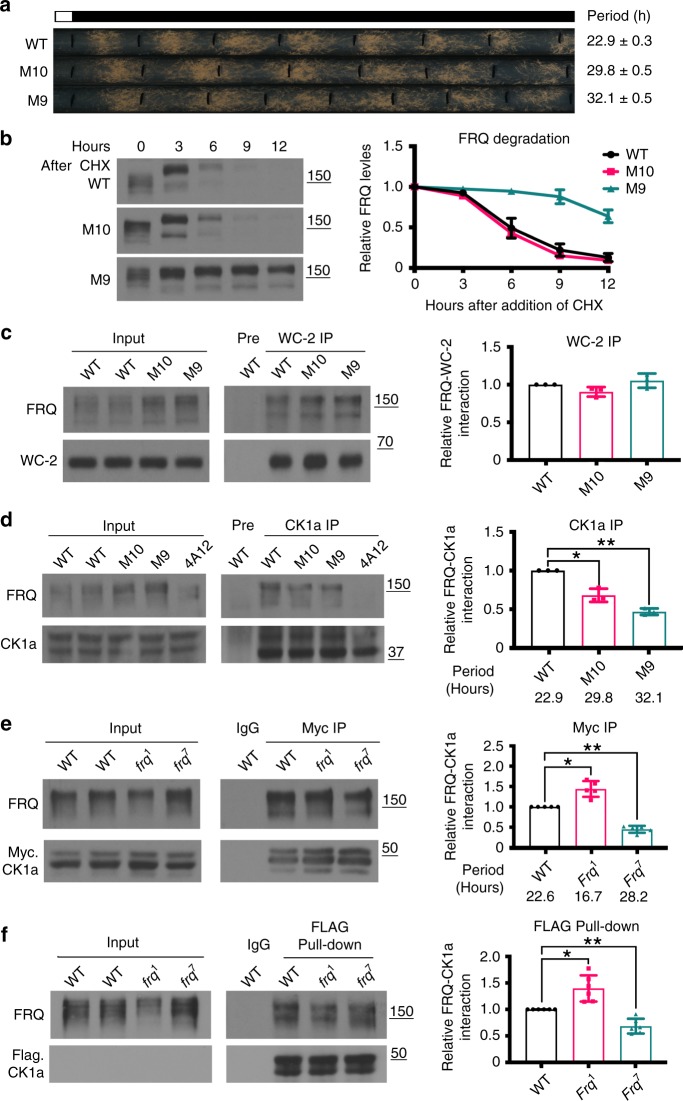
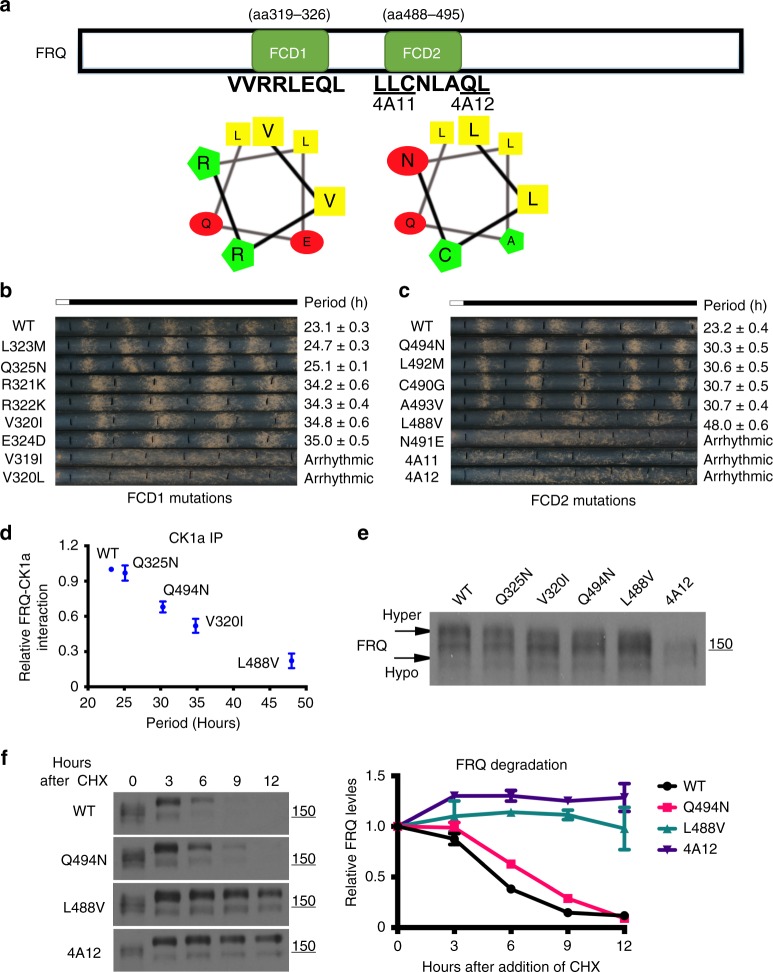
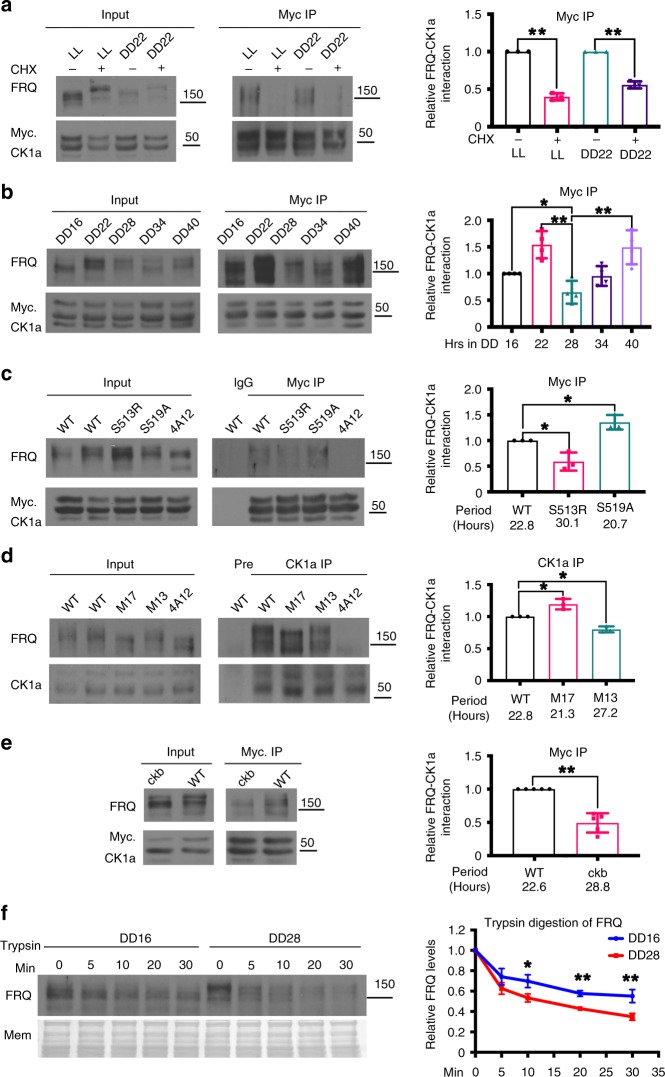
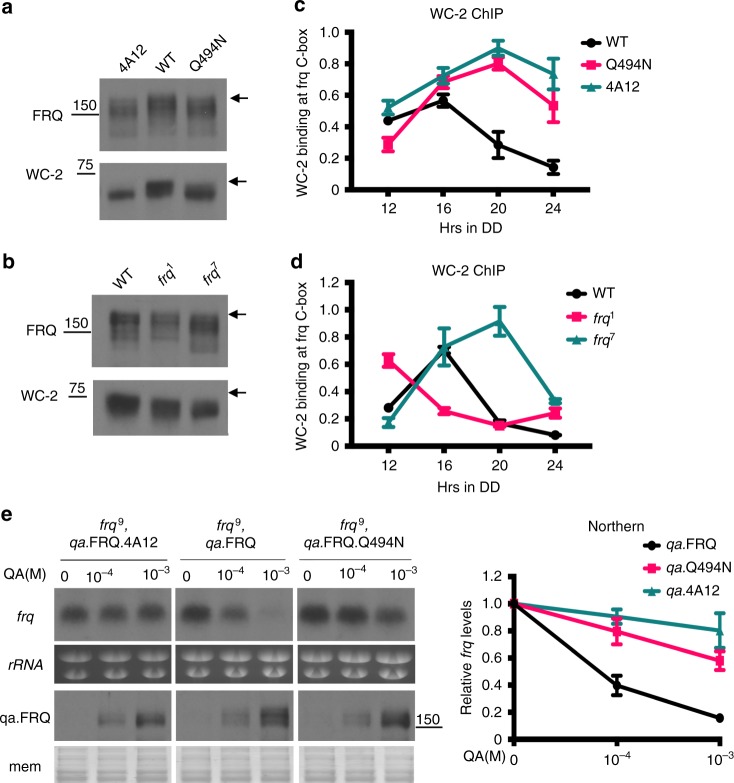
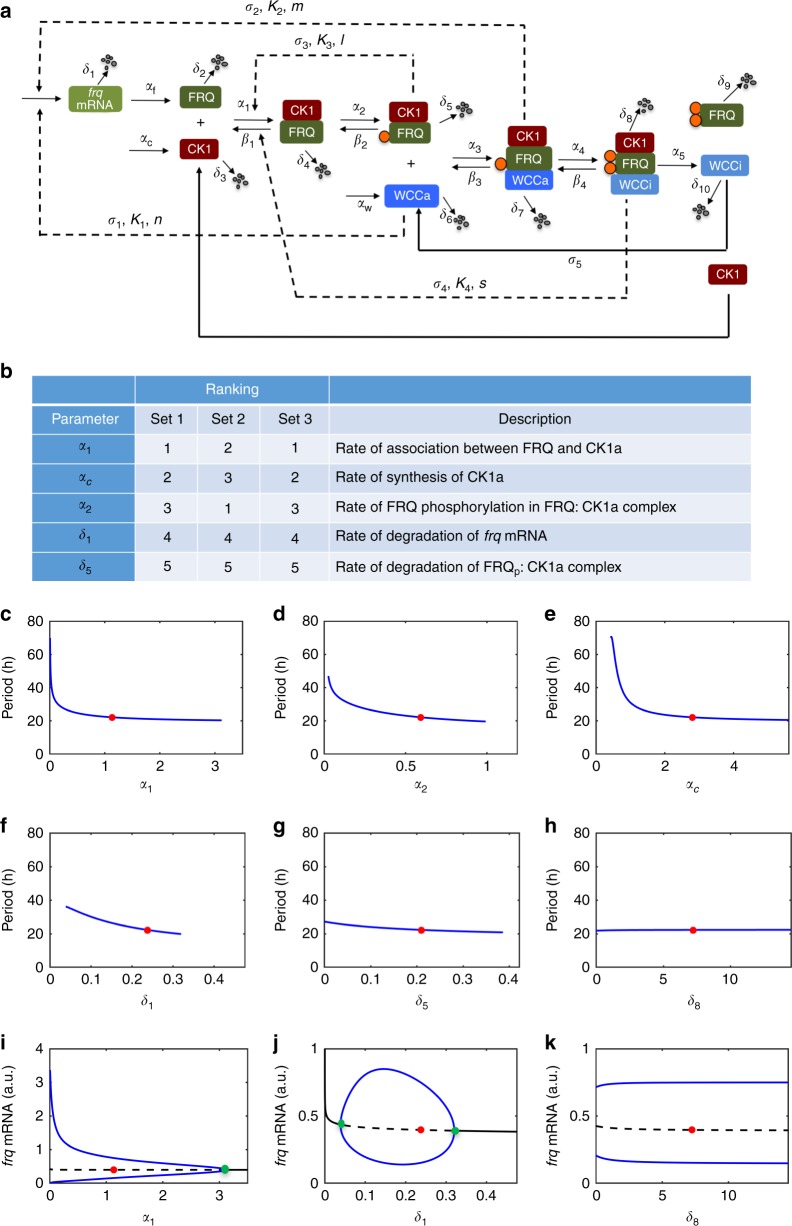
Circadian clock mechanisms have been extensively investigated but the main rate-limiting step that determines circadian period remains unclear. Formation of a stable complex between clock proteins and CK1 is a conserved feature in eukaryotic circadian mechanisms. Here we show that the FRQ-CK1 interaction, but not FRQ stability, correlates with circadian period in Neurospora circadian clock mutants. Mutations that specifically affect the FRQ-CK1 interaction lead to severe alterations in circadian period. The FRQ-CK1 interaction has two roles in the circadian negative feedback loop. First, it determines the FRQ phosphorylation profile, which regulates FRQ stability and also feeds back to either promote or reduce the interaction itself. Second, it determines the efficiency of circadian negative feedback process by mediating FRQ-dependent WC phosphorylation. Our conclusions are further supported by mathematical modeling and in silico experiments. Together, these results suggest that the FRQ-CK1 interaction is a major rate-limiting step in circadian period determination.


Conflict of interest statement

The authors declare no competing interests.

Figures

Fig. 1
Fig. 1
Period correlates with FRQ-CK1a interaction, but not with FRQ stability. a Race tube assay showing the circadian conidiation rhythms of two FRQ phosphorylation site mutants M9 and M10. Error bars are standard error of mean (n = 6). b Western blot analysis showing FRQ degradation profiles in the indicated strains after the addition of CHX. Both of hyper- and hypo-phosphorylated forms of FRQ are included in the quantification. The densitometric analysis results are shown on the right. Error bars indicate standard deviations (n = 3). The position of the molecular weight marker is indicated. c WC-2 immunoprecipitation assay in the M9 and M10 mutants. Quantification of relative FRQ-WC-2 interaction levels is based on the ratio of IP to Input and normalized with WC-2 level. The densitometric analysis is shown on the right. Error bars indicate standard deviations (n = 3). d CK1a immunoprecipitation assay in M9 and M10 mutants. Quantification of relative FRQ-CK1a interaction levels is based on the ratio of IP to Input and normalized with CK1a level. The densitometric analysis is shown on the right. Error bars are standard deviations (n = 3). *P < 0.05, **P < 0.01. Student’s t-test was used. e c-Myc immunoprecipitation assay in the wild-type, frq1, and frq7 strains that express Myc.CK1a. Strains were cultured in LL. The densitometric is shown on the right. Error bars are standard deviations (n = 5). *P < 0.05, **P < 0.01. Student’s t-test was used. f FLAG-CK1a pull-down in wild-type, frq1, and frq7 extracts. Recombinant FLAG-CK1a was incubated with the extracts, and anti-FLAG was used to immunoprecipitate FLAG-CK1a. Quantification of relative FRQ-CK1a interaction levels is based on the ratio of IP to Input. The densitometric analysis is shown on the right. Error bars are standard deviations (n = 6). *P < 0.05, **P < 0.01. Student’s t-test was used. All strains were cultured in LL. Source data are provided as a Source Data file
Fig. 2
Fig. 2
Dramatic impact on period by mutating the FCD domains. a A schematic diagram showing the FRQ FCD1 and FCD2 domains. The amino acid sequences within the domains that are critical for FRQ-CK1a interaction and helical representations are shown. The 4A11 and 4A12 mutations previously shown to completely disrupt the FRQ-CK1a interaction are indicated. b, c Race tube assays showing the circadian conidiation rhythms and the period lengths of strains with mutation in b the FCD1 and c the FCD2 domains. Errors are standard errors of means (n = 5). d c-Myc immunoprecipitation assay showing that the amount of FRQ-Myc.CK1a in selected FCD period mutant strains relative to the amount in the wild-type strain. The strains were cultured in LL. Error bars are standard deviations (n = 4). e Western blot analysis comparing the FRQ phosphorylation profiles in the indicated strains. Strains were cultured in LL. Arrows indicates hyper- and hypo-phosphorylated FRQ. The position of the molecular weight marker is indicated. f Western blot analysis of FRQ in indicated strains after CHX treatment. Both hyper- and hypo-phosphorylated forms of FRQ are included in the quantification. The densitometric analysis is shown on the right. Error bars are standard deviations (n = 3). Source data are provided as a Source Data file
Fig. 3
Fig. 3
Regulation of the FRQ-CK1a interaction by FRQ phosphorylation. a c-Myc immunoprecipitation assay in the wild-type strain with and without CHX treatment. The cultures were grown in LL or DD and were treated with CHX for 1 h before immunoprecipitation was performed. Quantification of relative FRQ-CK1a interaction levels is based on the ratio of IP to Input. The densitometric analysis is shown on the right. Error bars are standard deviations (n = 3). **P < 0.01. Student’s t-test was used. The position of the molecular weight marker is indicated. b c-Myc immunoprecipitation assay in the wild-type strain at indicated time points in DD. The densitometric analysis is shown on the right. Error bars are standard deviations (n = 4). *P < 0.05, **P < 0.01. Student’s t-test was used. c, d c-Myc (c) or CK1a (d) immunoprecipitation assays showing the relative FRQ-CK1a interaction in the indicated FRQ phosphorylation sites mutants in LL. Long period mutants (S513R, M13) showed reduced FRQ-CK1a interaction while the interaction was increased in the short period mutants (S519A and M17). (n = 3). *P < 0.05. Student’s t-test was used. e c-Myc immunoprecipitation assays showing the relative FRQ-CK1a interaction is decreased in the long period ckbRIP mutant in LL. (n = 5). **P < 0.01. Student’s t-test was used. f Western blot showing trypsin digestion of hypophosphorylated (DD16) and hyperphosphorylated (DD28) FRQ. Densitometric quantification of full-length FRQ relative to the amount at time 0 is shown on the right. Error bars are standard deviations (n = 4). *P < 0.05, **P < 0.01. Student’s t-test was used. Source data are provided as a Source Data file
Fig. 4
Fig. 4
FRQ-CK1a interaction determines FRQ activity in the negative feedback loop. a, b Western blot analyses showing the phosphorylation profiles of FRQ and WC-2 in the indicated strains. The arrows indicate the hyperphosphorylated FRQ or WC-2 species. The position of the molecular weight marker is indicated. c, d WC-2 ChIP assays showing that the relative enrichment levels of WC-2 at the c-box of frq promoter in the indicated strains collected at different time points in DD. Error bars are standard deviations (n = 3). e Northern blot analysis showing the frq mRNA levels in the indicated strains after the induction of FRQ or its mutant form by QA at different concentrations. Error bars are standard deviations (n = 3). Source data are provided as a Source Data file
Fig. 5
Fig. 5
Mathematical modeling of circadian period determination. a Wiring diagram for the Neurospora circadian clock. Dashed arrows indicate modes of action of proteins or protein complexes, and the letters above each arrow indicate parameters involved in the step. Solid orange circles indicate phosphorylation of FRQ by CK1a. Please see the methods and supplementary information for equations and description of parameters. b The top five parameters that influence the period of the Neurospora circadian clock identified from computer simulations using three independent sets of parameters. ch Representative changes of period as a function of α1, α2, αc, δ1, δ5, and δ8 from the parameter set 1. Solid red circles indicate default parameter values. ik One-parameter bifurcation diagrams as functions of α1, δ1, and δ8 indicating the steady state of frq mRNA. Solid black lines represent stable steady state and dashed black lines represent unstable steady state with stable limit cycle. Blue lines indicate maximum/peak and minimum/trough of frq mRNA oscillations. Solid red circles indicate default parameter values, and solid green circles indicate Hopf bifurcation points

Similar articles

Cited by

References

    1. Dunlap JC. Molecular bases for circadian clocks. Cell. 1999;96:271–290. - PubMed
    1. Young MW, Kay SA. Time zones: a comparative genetics of circadian clocks. Nat. Rev. Genet. 2001;2:702–715. - PubMed
    1. Bell-Pedersen D, et al. Circadian rhythms from multiple oscillators: lessons from diverse organisms. Nat. Rev. Genet. 2005;6:544–556. - PMC - PubMed
    1. Schibler U, Sassone-Corsi P. A web of circadian pacemakers. Cell. 2002;111:919–922. - PubMed
    1. Partch CL, Green CB, Takahashi JS. Molecular architecture of the mammalian circadian clock. Trends Cell Biol. 2014;24:90–99. - PMC - PubMed

Publication types