. 2019 Sep 25;10(1):4368.
doi: 10.1038/s41467-019-12349-5.

R-spondin 3 promotes stem cell recovery and epithelial regeneration in the colon

Affiliations

R-spondin 3 promotes stem cell recovery and epithelial regeneration in the colon

Christine Harnack et al. Nat Commun. .

Abstract

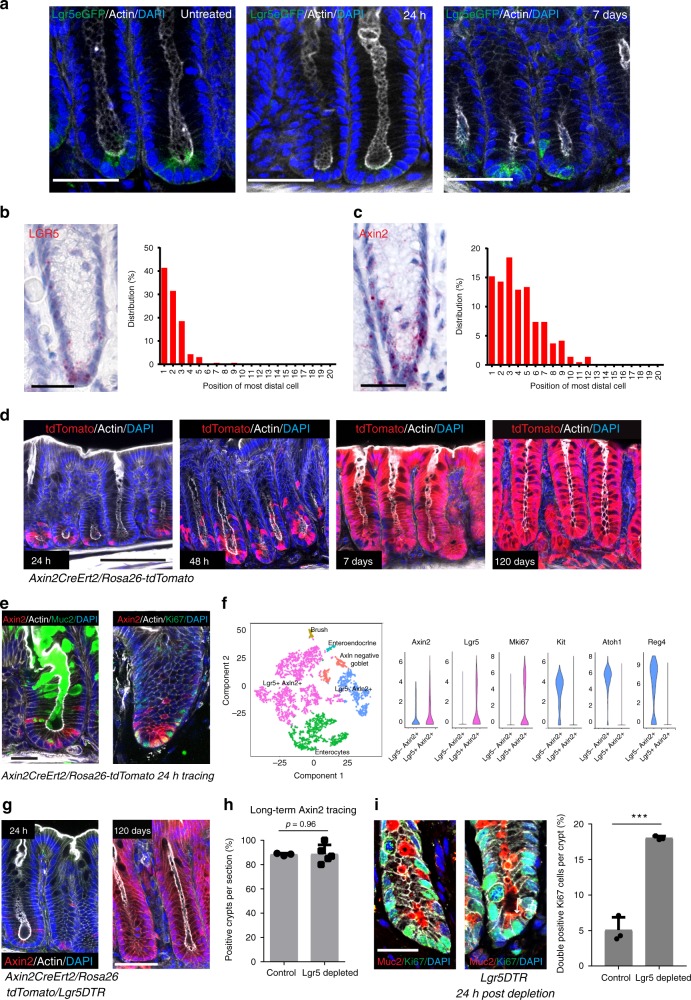
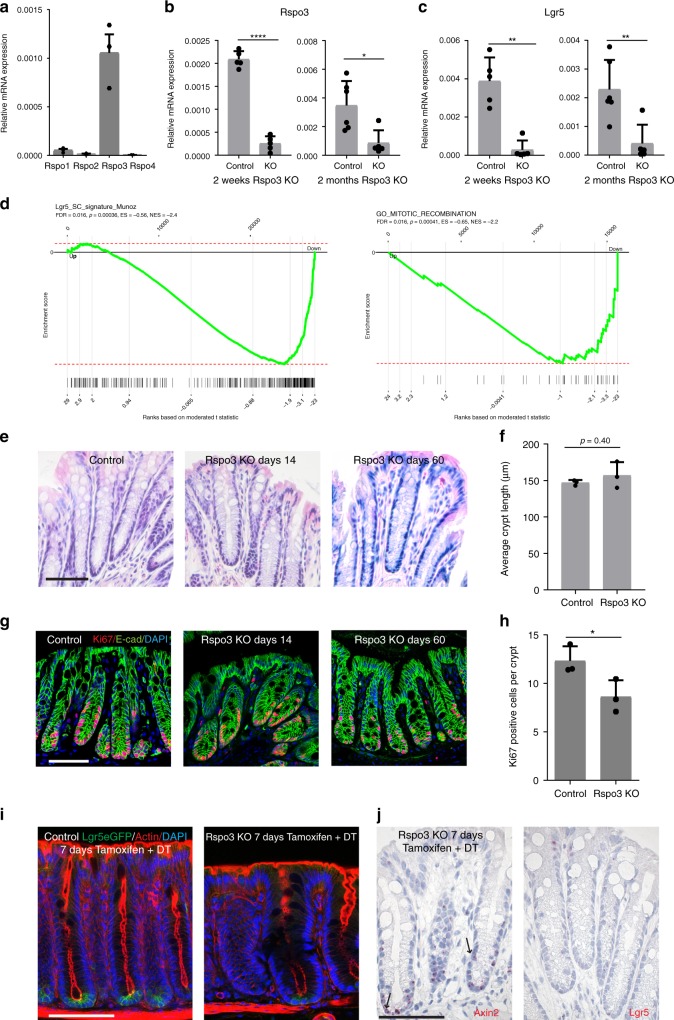
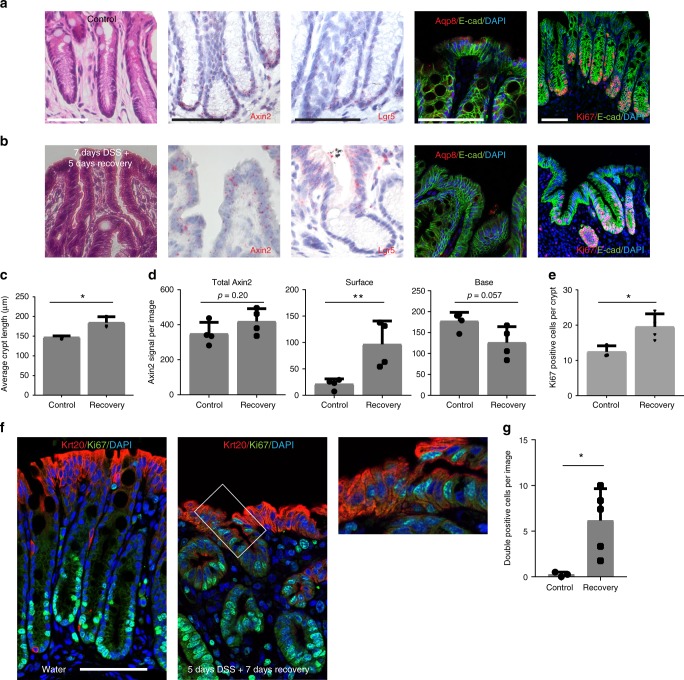
The colonic epithelial turnover is driven by crypt-base stem cells that express the R-spondin receptor Lgr5. Signals that regulate epithelial regeneration upon stem cell injury are largely unknown. Here, we explore the dynamics of Wnt signaling in the colon. We identify two populations of cells with active Wnt signaling: highly proliferative Lgr5+/Axin2+ cells, as well as secretory Lgr5-/Axin2+ cells. Upon Lgr5+ cell depletion, these cells are recruited to contribute to crypt regeneration. Chemical injury induced by DSS leads to a loss of both Lgr5+ cells and Axin2+ cells and epithelial regeneration is driven by Axin2- cells, including differentiated Krt20+ surface enterocytes. Regeneration requires stromal Rspo3, which is present at increased levels upon injury and reprograms Lgr5- but Lgr4+ differentiated cells. In contrast, depletion of stromal Rspo3 impairs crypt regeneration, even upon mild injury. We demonstrate that Rspo3 is essential for epithelial repair via induction of Wnt signaling in differentiated cells.


Conflict of interest statement

The authors declare no competing interests.

Figures

Fig. 1
Fig. 1
Wnt-responsive Axin2+ cells restore the colonic Lgr5+ stem cell compartment upon depletion. a Immunofluorescence images from the colon of Lgr5DTReGFP mice, left untreated (left panel) or treated with a single dose of diphtheria toxin 24 h (middle) or 7 days (right) before sacrifice (scale bar = 50 µm). b Single-molecule in situ hybridization for Lgr5 and determination of Lgr5+ cell positions counted from the crypt base. c Single-molecule in situ hybridization for Axin2 and determination of Axin2+ cell positions counted from the crypt base. d Immunofluorescence images from the colon of Axin2CreErt2/Rosa-26tdTomato mice, showing Axin2 lineage tracing for 24 h, 48 h, 7 days and 120 days induced by a single dose of tamoxifen. e Images of colon tissue from Axin2CreErt2/Rosa-26tdTomato mice showing Axin2 lineage tracing for 24 h, co-stained for MUC2 (left), and Ki67 (right) (scale bar = 25 µm). f t-SNE plot of single-cell RNAseq data from colon crypts, violin plots for selected genes expressed in the Lgr5+/Axin+ compared to the Lgr5/Axin+ population. g Immunofluorescence images of the colon of triple heterozygous Lgr5DTReGFP/Axin2CreErt2/Rosa26-tdTomato mice treated either with a single dose of diphtheria toxin (to ablate Lgr5+ cells) and tamoxifen (to start Axin2+ cell tracing) 24 h before sacrifice (left panel) or a single dose of tamoxifen plus three doses of diphtheria toxin on 3 consecutive days 120 days before sacrifice (right panel) (scale bar = 50 µm). h Quantification of tdTomato+ crypts in Axin2CreErt2/Rosa26-tdTomato animals treated with a single dose of tamoxifen (control n = 3 mice), and Lgr5DTReGFP/Axin2CreErt2/Rosa26-tdTomato mice treated with a single dose of tamoxifen plus three doses of diphtheria toxin on 3 consecutive days (Lgr5 depletion n = 5 mice). Animals were sacrificed after 60 days (scale bar = 50 µm). i Confocal images of colon tissue of control and Lgr5DTR mice treated with diphtheria toxin three times, and labeled after 24 h recovery for Muc2 (red) and Ki67 (green); quantification of double-positive cells per crypt (n = 3 mice per group, scale bar = 25 µm). Data represent mean ± SD; Student’s t-test (two-tailed) was applied in all cases. ***p < 0.001. Scale bar = 100 µm unless indicated otherwise. Source data are provided as a source data file
Fig. 2
Fig. 2
Rspo3 from in Myh11+ myofibroblasts determines the stem cell signature and is required for Lgr5+ cell recovery. a qPCR for Rspo homologs from colon tissue from n = 3 mice. b qPCR for Rspo3 in Myh11CreErt2/Rspo3fl/fl mice (Rspo3 KO) and corresponding Myh11CreErt2/Rspo3+/+ control mice at 2 weeks (n = 5 mice per group) and 2 months (n = 6 control mice, n = 5 Rspo3 KO mice) after injection of tamoxifen into Rspo3 KO and corresponding controls (2 months data: Mann–Whitney U-test (two-tailed) was performed). c qPCR for Lgr5 in Myh11CreErt2/Rspo3fl/fl mice (Rspo3 KO) and corresponding Myh11CreErt2/Rspo3+/+ control mice at 2 weeks (n = 5 mice per group) and 2 months (n = 6 control mice, n = 5 Rspo3 KO mice) after injection of tamoxifen into Rspo3 KO and corresponding controls (Mann–Whitney U-test (two-tailed). d GSEA analysis of genes differentially expressed in colon tissue from Rspo3 KO versus control mice in comparison to the previously published small intestinal Lgr5+ stem cell signature gene set and in comparison to the mitotic recombination related signature gene set obtained from MSigDB (data from two microarrays from independent biological replicates per group). e H&E staining of the colon from a control and an Rspo3 KO mouse at 14 and 60 days after tamoxifen treatment, showing no marked anatomical differences. f Average crypt length in colon tissue from control (n = 3 mice) and an Rspo3 KO (n = 4 mice) mice 60 days after tamoxifen treatment. g Confocal microscopy image of colon tissue from control and Rspo3 KO mice at 14 and 60 days after tamoxifen treatment stained for Ki67 (red), E-cadherin (green), and DAPI. h Quantification of Ki67+ cells per crypt section of control and Rspo3 KO mice 60 days after tamoxifen treatment (n = 3 mice per group). i Confocal microscopy images from the colon of an Lgr5DTReGFP/Myh11CreErt2/Rspo3fl/fl and an Lgr5DTReGFP/Myh11CreErt2/Rspo3+/+ mouse treated with a single dose of tamoxifen and DT 7 days before sacrifice. j Single-molecule in situ hybridization for Axin2 and Lgr5 on colon tissue from an Lgr5DTReGFP/Myh11CreErt2/Rspo3fl/fl mouse treated with DT and tamoxifen (scale bar = 100 µm). Data represent mean ± SD, Student’s t-test (two tailed) was applied in all cases, unless otherwise specified. *p < 0.05, **p < 0.01, ***p < 0.001, ****p < 0.0001. Scale bar = 100 µm unless indicated otherwise. Source data are provided as a source data file
Fig. 3
Fig. 3
Endogenous Rspo3 is crucial during DSS-induced injury. a Weight curves of control and Rspo3 KO mice during DSS treatment (n = 3 mice per group). b Comparison of colon length in control and Rspo3 KO mice sacrificed on day 7 of DSS treatment (n = 3 mice per group (p = 0.1000, Mann–Whitney U-test (two-tailed)). c H&E staining of colon tissue from an untreated control mouse, a DSS-treated control mouse and a DSS-treated Rspo3 KO mouse sacrificed at 7 days of DSS treatment. The Rspo3 KO mouse shows an almost complete loss of the epithelial lining. d Confocal microscopy of the colon epithelium detected by immunofluorescence labeling of E-cadherin in an untreated control mouse, a DSS-treated control mouse, and a DSS-treated Rspo3 KO mouse sacrificed at 7 days of DSS treatment. e H&E staining of colon tissue from a control and an Rspo3 KO mouse treated with DSS for 3 days. f Weight of WT and Rspo3 KO mice on day 3 of DSS treatment, n = 3 mice per group. g Confocal microscopy images displaying Ki67 expression in the colon of a control and Rspo3 KO mouse. h Quantification of Ki67+ cells per crypt section in control and Rspo3 KO mice treated with DSS for 3 days (n = 3 mice per group). i Confocal microscopy images displaying apoptosis in the colon of a control and Rspo3 KO mouse on day 3 of DSS treatment. j Average crypt length in control and Rspo3 KO mice treated with DSS for 3 days (n = 3 mice per group). All experiments were performed in at least three biological replicates. Data represent mean ± SD, Student’s t-test (two-tailed) was applied in all cases, unless otherwise specified. *p < 0.05, **p < 0.01, ***p < 0.001, ****p < 0.0001. Scale bar = 100 µm unless indicated otherwise. Source data are provided as a source data file
Fig. 4
Fig. 4
DSS-induced loss of the crypt bases containing stem and reserve stem cells. a H&E staining of colon tissue from untreated mice (left) and mice treated with DSS for 3 days (middle) and 7 days (right). b Average crypt length of control, 3 days DSS treated and 7 days DSS-treated animals (n = 3 mice per group). c Immunofluorescence labeling for Ki67 in tissue from untreated mice (left) and mice treated with DSS for 3 days (middle) and 7 days (right). d Quantification of Ki67-positive cells per crypt (data from n = 3 mice per group). e Single-molecule in situ hybridization for Lgr5 in tissue from untreated mice (left) and mice treated with DSS for 3 days (middle) and 7 days (right). f Quantification of Lgr5 signal per image of tissue shown in e (images from n = 3 to n = 4 mice per group). g Single-molecule in situ hybridization for Axin2 in tissue from untreated mice (left) and mice treated with DSS for 3 days (middle) and 7 days (right). h Quantification of Axin2 signal per image shown in g (images from n = 3 to n = 4 mice per group, Kruskal–Wallis test with Dunn's post hoc test was used). All experiments were performed in at least three biological replicates. Data represent mean ± SD; one-way ANOVA and Dunnett´s test for correction of multiple testing was applied in all cases, unless otherwise specified. *p < 0.05, **p < 0.01, ***p < 0.001, ****p < 0.0001. Scale bar = 100 µm unless indicated otherwise. Source data are provided as a source data file
Fig. 5
Fig. 5
Differentiated epithelial cells are reprogrammed to act as stem cells during recovery. a Confocal microscopy images from whole mounts of the colon from Axin2CreErt2/Rosa26-tdTomato mice either untreated or treated with 1.5% or 2% DSS. A single dose of tamoxifen was injected into the animals on the last day of DSS treatment except the pre-traced mouse, where lineage tracing was performed for 1 month before DSS treatment. Lineage tracing and recovery was carried out for 1 month (scale bar = 100 µm). b Quantification of tdTomato-positive crypts from animals shown in a (control n = 4 mice, DSS-treated n = 3 mice, pre-traced n = 3 mice). c t-SNE plots of RNA single-cell sequencing show no overlap of the Lgr5+ or Axin2+ cell clusters with the Krt20+ cell population; violin plots for Krt20 and Lgr4 in these two populations. d Immunofluorescence labeling for Krt20 and E-Cadherin in tissue from untreated mice (scale bar = 100 µm). e Confocal microscopy images of colon tissue from Krt20CreErt2/Rosa-26tdTomato mice, showing Krt20 lineage tracing for 24 h, 27 h, and 28 days induced by a single dose of tamoxifen (scale bar = 50 µm). f Confocal microscopy images from whole mounts of the colon from Krt20CreErt2/Rosa26-tdTomato mice either untreated or treated with 1.5% or 2% DSS. A single dose of tamoxifen was injected into the animals on the last day of DSS treatment. Lineage tracing and recovery was carried out for 1 month (scale bar = 100 µm). g Quantification of tdTomato-positive crypts from animals shown in f (n = 3 mice per group). h Single-molecule ISH for Krt20 and i single-molecule ISH for Lgr4 in colon tissue of untreated control mice (column 1), mice sacrificed at day 5 of DSS treatment (column 2) and mice treated with DSS and sacrificed after another 5 days of recovery (column 3) (scale bar = 100 µm, n = 3 mice per group). j Violin plot for Lgr4 expression in colon epithelial subpopulation. k t-SNE plot of RNA single-cell sequencing for Lgr4 shows expression in all populations. Data represent mean ± SD, one-way ANOVA, and Dunnett´s test for correction of multiple testing was applied in all cases, *p < 0.05, **p < 0.01, ***p < 0.001, ****p < 0.0001. Scale bar = 100 µm unless indicated otherwise. Source data are provided as a source data file
Fig. 6
Fig. 6
Re-expression of Wnt signaling in surface enterocytes drives epithelial recovery. a, b H&E staining (column 1), single-molecule ISH for Axin2 (column 2) and Lgr5 (column 3) and confocal microscopy images showing aquaporin 8 (column 4) and Ki67 (column 5) protein expression in the colon tissue of untreated control mice a, and mice treated with DSS for 7 days and sacrificed after another 5 days of recovery b. c Average crypt length in colon tissue in control and recovery animals (n = 3 per group). d Quantification of Axin2 signal per image in total, at the surface of crypts and in the base of crypts (n = 4 mice per group). e Quantification of Ki67+ cells per crypt (n = 3 mice in control group, n = 4 mice in recovery group). f Confocal microscopy images of Ki67 and Krt20 co-staining in untreated mice and mice after 5 days DSS treatment. g Quantification of double-positive cells per image (n = 3 mice per group). All experiments were performed in at least three biological replicates. Data represent mean ± SD; Student’s t-test (two-tailed) was applied in all cases. *p < 0.05, **p < 0.01, ***p < 0.001, ****p < 0.0001. Scale bar = 100 µm unless indicated otherwise. Source data are provided as a source data file
Fig. 7
Fig. 7
Stromal Rspo3 expression is increased upon DSS treatment. a single-molecule ISH for Rspo3 in tissue from control animals (row 1) and the corresponding fluorescence image, scale bar = 100 µm. b Single-molecule ISH for Rspo3 in tissue from 7 days DSS-treated animals on day 5 of recovery (row 1) and the corresponding fluorescence image. c Quantification of Rspo3 signal from images of a and b (n = 5 mice from the control and n = 3 mice from the DSS group). d Pseudo-bulk expression of Rspo3 in the stroma cells from mice either treated with DSS or healthy controls, n = 3 mice per group analyzed. e Weight curves of 5 days 1.5% DSS-treated control (n = 5 mice) and Rspo3 KO (n = 6 mice) mice demonstrating weight loss after DSS was discontinued. f H&E staining of control animals and Rspo3 KO animals on day 5 of recovery after 5 days of DSS treatment. g Kaplan–Meier curve of control (n = 5 mice) and Rspo3 KO (n = 6 mice) mice treated with 1.5% DSS for 5 days. Data represent mean ± SD; Student’s t-test (two-tailed) was applied in all cases. *p < 0.05, **p < 0.01, ***p < 0.001, ****p < 0.0001. Scale bar = 100 µm unless indicated otherwise. Source data are provided as a source data file

References

    1. Barker N., van Es J.H., Jaks V., Kasper M., Snippert H., Toftgard R., Clevers H. Very Long-term Self-renewal of Small Intestine, Colon, and Hair Follicles from Cycling Lgr5+ve Stem Cells. Cold Spring Harbor Symposia on Quantitative Biology. 2008;73(0):351–356. doi: 10.1101/sqb.2008.72.003. - DOI - PubMed
    1. Barker N, et al. Identification of stem cells in small intestine and colon by marker gene Lgr5. Nature. 2007;449:1003–1007. doi: 10.1038/nature06196. - DOI - PubMed
    1. Tian Hua, Biehs Brian, Warming Søren, Leong Kevin G., Rangell Linda, Klein Ophir D., de Sauvage Frederic J. A reserve stem cell population in small intestine renders Lgr5-positive cells dispensable. Nature. 2011;478(7368):255–259. doi: 10.1038/nature10408. - DOI - PMC - PubMed
    1. Tetteh PW, et al. Replacement of Lost Lgr5-positive stem cells through plasticity of their enterocyte-lineage daughters. Cell Stem Cell. 2016;18:203–213. doi: 10.1016/j.stem.2016.01.001. - DOI - PubMed
    1. Tomic G, et al. Phospho-regulation of ATOH1. Cell Stem Cell. 2018;23:436–443 e437. doi: 10.1016/j.stem.2018.07.002. - DOI - PMC - PubMed

Publication types

MeSH terms