. 2019 Sep 25;9(1):13825.
doi: 10.1038/s41598-019-50311-z.

Prolonged exposure to simulated microgravity diminishes dendritic cell immunogenicity

Affiliations

Prolonged exposure to simulated microgravity diminishes dendritic cell immunogenicity

Nichole Tackett et al. Sci Rep. .

Abstract

Immune dysfunction due to microgravity remains a hurdle in the next step of human space exploration. Dendritic cells (DC) represent a critical component of immunity, given their role in the detection of invaders and the subsequent task of activating T cells to respond and eliminate the threat. Upon encounter with microbes, DC undergo a process of maturation, whereby the cells upregulate the expression of surface proteins and secrete cytokines, both required for the optimal activation of CD4+ and CD8+ T cells. In this study, DC were cultured from 2-14 days in a rotary cell culture system, which generates a simulated microgravity (SMG) environment, and then the cells were assessed for maturation status and the capacity to activate T cells. Short-term culture (<72 h) of DC in SMG resulted in an increased expression of surface proteins associated with maturation and interleukin-6 production. Subsequently, the SMG exposed DC were superior to Static control DC at activating both CD4+ and CD8+ T cells as measured by interleukin-2 and interferon-γ production, respectively. However, long-term culture (4-14 d) of DC in SMG reduced the expression of maturation markers and the capacity to activate T cells as compared to Static DC controls.


Conflict of interest statement

The authors declare no competing interests.

Figures

Figure 1
Figure 1
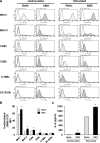
SMG promotes signaling in unstimulated JAWS II DC. Unstimulated JAWS II DC (2 × 10⁵/ml) were cultured in Static (light gray) or SMG (dark gray) conditions in media for 48 h or 72 h. (a) DC were collected after 48 h of culture, permeabilized and then stained with antibodies for pSTAT-5, pERK1/2, p-mTOR and activated caspase-3 and their corresponding isotype controls (open histogram/broken line). GM-CSFR detection was accomplished with antibody in non-permeabilized cells. (b) Graph represents the mean fluorescence intensity (MFI) of each of the molecules examined in (a) for Static (light gray bars) and SMG DC (black bars). One representative experiment of two independent experiments with similar results is shown. (c) Following 72 h of culture in Static (light gray bar) or SMG (black bar) conditions, the cells were enumerated by trypan blue exclusion. Bar graph represents the means of independent cultures (n = 16) + SD of all samples. In (b), *p-value ≤ 0.05 comparing the intracellular and surface expression of molecules by SMG and Static DC. In (c), *p-value ≤ 0.05 comparing the counts of Static and SMG DC.
Figure 2
Figure 2
JAWS II DC undergo maturation when cultured in SMG. (a) Unstimulated and stimulated JAWS II DC (2 × 10⁵/ml) were cultured in Static (light gray) or SMG (dark gray) conditions for 72 h. JAWS II DC activated during Static or SMG culture were either incubated with (stimulated) or without (unstimulated) a cocktail of cytokines (IFN-γ, IL-4 and TNFα). Afterwards, the cells were collected and stained with antibodies for MHC class I and II, CD80, CD86, 4-1BBL and DC-SIGN and their corresponding isotype controls. Open histograms with broken lines represent isotype controls. (b) Graph represents the MFI of each of the surface molecules examined in (a) for unstimulated Static (light gray bars) and SMG JAWS II DC (black bars). (c) Culture supernatants, collected from unstimulated and stimulated JAWS II DC (2 × 10⁵/ml) cultured as in (a), were assessed for IL-6 production by ELISA. One representation of two independent experiments with similar results is shown for (a,b). For (c), the data represents the mean + SD of quadruplicates of two independent experiments. In (b), *p-value ≤ 0.05 comparing the expression of surface molecules by SMG and Static JAWS II DC. In (c), *p-value ≤ 0.05 comparing the production of IL-6 by unstimulated and stimulated SMG to Static JAWS II DC.
Figure 3
Figure 3
SMG upregulates maturation markers of BMDC. Freshly isolated BMDC were cultured in Static (light gray) or SMG (dark gray) conditions for 48 hours and assessed for the expression of the maturation markers, MHC class I, CD40 and CD86, by flow cytometry. The bar graph represents the MFI of each of the surface molecules examined for Static (light gray bars) and SMG (black bars) BMDC. The data represents the mean + SD of quadruplicates of two independent experiments. In the right panel, *p-value ≤ 0.05 comparing the expression of surface molecules by SMG and Static BMDC.
Figure 4
Figure 4
SMG DC are more effective in the activation of antigen-specific T cells than Static DC. JAWS II DC or BMDC (2 × 10⁵/ml) were cultured in Static (white and gray bars) or SMG (black bar) conditions for 72 and 48 hours, respectively. Some JAWS II DC (+cytokines) were incubated with a cocktail of cytokines (IFN-γ, IL-4 and TNFα) 6 hours prior to harvest. Subsequently, Static and SMG JAWS II DC were washed and incubated (1 × 10⁴/well) with OT-II CD4+ TCH (5 × 10⁴/well) and (a) OVA323-339 or (b) OVA protein for an additional 24 hours in Static conditions. Culture supernatants were collected and assessed for IL-2 production by ELISA. Wells containing Static or SMG JAWS II DC and OT-II TCH without OVA323-339 or OVA protein were not included in the figure and yielded 0 cytokine upon assessment. (c) OT-I CD8+ T cells (5 × 10⁴/well) were added to Static and SMG BMDC (1 × 10⁴/well) with or without OVA257-264 for 24 hours in Static conditions. Culture supernatants were collected and the production of IFN-γ determined by ELISA. For all panels, the data represents the mean + SD of quadruplicates of two independent experiments. In (a,b), *p-value ≤ 0.05 comparing the activation of T cell IL-2 production by SMG and Static JAWS II DC as well as SMG and Static JAWS II DC (+cytokines). In (c), *p-value ≤ 0.05 comparing the activation of T cell IFN-γ production by SMG and Static BMDC, both including OVA257-264.
Figure 5
Figure 5
Long-term culture in SMG reduces the T cell stimulatory capacity of JAWS II DC. (a) JAWS II cells (2 × 10⁵/ml) were cultured in Static (light gray) or SMG (dark gray) conditions for 5 days. DC were collected and stained with antibodies for MHC class I and II, CD80 and CD86 and their corresponding isotype controls. Open histograms with broken lines represent isotype controls. (b) Graph represents the MFI of each of the surface molecules examined in (a) for Static (light gray bars) and SMG JAWS II DC (black bars). (c) JAWS II DC (2 × 10⁵/ml) were cultured in Static (light gray bars) or SMG (black bars) conditions for 7, 12 and 14 days. At each time point, Static and SMG JAWS II DC were harvested, washed and incubated with OT-II CD4+ TCH and OVA323-339 for an additional 24 hours in Static conditions. Culture supernatants were collected and assessed for IL-2 production by ELISA. One representative experiment of two independent experiments with similar results is shown for (a). The data in (b) represents the mean + SD of quadruplicates of two independent experiments. In (b), *p-value ≤ 0.05 comparing the expression of surface molecules by Static and SMG JAWS II DC. In (c), *p-value ≤ 0.05 comparing the activation of T cell IL-2 production by day 12 SMG and day 14 SMG JAWS II DC as well as day 14 Static and SMG JAWS II DC.
Figure 6
Figure 6
JAWS II DC can activate T cells within SMG but demonstrate a reduced capacity to capture and/or present antigens in long-term cultures. JAWS II DC (2 × 10⁵/ml) were cultured in Static (white and light gray bars) or SMG (dark gray and black bars) conditions for 72 hours. (a) Afterward, Static and SMG cultured JAWS II DC were harvested, washed and incubated with OT-II CD4+ TCH and OVA323-339 for an additional 24 hours in either Static or SMG conditions (10 ml total volume). (b) Harvested Static and SMG cultured JAWS II DC were refreshed with media and incubated with OT-II CD4+ TCH and OVA protein for an additional 24 hours in either Static or SMG conditions as in (a). Culture supernatants were collected and assessed for IL-2 production by ELISA. For (a,b), data represents the mean + SD of n = 10 and n = 6, respectively, of two independent experiments. In (a), *p-value ≤ 0.05 comparing the activation of T cell IL-2 production by SMG and Static DC in Static conditions as well as SMG and Static DC in SMG conditions. In (b), *p-value ≤ 0.05 comparing the activation of T cell IL-2 production by Static and SMG DC in SMG conditions.

References

    1. Crucian B, et al. A case of persistent skin rash and rhinitis with immune system dysregulation onboard the International Space Station. J. Allergy Clin Immunol Pract. 2016;4:759–762. doi: 10.1016/j.jaip.2015.12.021. - DOI - PubMed
    1. Cogoli A. The effect of space flight on human cellular immunity. Environ. Med. 1993;37:107–116. - PubMed
    1. Sonnenfeld G. Effect of space flight on cytokine production. Acta Astronaut. 1994;33:143–147. doi: 10.1016/0094-5765(94)90119-8. - DOI - PubMed
    1. Guéguinou N, et al. Could spaceflight-associated immune system weakening preclude the expansion of human presence beyond Earth’s orbit? J. Leukoc. Biol. 2009;86:1027–1038. doi: 10.1189/jlb.0309167. - DOI - PubMed
    1. Crucian BE, et al. Immune system dysregulation during spaceflight: potential countermeasures for deep space exploration missions. Front. Immunol. 2018;9(1437):1–21. - PMC - PubMed

Publication types