. 2019 Sep 25;9(1):13877.
doi: 10.1038/s41598-019-50455-y.

Synergy between B cell receptor/antigen uptake and MHCII peptide editing relies on HLA-DO tuning

Affiliations

Synergy between B cell receptor/antigen uptake and MHCII peptide editing relies on HLA-DO tuning

Wei Jiang et al. Sci Rep. .

Abstract

B cell receptors and surface-displayed peptide/MHCII complexes constitute two key components of the B-cell machinery to sense signals and communicate with other cell types during antigen-triggered activation. However, critical pathways synergizing antigen-BCR interaction and antigenic peptide-MHCII presentation remain elusive. Here, we report the discovery of factors involved in establishing such synergy. We applied a single-cell measure coupled with super-resolution microscopy to investigate the integrated function of two lysosomal regulators for peptide loading, HLA-DM and HLA-DO. In model cell lines and human tonsillar B cells, we found that tunable DM/DO stoichiometry governs DMfree activity for exchange of placeholder CLIP peptides with high affinity MHCII ligands. Compared to their naïve counterparts, memory B cells with less DMfree concentrate a higher proportion of CLIP/MHCII in lysosomal compartments. Upon activation mediated by high affinity BCR, DO tuning is synchronized with antigen internalization and rapidly potentiates DMfree activity to optimize antigen presentation for T-cell recruitment.


Conflict of interest statement

The authors declare no competing interests.

Figures

Figure 1
Figure 1
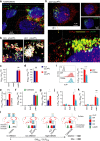
DMfree/CLIPfreq measured in single cells is correlated with DO. (a) Contour plots of flow cytometric analysis (n = 4) of fixed/permeabilized T2 derivatives co-stained with fluorophore-conjugated antibodies specific for DM, DO, DR or CLIP, as indicated. (b) iFACS analysis (n = 3) of fixed/permeabilized T2DR4DMDO cells co-stained as in (a). Heatmap colors scaled to the index FICLIP of individual cells. (c) Index FIs of 3 representative cells as circled in (b) represented by stagger-offset histograms. (d) Comparisons of Index FIDO of individual T2DR4DMDO cells or DMfree/CLIPfreq determined by iFACS for individual cells from CLIPlo and CLIPhi groups. Data include 384 single cells. (e) Comparisons of mean FIDO from single clonal lines or DMfree/CLIPfreq determined by MFIs using flow cytometry for each line (CLIPlo vs CLIPhi). (f,g) Pairwise comparisons (paired t-test) of mean FIDO or DMfree/CLIPfreq or mean FICLIP of each line (indicated by colors) before (Day 0) and after (Day 7) downregulation of DO expression. (h) Overlay of histograms showing the CLIP levels of each line prior to (Day 0) or after (Day 7) downregulation of DO expression. ns: non-significant, p > 0.05; *p < 0.05, **p < 0.01, ****p < 0.0001.
Figure 2
Figure 2
DO tunes DMfree/CLIPfreq in LAMP1+ compartments despite surface display of CLIP. (a) Representative 3D-SIM overlay views of fixed/permeabilized T2DR4DMDO cells co-stained for LAMP1 and CLIP. Cells analyzed (Ncell): 18 CLIPhi and 19 CLIPlo cells in 10 reconstructed 3D images. Experimental replicates (n) = 3. (b) Representative 3D-SIM overlay views of fixed/permeabilized 1C3 or 2D7 cells co-stained for LAMP1, DM and DO (see also Supplementary Fig. 2). n = 3. (c) Comparison of %DO co-localized with the indicated endosomal marker in 1C3 and 2D7 cells. Ncell (from left to right): 13, 8, 16, 15, 14, 16. (d) Comparison of %DO co-localized with DM in 1C3 and 2D7 cells. Ncell: 25, 21. (e) Flow cytometric analysis (n = 4) of fixed/permeabilized 1C3, 2D7, or T2DR4DM cells co-stained for DM and DO. The ratio of mean FIDO to mean FIDM for each cell line was normalized to that for 2D7 cells. (f) Comparison of %DM co-localized with the indicated marker in 1C3 and 2D7 cells. Ncell: 13, 8, 4, 12, 18, 21, 14, 18, 14. (g) Comparison %DM co-localized with DO in 1C3 and 2D7 cells. Ncell: 25, 21. (h) 3D-SIM analysis (n = 3) of fixed/permeabilized 1C3 or 2D7 co-stained for LAMP1 and CLIP. Shown are overlay, single channel, and rotated zoom-in views. (i) Flow cytometric analysis (n = 3) of CLIPsrf (line) and CLIPtot (filled) in T2, 2D7 or T2DR4 cells. MFI of CLIPint = MFI of CLIPtot – MFI of CLIPsrf. (j,k) Comparisons of %CLIP or %DR co-localized with the indicated marker in 2D7 and T2DR4 cells (see also Supplementary Fig. 3). Ncell (same for j,k): 10, 11, 4, 7, 30, 37. (l) The functional correlation between varied levels of DM/DO and their regulation of CLIP removal. Transparency is related to protein levels per cell. Data are represented as mean ± SEM. ns: non-significant, p > 0.05; *p < 0.05, ****p < 0.0001.
Figure 3
Figure 3
Low DMfree/CLIPfreq and high CLIPLAMP1/CLIPtot in memory B cells. (a) Naïve, memory and GC sub-populations sorted from human tonsil B cells and tested for purity. (b) Fixed/permeabilized tonsillar B cell subsets co-stained for DO, DM, DR, and CLIP, and analyzed by flow cytometry (n = 5). Mean FIs was normalized to that for GC B cells. (c) A comparison of DMfree/CLIPfreq determined by iFACS of individual B cells from different sub-populations. Data at each condition include a 96-well plate of single cells from the same donor. Experiments were repeated with equivalent results using cells from three donors. (d) 3D-SIM analysis (n = 3) of fixed/permeabilized B cells co-stained for LAMP1, DM, and DO. (e) Comparisons of %DO or %DM co-localized with the indicated endosomal marker in different subtypes of B cells. #Some GC B cells had almost no DO, although any detectable DO was co-localized with LAMP1 (see also Supplementary Fig. 4). Ncell (from left to right): 7, 13, 13, 21, 19, 15, 20, 14, 16. (f) %DO co-localized with DM in different subtypes of B cells. Ncell: 25, 21. (g) %DM co-localized with DO in different subtypes of B cells. Ncell: 52, 51, 69. (h) 3D-SIM analysis (n = 3) of fixed/permeabilized naïve or memory B cells co-stained for LAMP1 and CLIP. Right panel: an overlay view of the CLIP channel (red) and the calculated LAMP1/CLIP overlapping surface (yellow). (i) Comparisons of %CLIP or %DR co-localized with the indicated endosomal marker in different subtypes of B cells (see also Supplementary Fig. 5). Ncell: 24, 21, 26, 19, 18, 16, 52, 60, 40. (j) An inverse correlation between CLIPLAMP1/CLIPtot and DMfree/CLIPfreq among tonsil B cell sub-populations. Data are represented as mean ± SEM. ns: non-significant, p > 0.05; *p < 0.05, **p < 0.01; ***p < 0.001; ****p < 0.0001.
Figure 4
Figure 4
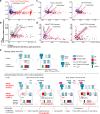
Similar changes of DMfree/CLIPfreq and CLIPLAMP1/CLIPtot in activated memory vs naive B cells rely on different extent of DO downregulation. (a) Flow cytometric analysis of stimulated (filled) or unstimulated (line) cells incubated with or without anti-IgG/anti-IgM Abs, CD40L, IL2, and IL4 for the indicated time and fixed/permeabilized before staining of total CD69. Right panel: MFI fold change of stimulated over unstimulated samples was normalized to that of GC B cells at time 0. n = 3. (b) Cells from 6 donors (indicated by colors) stimulated as in (a) for 2 h and compared with their unstimulated counterparts (paired t-test) for CD69, DO, DM, CLIP and DR using flow cytometric analysis. MFI normalized to that of unstimulated GC B cells. (c) Comparisons of DMfree/CLIPfreq determined by iFACS of individual naïve and memory B cells that were unstimulated or stimulated as in (a) for 2 h. Data at each condition include a 96-well plate of single B cells from the same donor. Experiments were repeated 5 times using cells from three donors. (d) The %increase of average DMfree/CLIPfreq per replication (open symbol) from unstimulated to stimulated naïve vs memory B cells from three donors (indicated by colors) as mentioned in (c). (e) Comparisons of %CLIP co-localized with LAMP1 (CLIPLAMP1/CLIPtot) quantified by 3D-SIM for unstimulated or stimulated naïve vs memory B cells. Ncell: 52, 60, 47, 39. (f) The %decrease of average CLIPLAMP1/CLIPtot per experiment (n = 3) from unstimulated to stimulated naïve vs memory B cells. Data are represented as mean ± SEM. ns: non-significant, p > 0.05; *p < 0.05, **p < 0.01; ****p < 0.0001.
Figure 5
Figure 5
Increases of DMfree/CLIPfreq in DPA attributed to fast GAD65-hIgG internalization and DO downregulation. (a) Flow cytometric analysis of fixed/permeabilized DPA or DPD cells co-stained for total CLIP, DR, DM, and DO. Lines indicate the corresponding unstained cells. n = 3. (b) DPA or DPD cells were incubated with GAD65 on ice followed by detection of surface GAD65 using mouse anti-GAD65 antibodies and analysis by flow cytometry. Lines indicate the corresponding cells without GAD65. n = 3. (c) GAD65-loaded (filled) or GAD65-unexposed (line) DPA (red) or DPD (blue) cells were incubated with (+GAD65) or without (no stimulus) GAD65 at 37 °C for the indicated time before detection of surface GAD65 using mouse anti-GAD65 antibodies or surface hIgG using mouse anti-hIgG antibodies and analysis by flow cytometry. n = 3. (d) Fast internalization of GAD65 and hIgG in DPA cells. Fold change indicates MFI at + GAD65 condition over no stimulus condition as shown in (c). (e) Comparisons of surface GAD65 or surface hIgG fold change between 0 and 20 min of incubation of DPA or DPD cells with GAD65 at 37 °C. n = 4. (f) Comparisons of fold change of total DO, DM, CLIP or DR in GAD65-loaded DPA and DPD cells that were further incubated with GAD65 at 37 °C for 20 min and fixed/permeabilized before flow cytometric analysis. 1 indicates no change. n = 5. (g) Comparisons of DMfree/CLIPfreq determined by iFACS of individual DPA and DPD cells that were incubated without stimulus (no stimulus) or pre-loaded with GAD65 and then incubated with GAD65 ( + GAD65) at 37 °C for 20 min. n = 3. Data at each condition include a 96-well plate of single cells. Data are represented as mean ± SEM. ns: non-significant, p > 0.05; *p < 0.05, **p < 0.01.
Figure 6
Figure 6
The molecular and cellular impact of fine-tuning DM/DO stoichiometry. (ad) Mathematical and catalytic meaning of DMfree/CLIPfreq illustrated by alternative presentation of data shown in Figs 1d, 3c, 4c and 5g, respectively. Each dot represents an individual cell analyzed by iFACS. Single cells from distinct groups are differentiated by colors, as indicated. The slope of a line connecting the origin with each dot equals to DMfree/CLIPfreq in the cell. The line with shaded range indicates mean ± SEM of DMfree/CLIPfreq for the group of cells using the same color-code. (e) Two synchronized affinity checkpoints for antigen presentation in B cells. Ligands with different binding affinities or proteins at different levels per cell are indicated using different degrees of color intensity.

Similar articles

Cited by

References

    1. Adler LN, et al. The Other Function: Class II-Restricted Antigen Presentation by B Cells. Frontiers in immunology. 2017;8:319. doi: 10.3389/fimmu.2017.00319. - DOI - PMC - PubMed
    1. Shulman Z, et al. Dynamic signaling by T follicular helper cells during germinal center B cell selection. Science. 2014;345:1058–1062. doi: 10.1126/science.1257861. - DOI - PMC - PubMed
    1. Yeh CH, Nojima T, Kuraoka M, Kelsoe G. Germinal center entry not selection of B cells is controlled by peptide-MHCII complex density. Nature communications. 2018;9:928. doi: 10.1038/s41467-018-03382-x. - DOI - PMC - PubMed
    1. Cresswell P. Invariant chain structure and MHC class II function. Cell. 1996;84:505–507. doi: 10.1016/S0092-8674(00)81025-9. - DOI - PubMed
    1. Yin L, et al. Susceptibility to HLA-DM protein is determined by a dynamic conformation of major histocompatibility complex class II molecule bound with peptide. J Biol Chem. 2014;289:23449–23464. doi: 10.1074/jbc.M114.585539. - DOI - PMC - PubMed

Publication types

MeSH terms