. 2019 Oct;574(7776):112-116.
doi: 10.1038/s41586-019-1598-0. Epub 2019 Sep 25.

Modelling human hepato-biliary-pancreatic organogenesis from the foregut-midgut boundary

Affiliations

Modelling human hepato-biliary-pancreatic organogenesis from the foregut-midgut boundary

Hiroyuki Koike et al. Nature. 2019 Oct.

Abstract

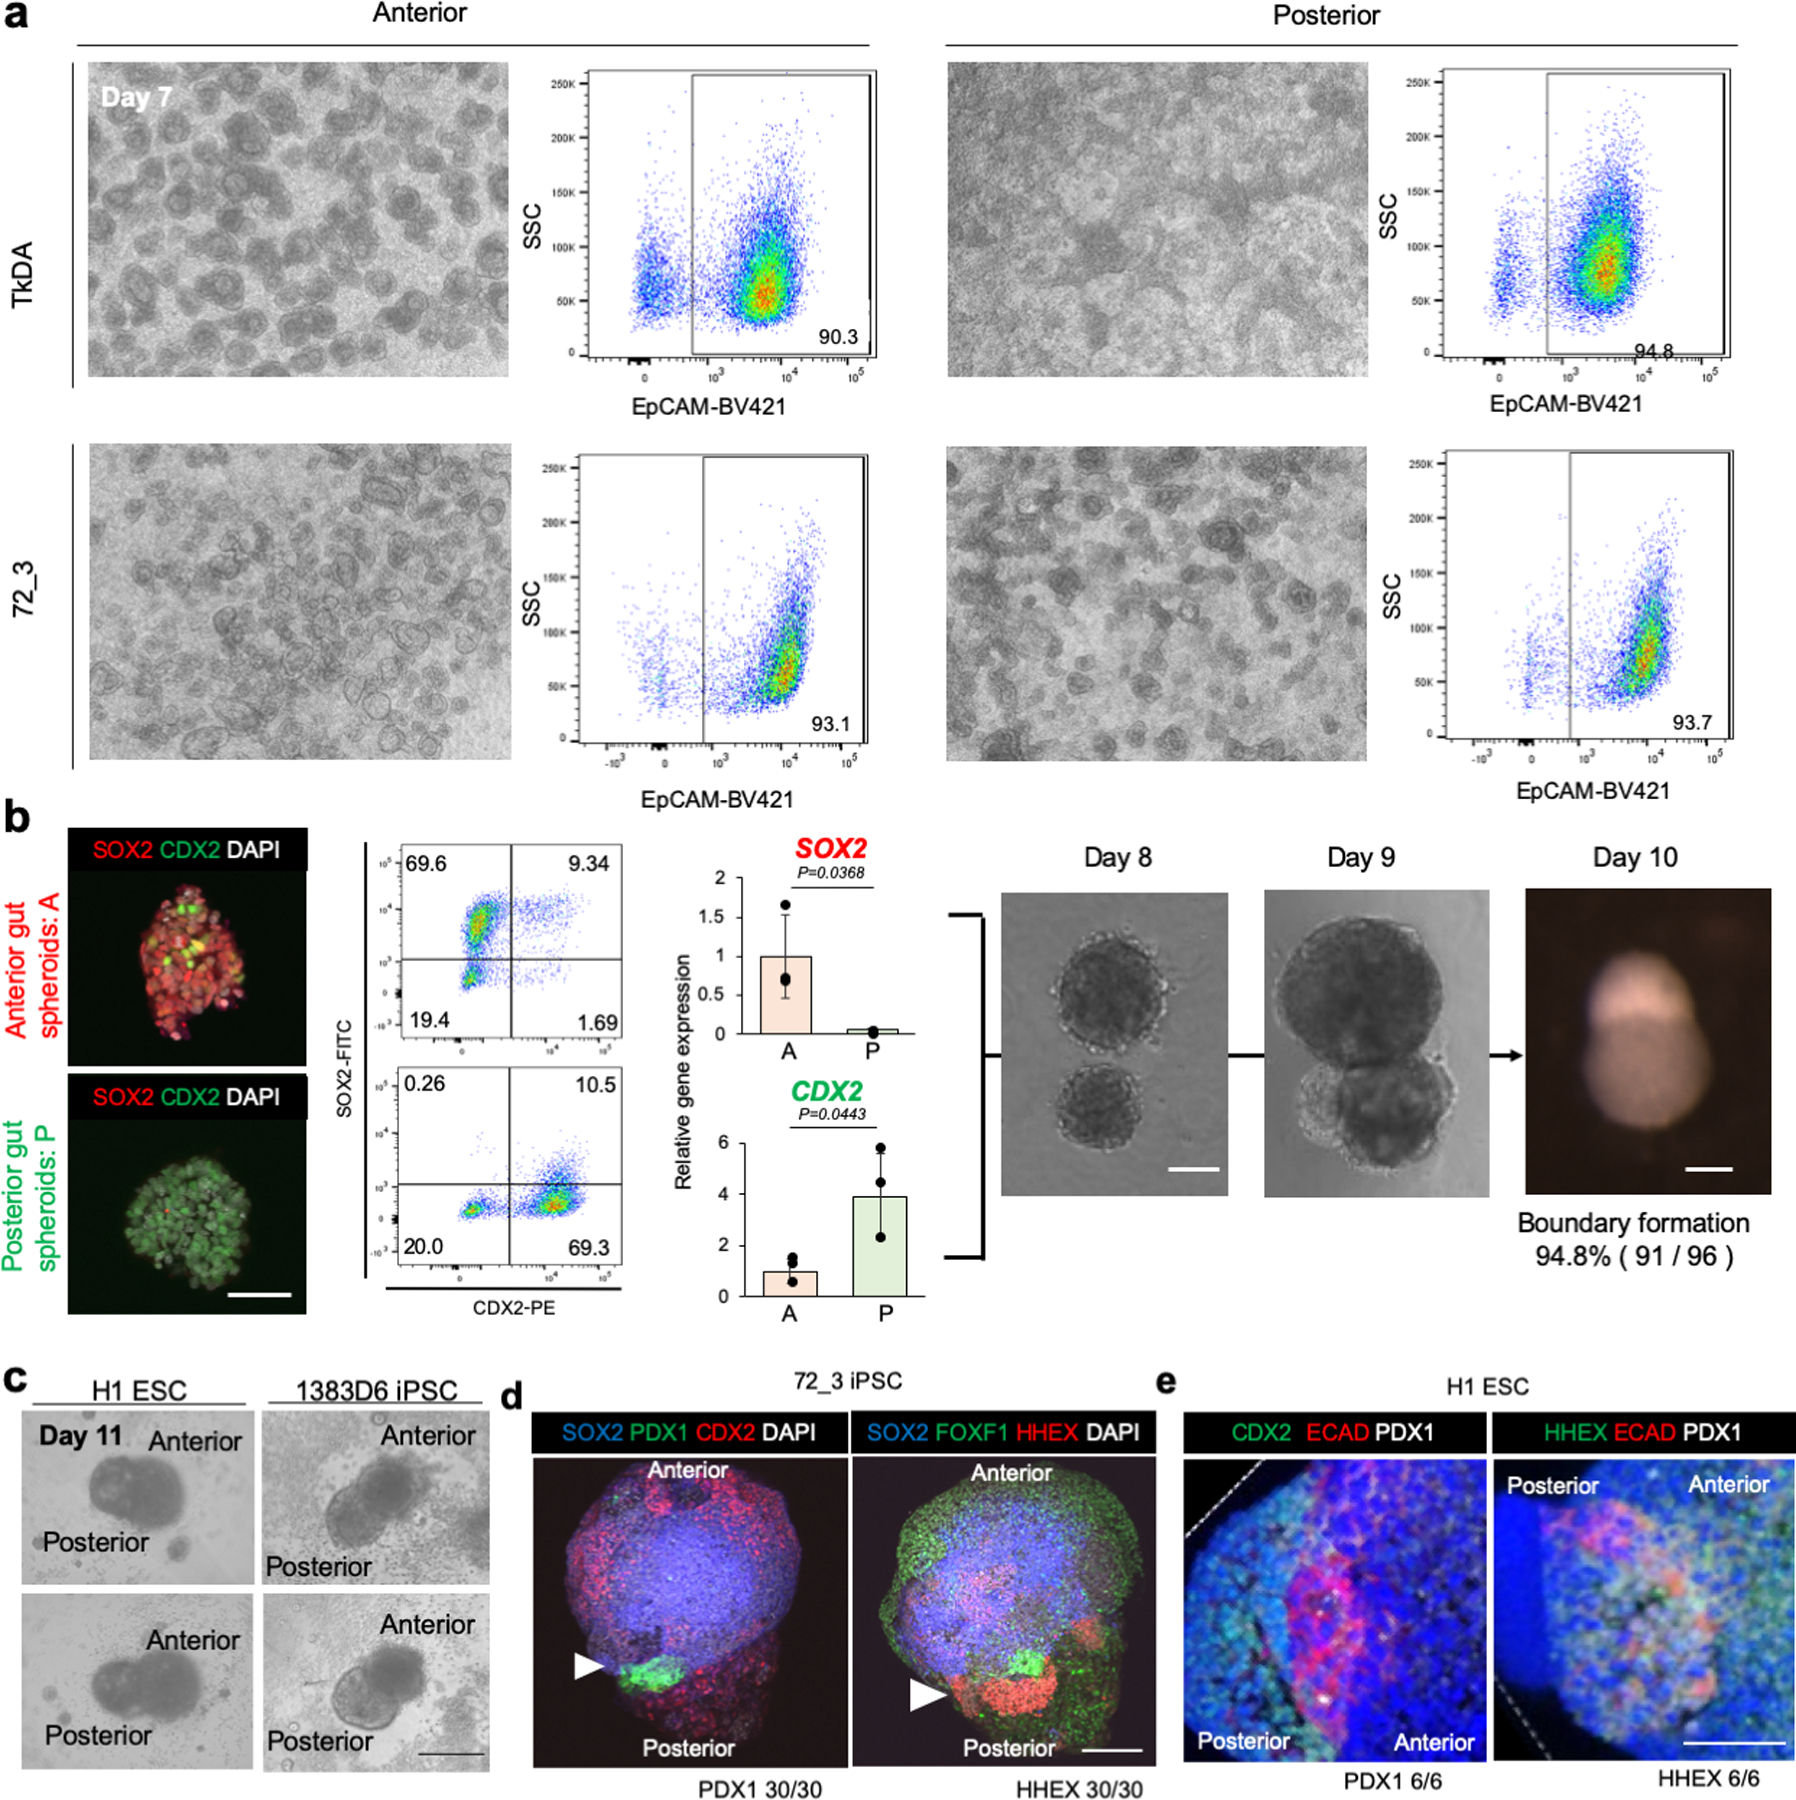
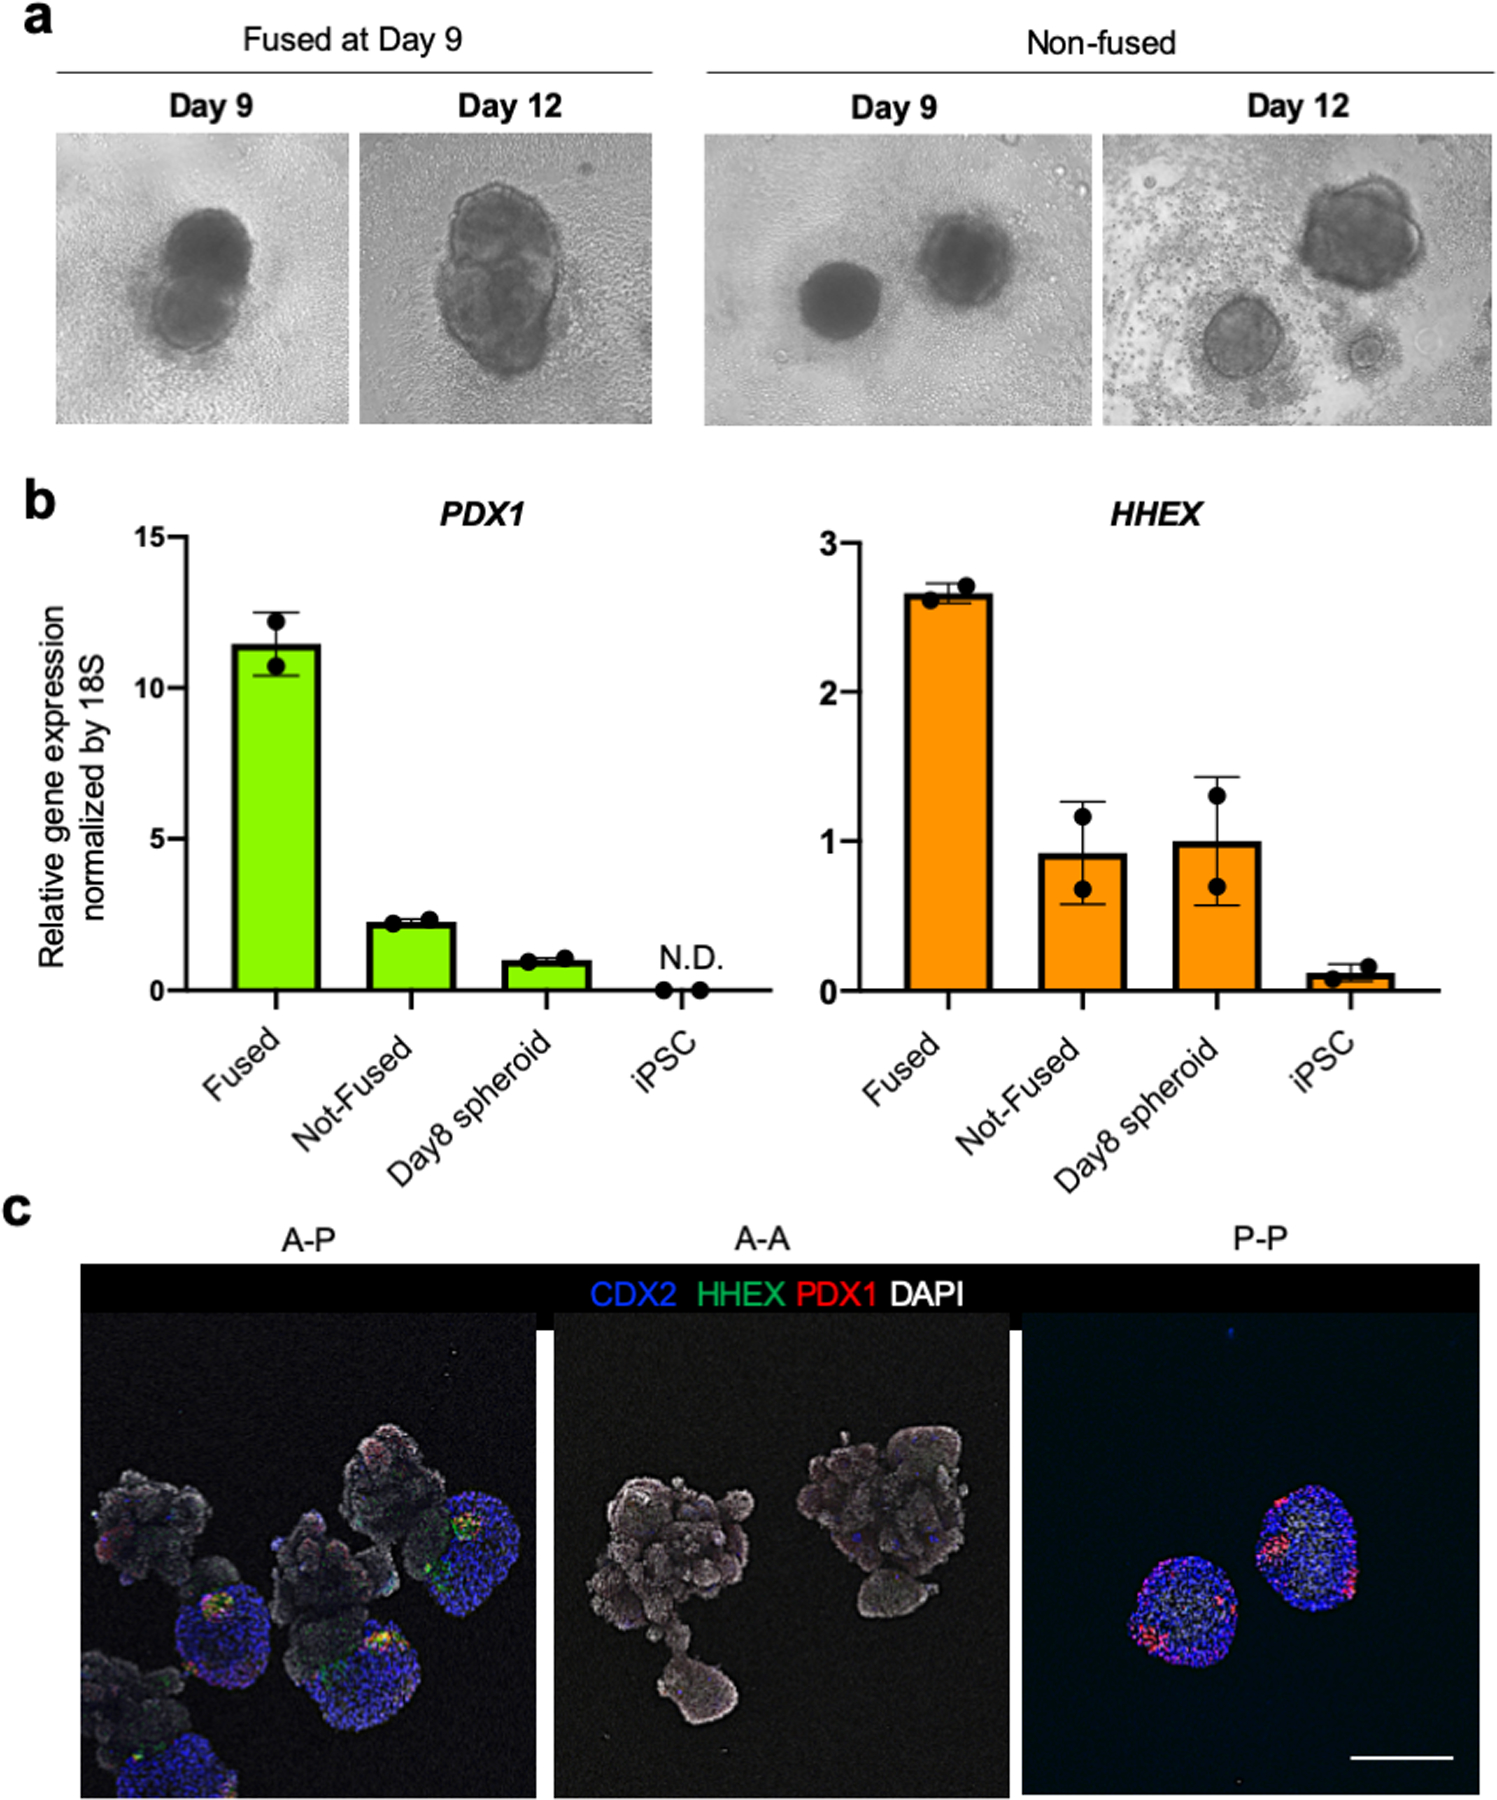
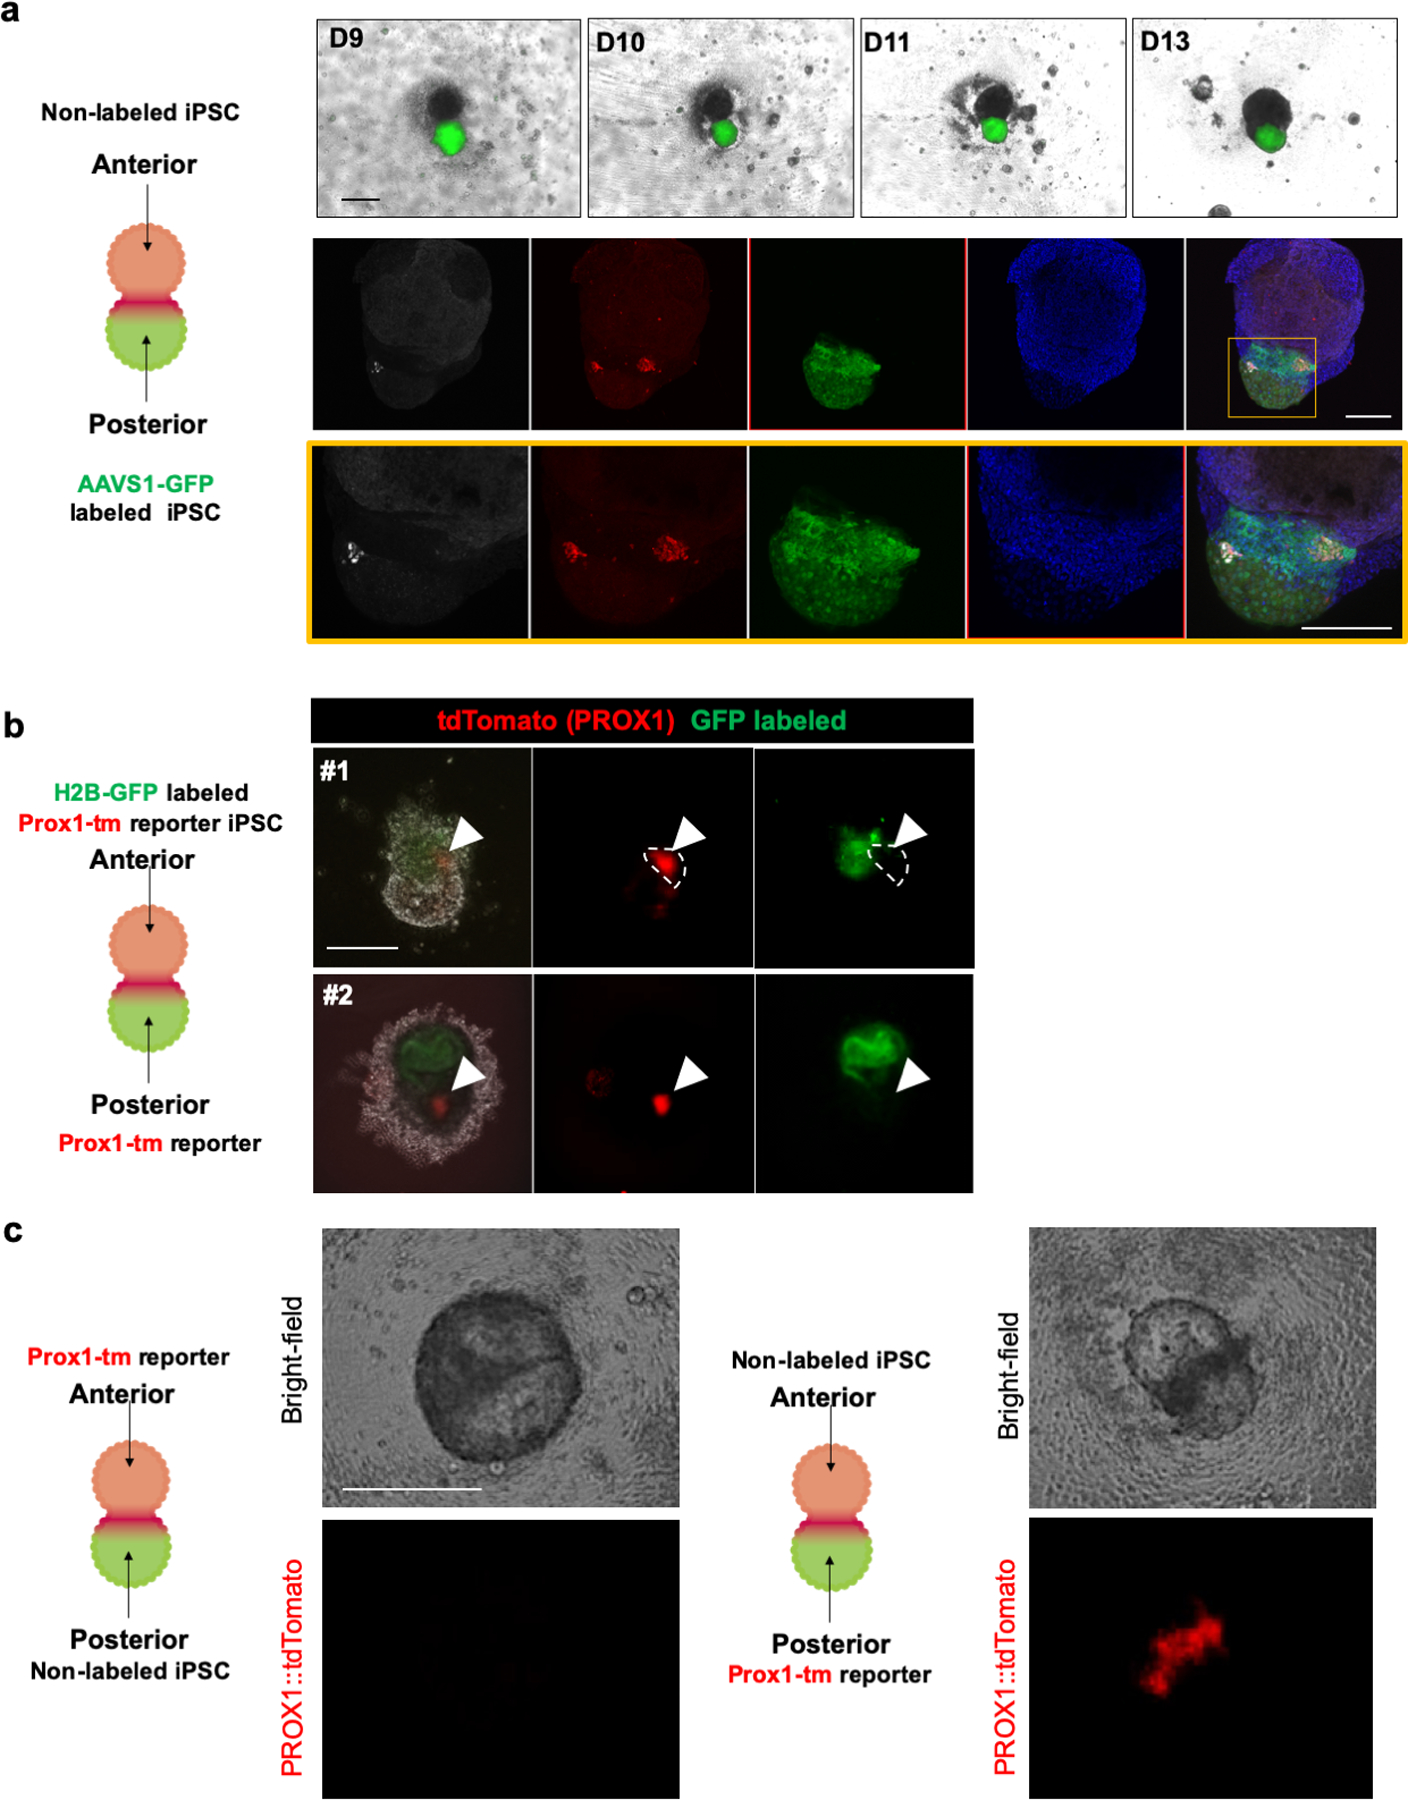
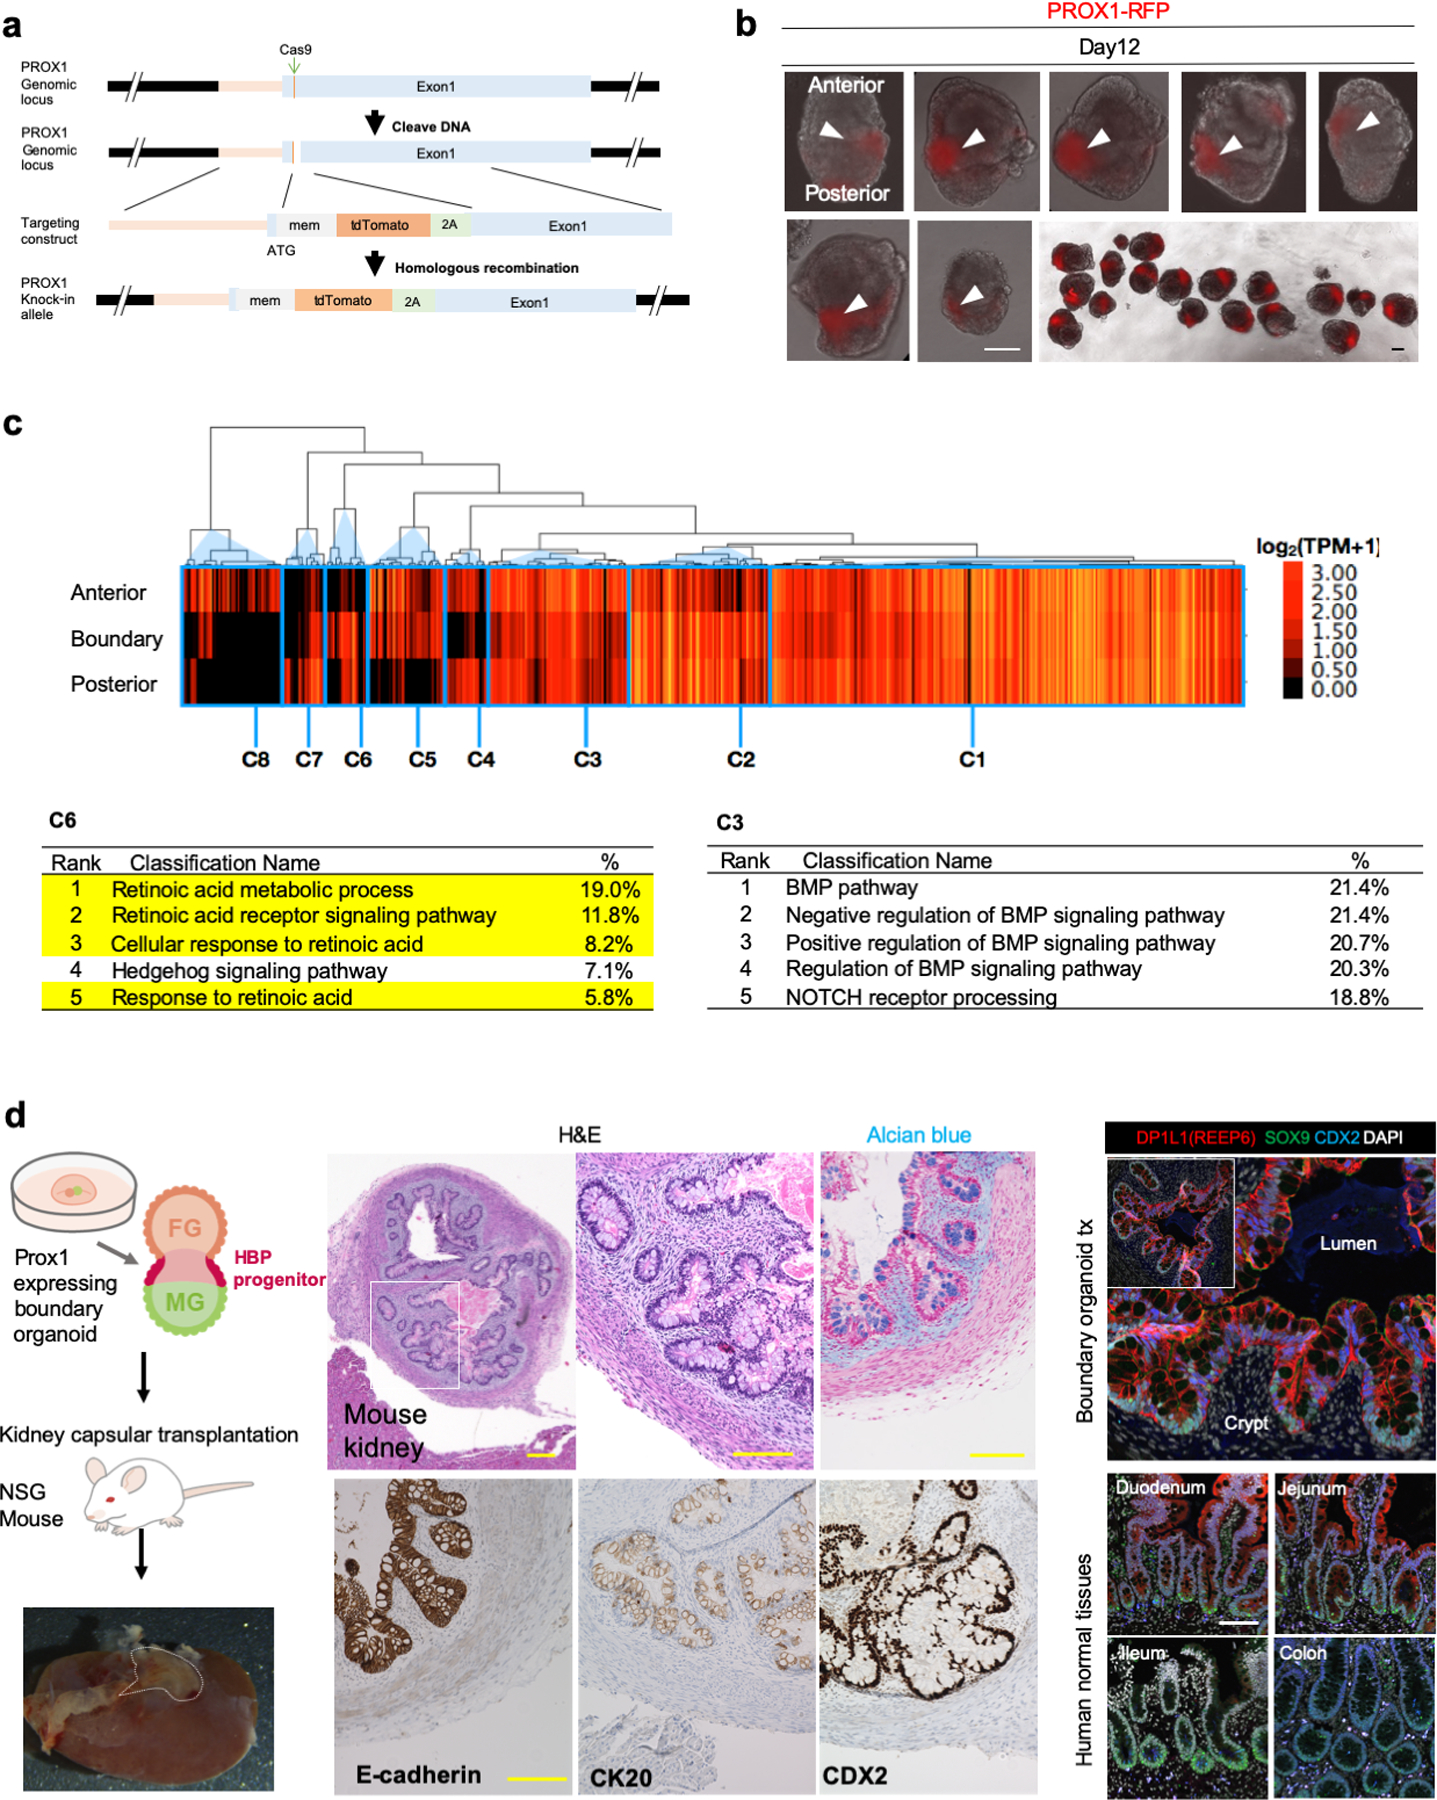
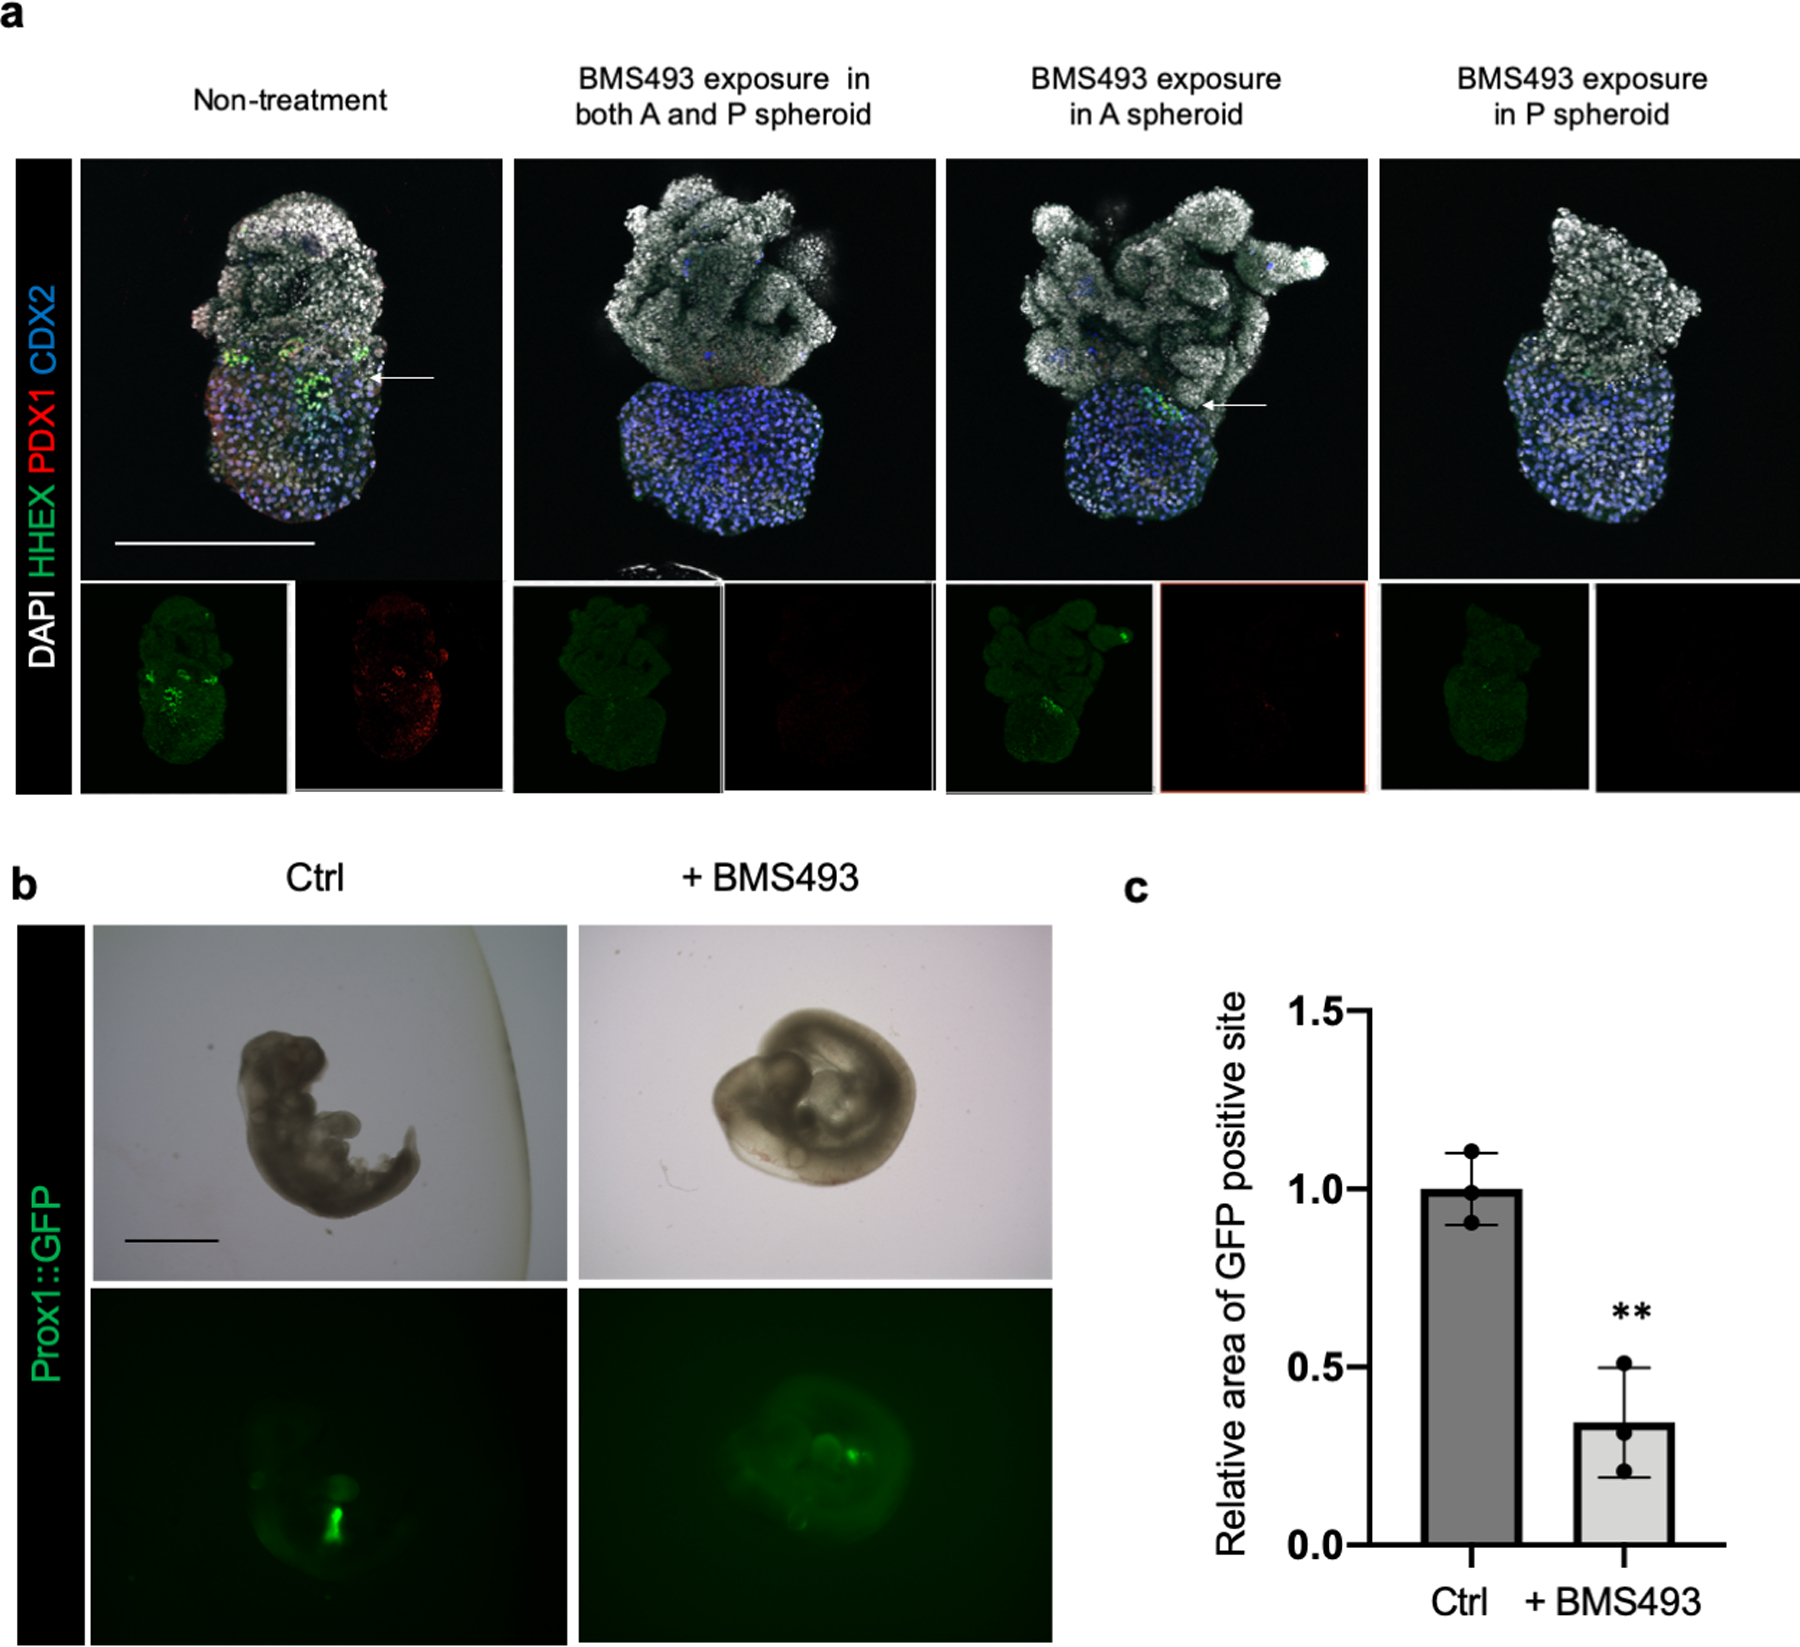
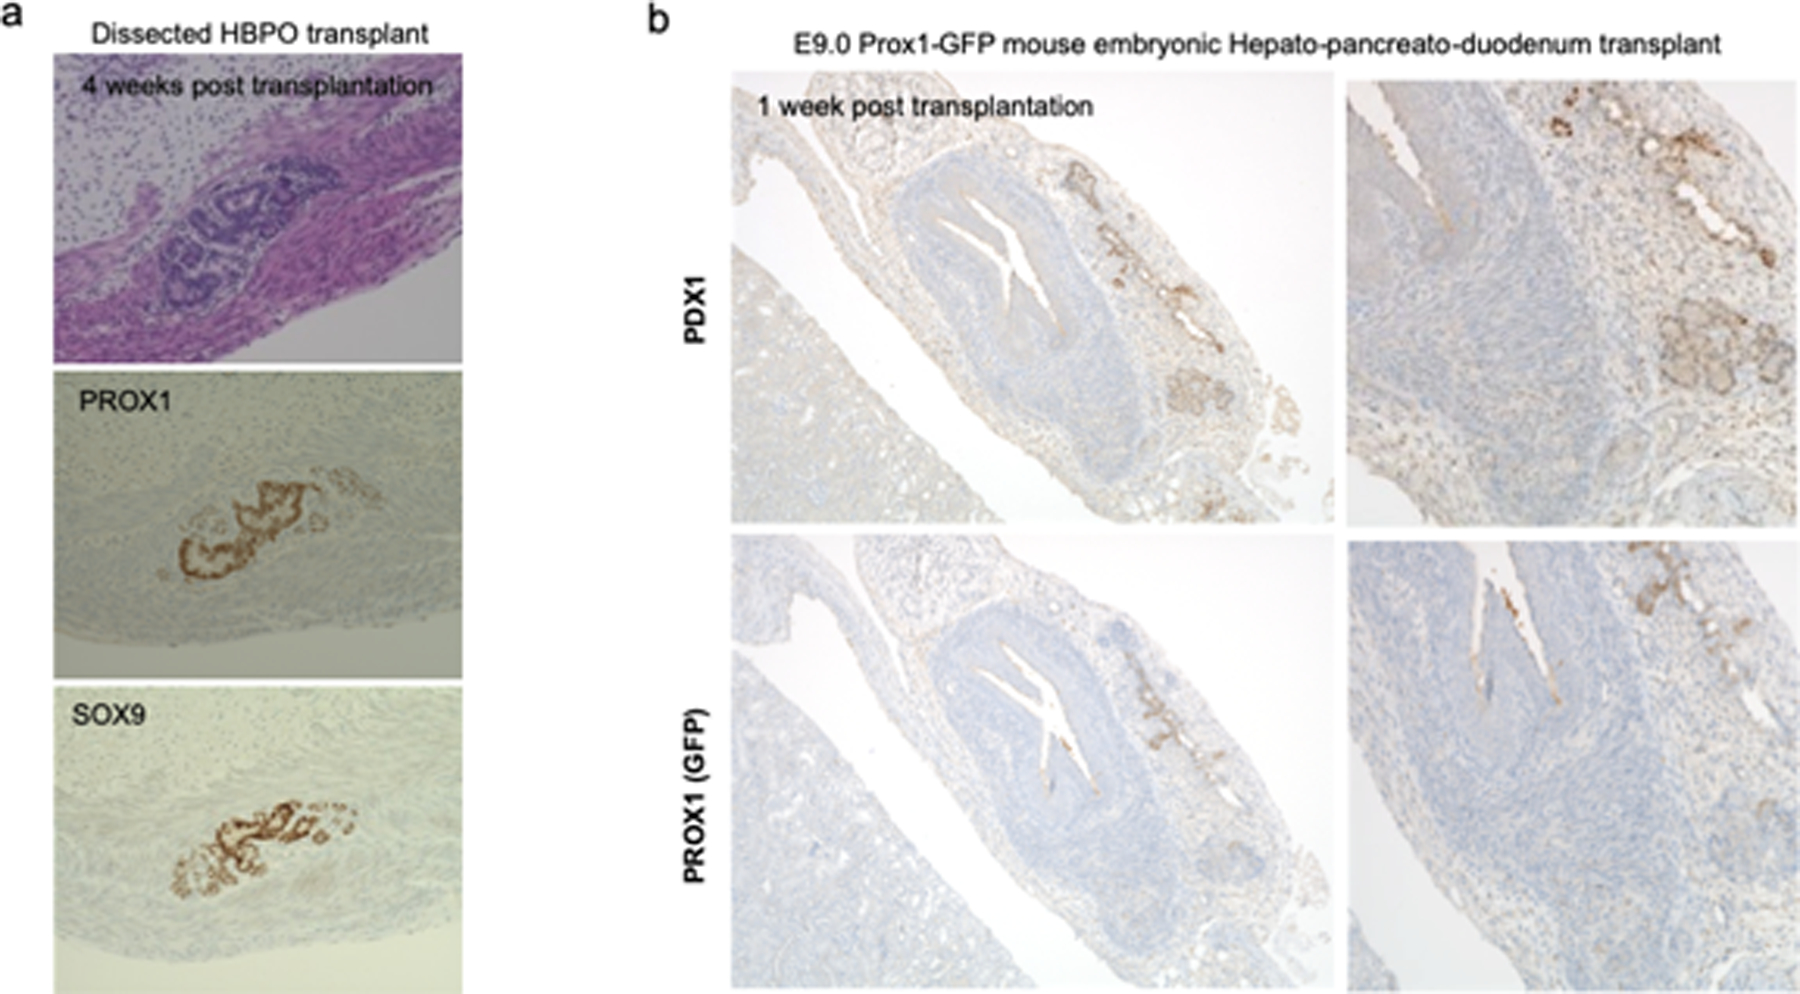
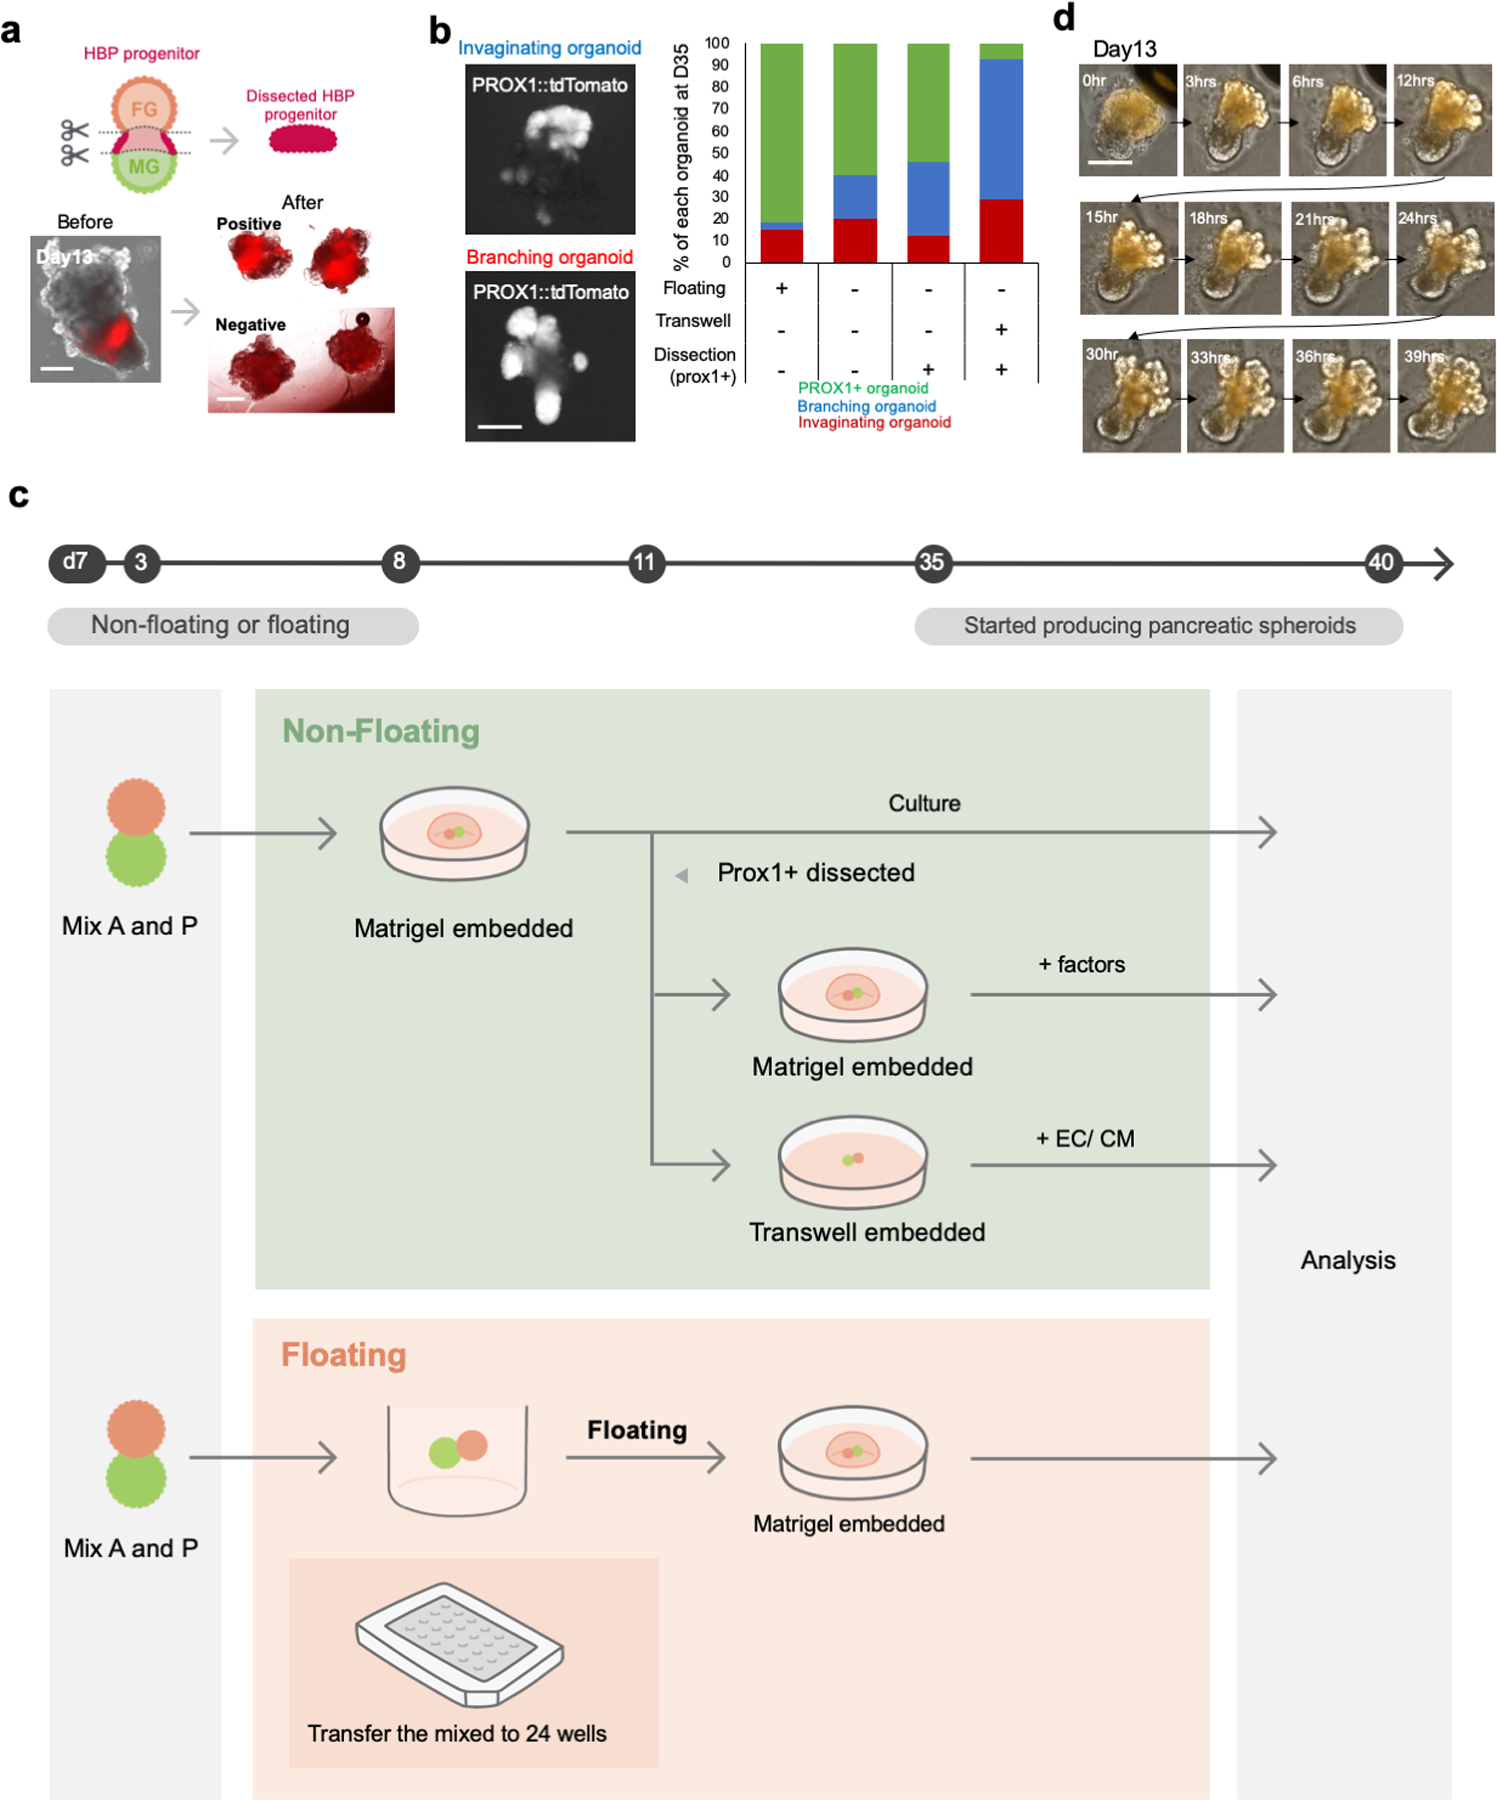
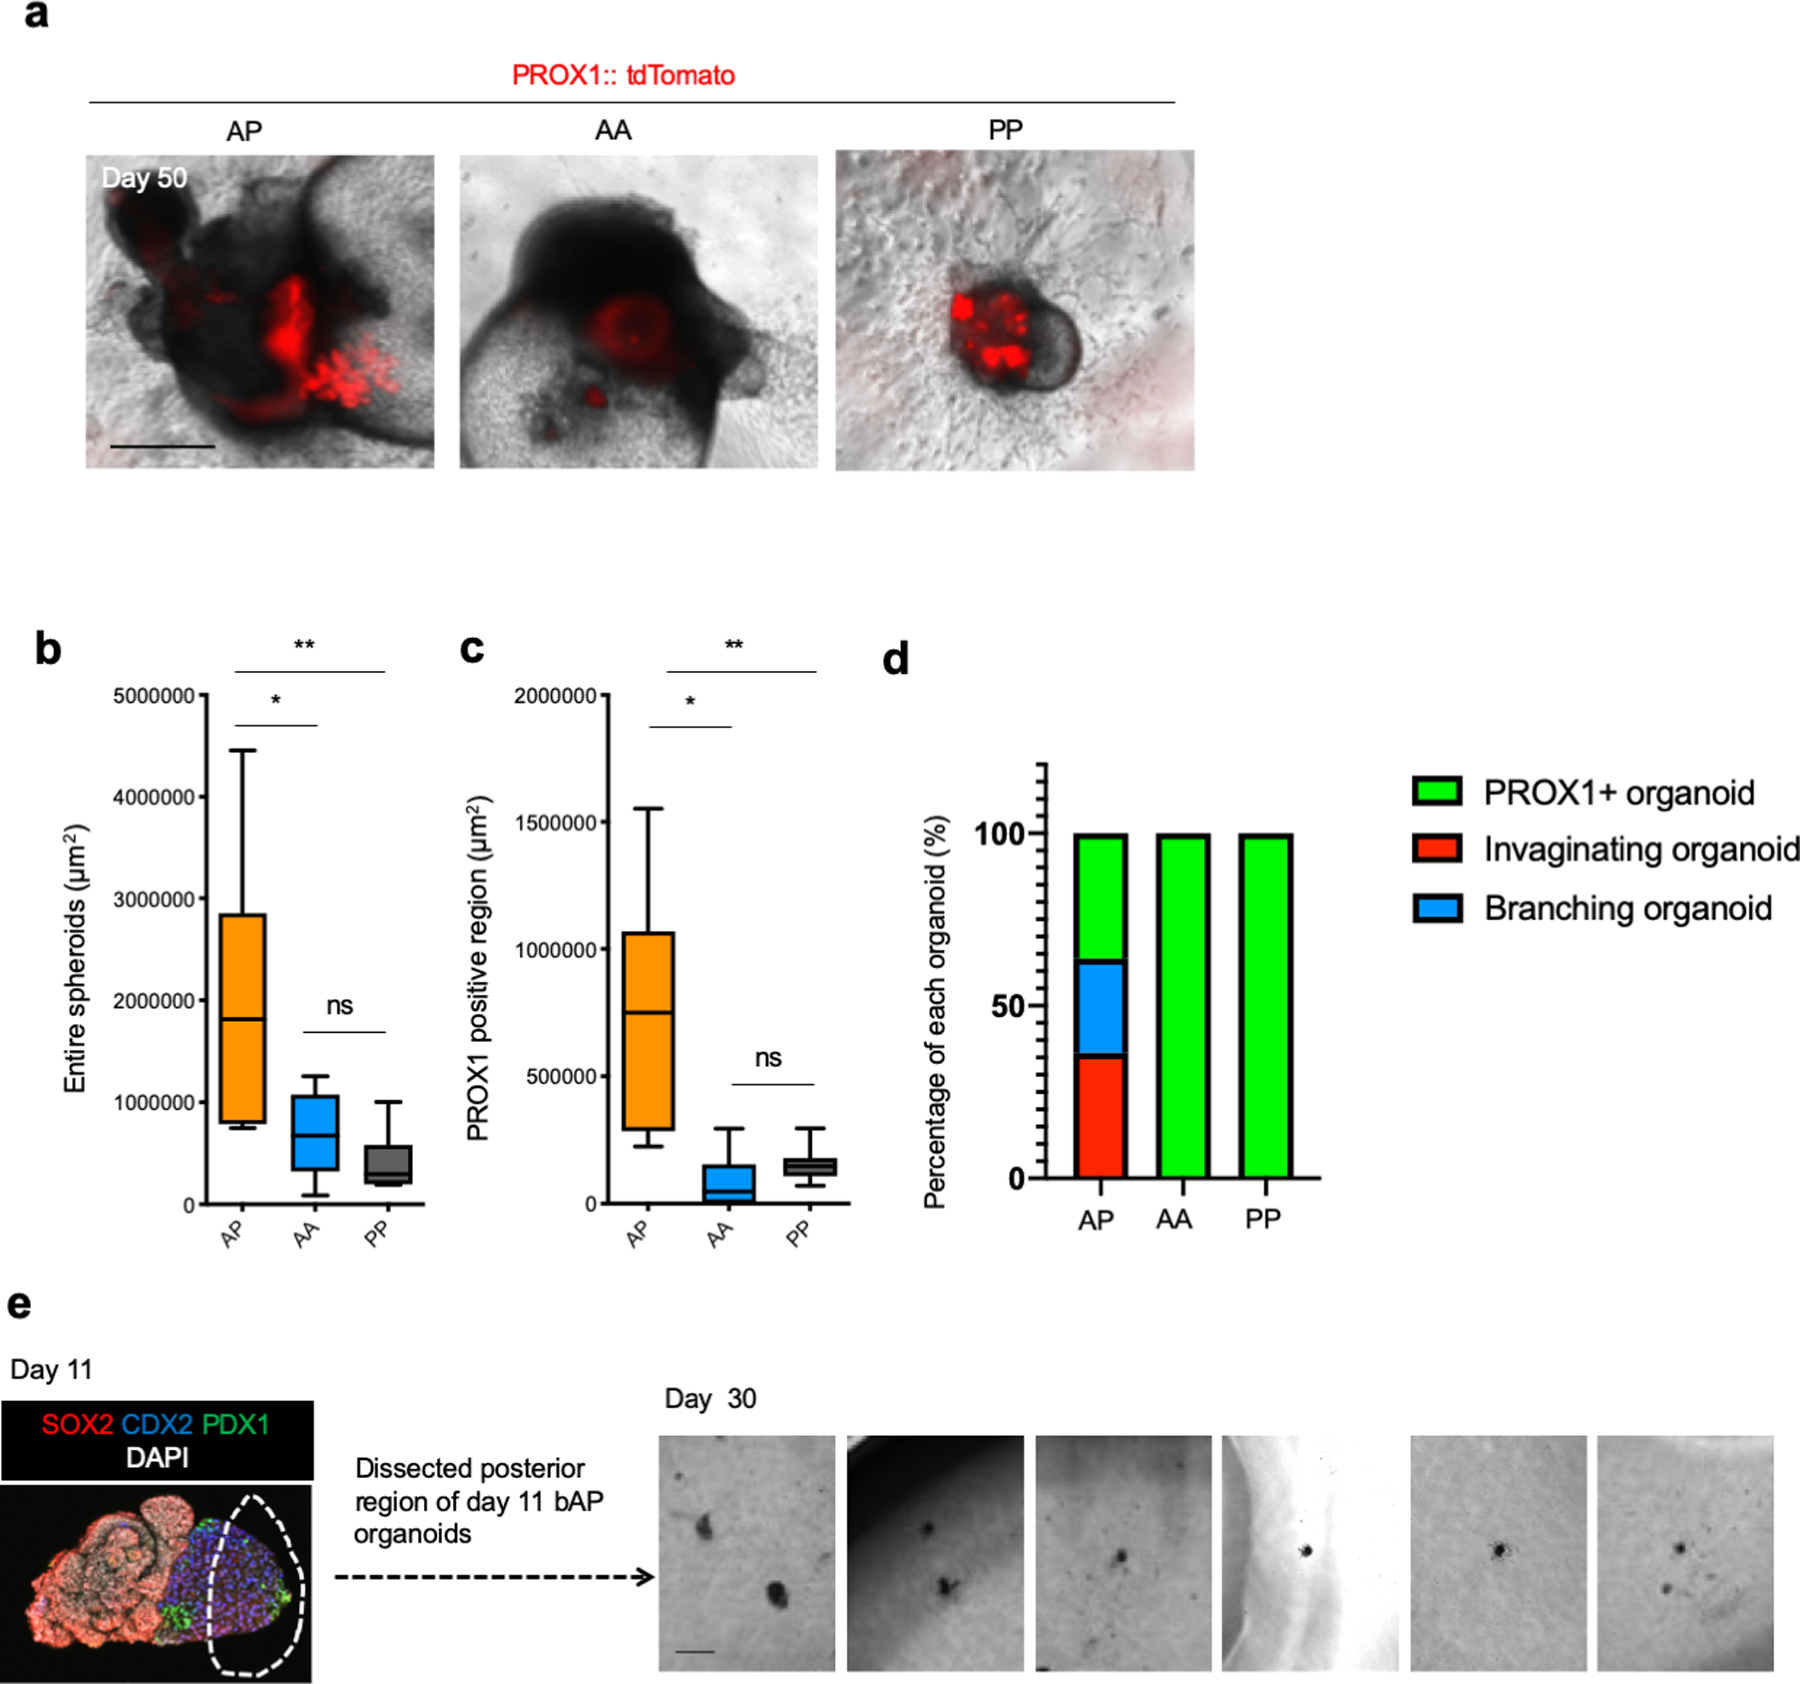
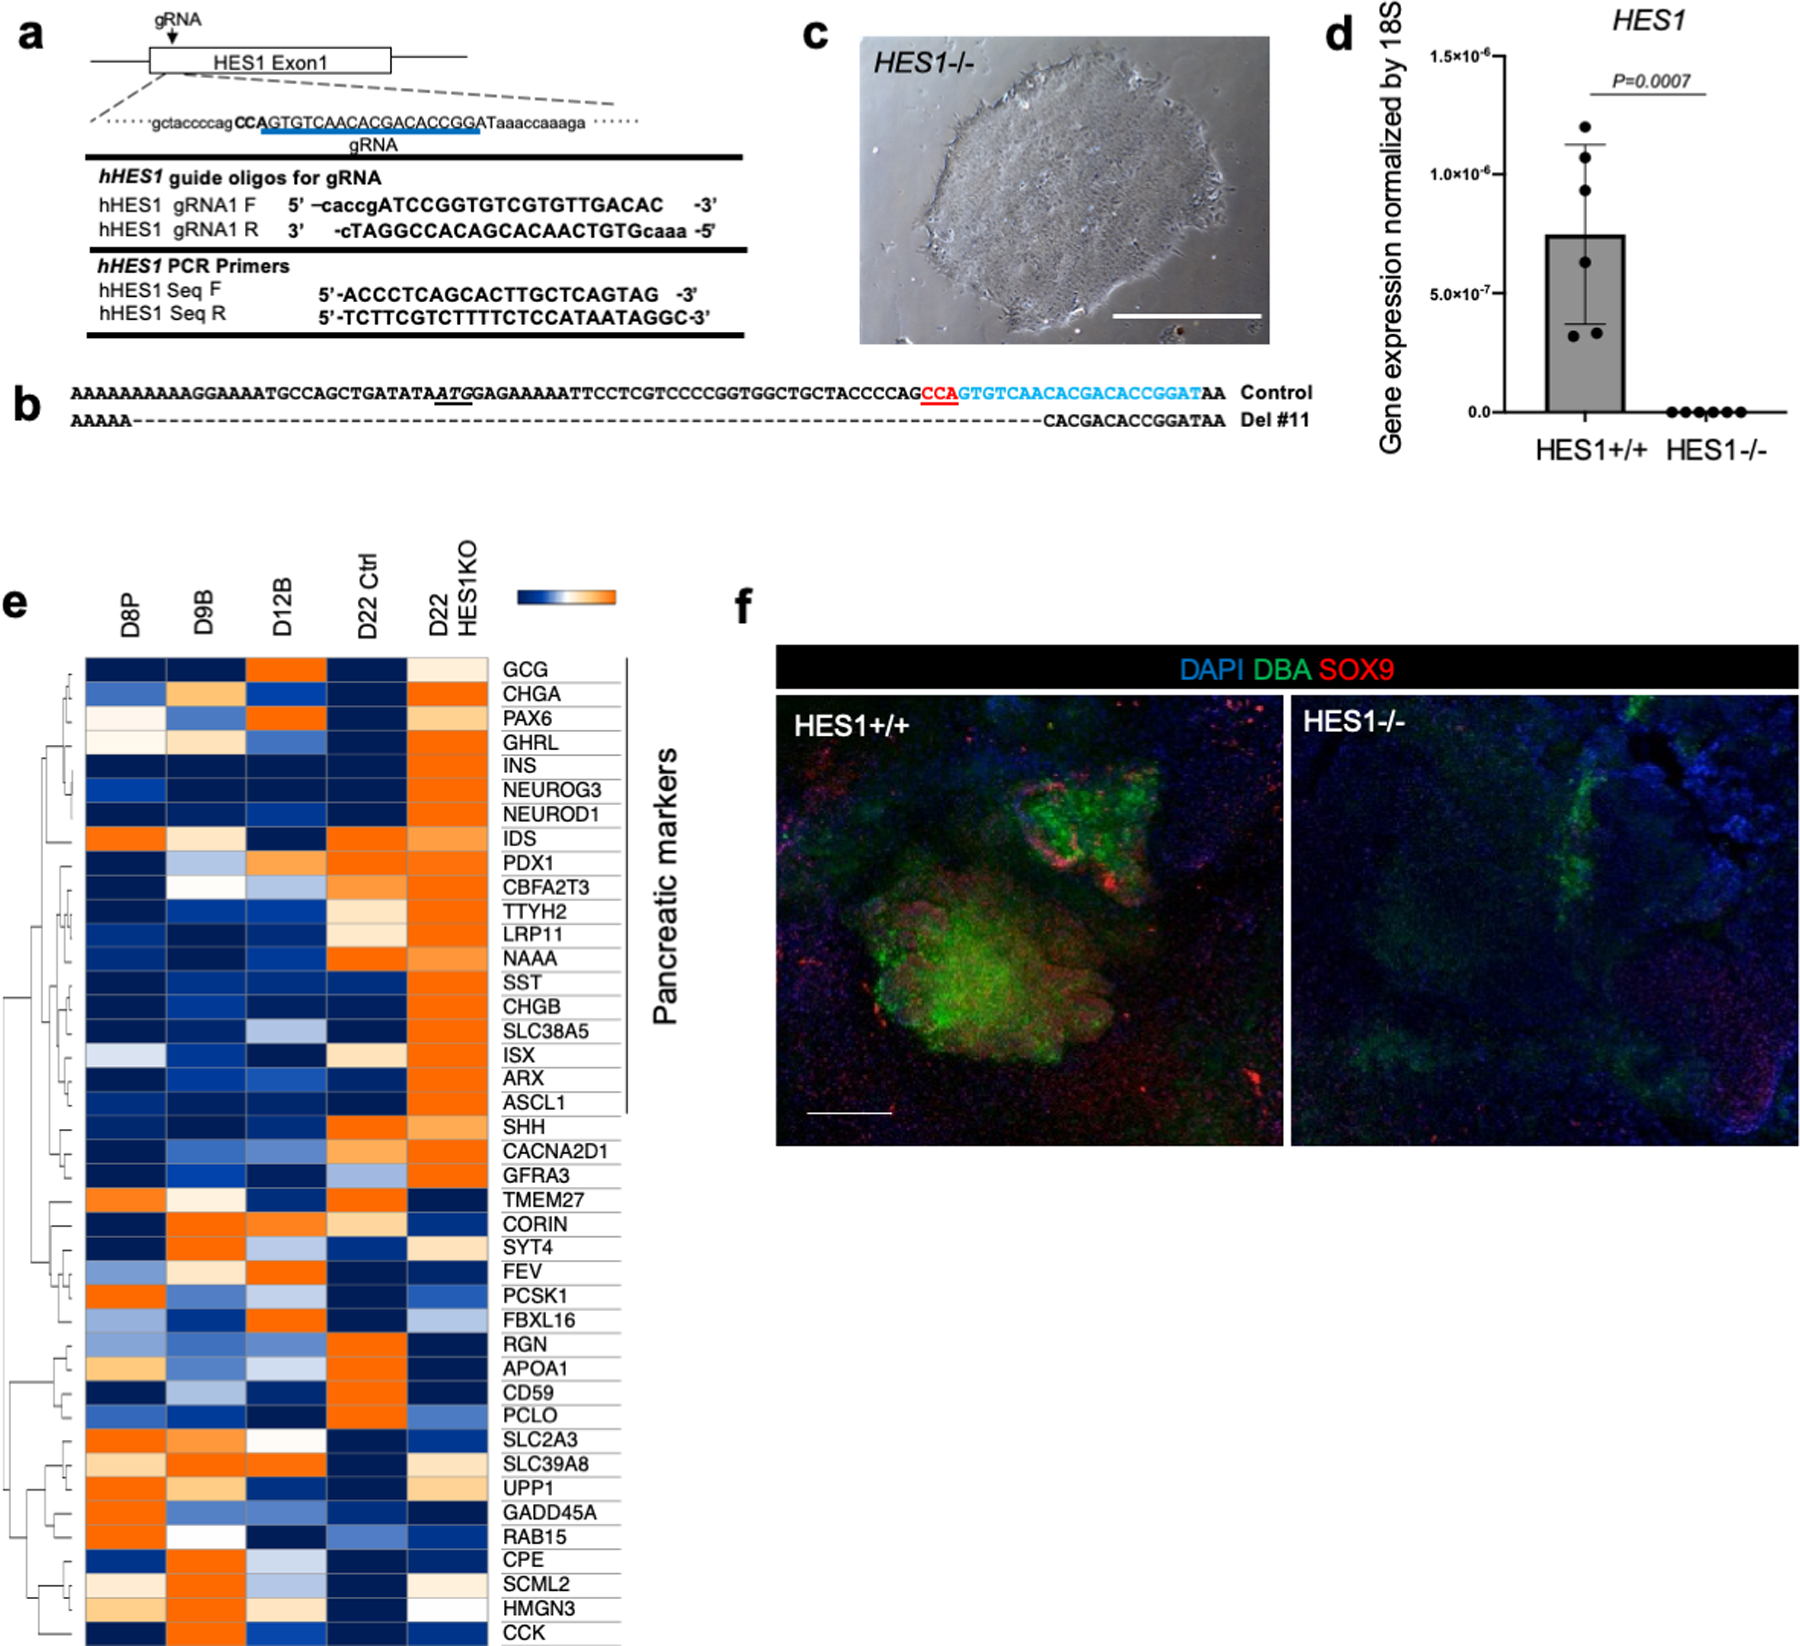
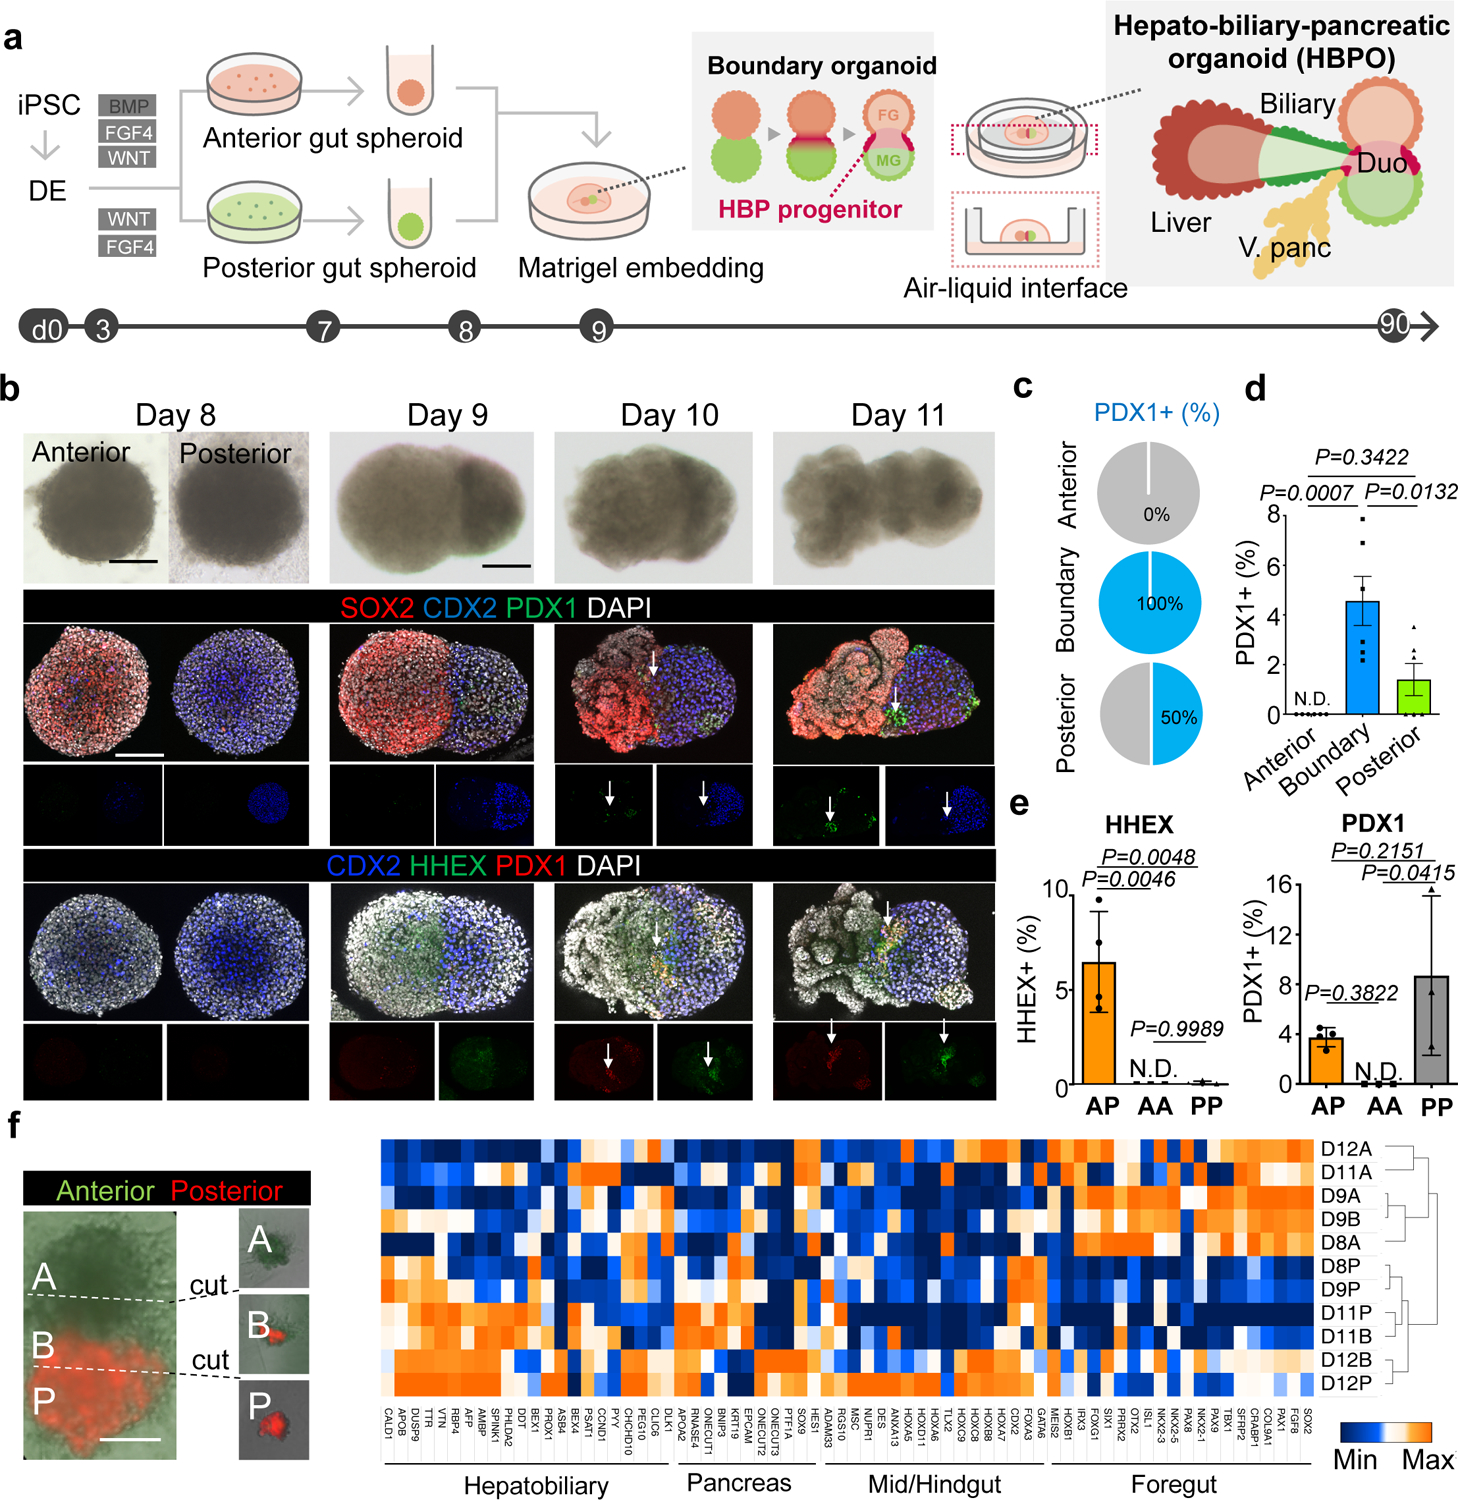
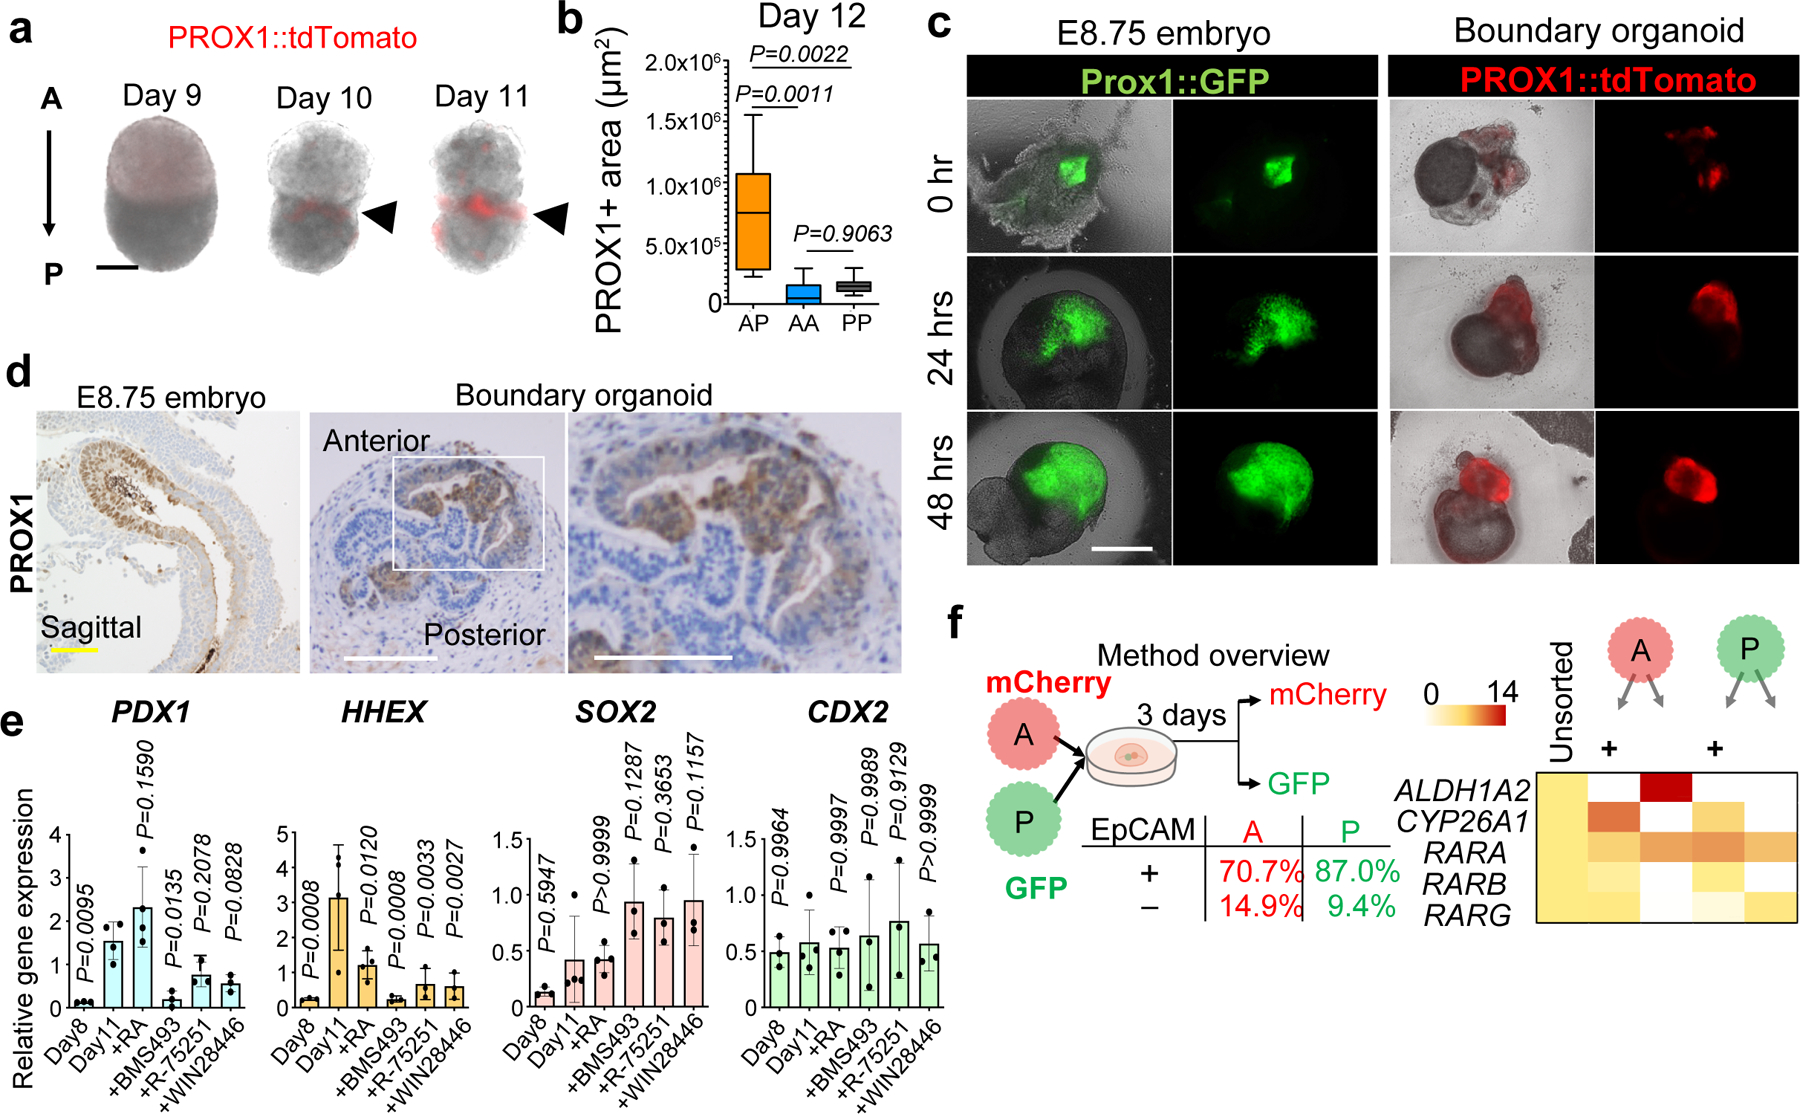
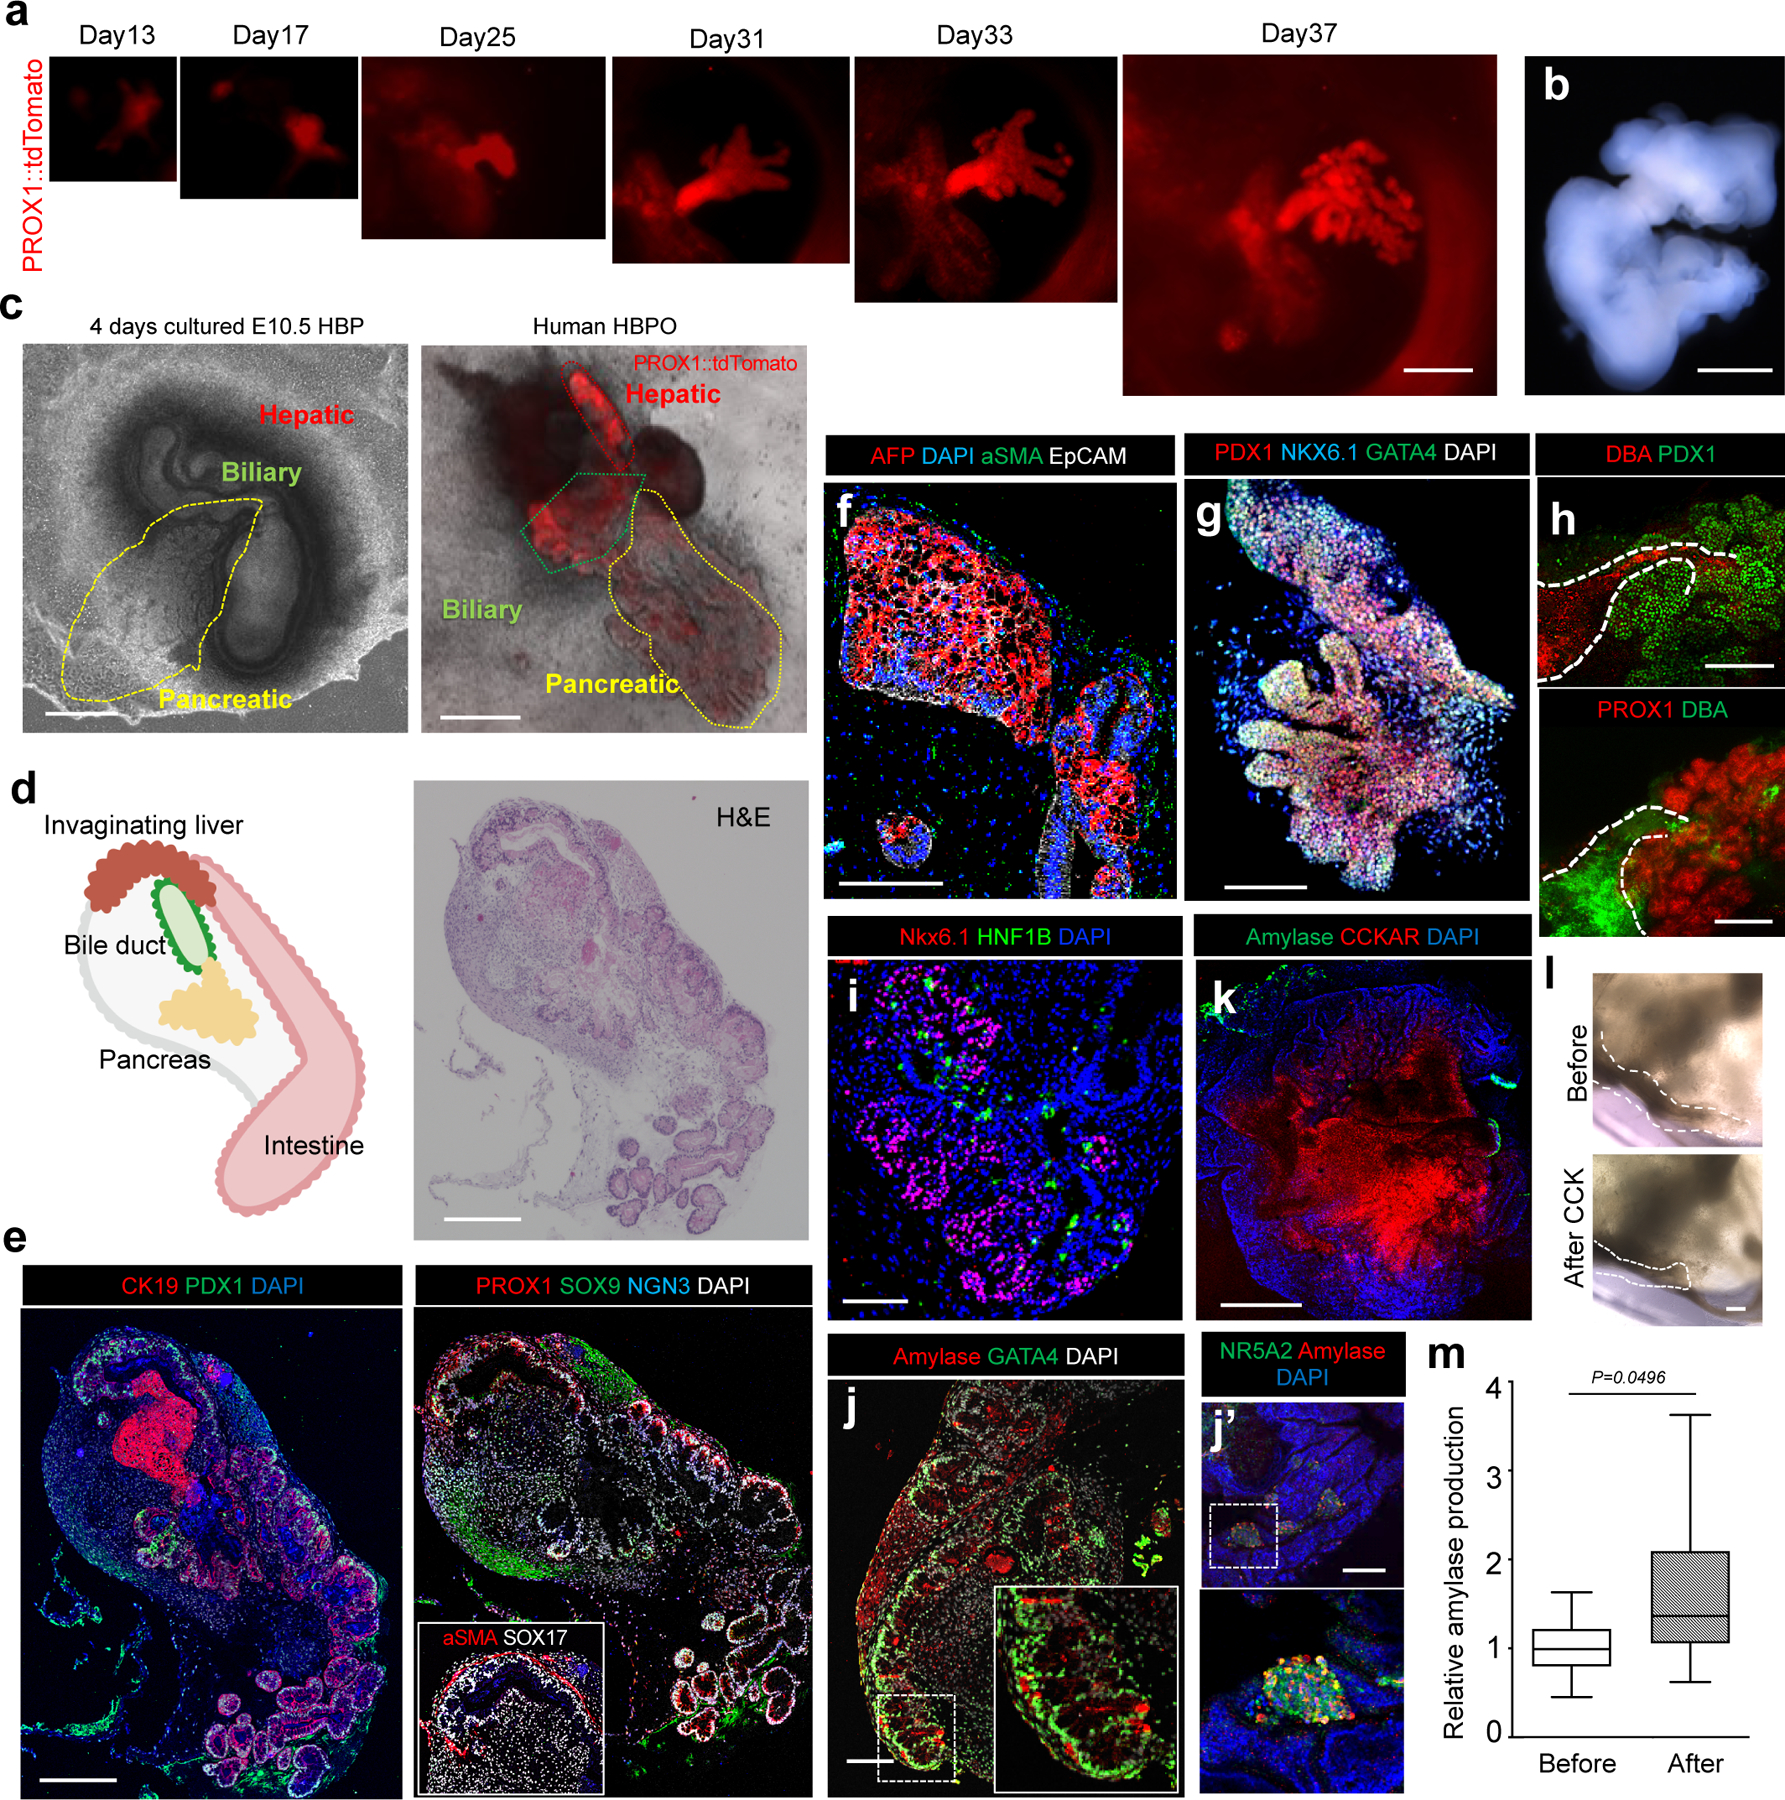
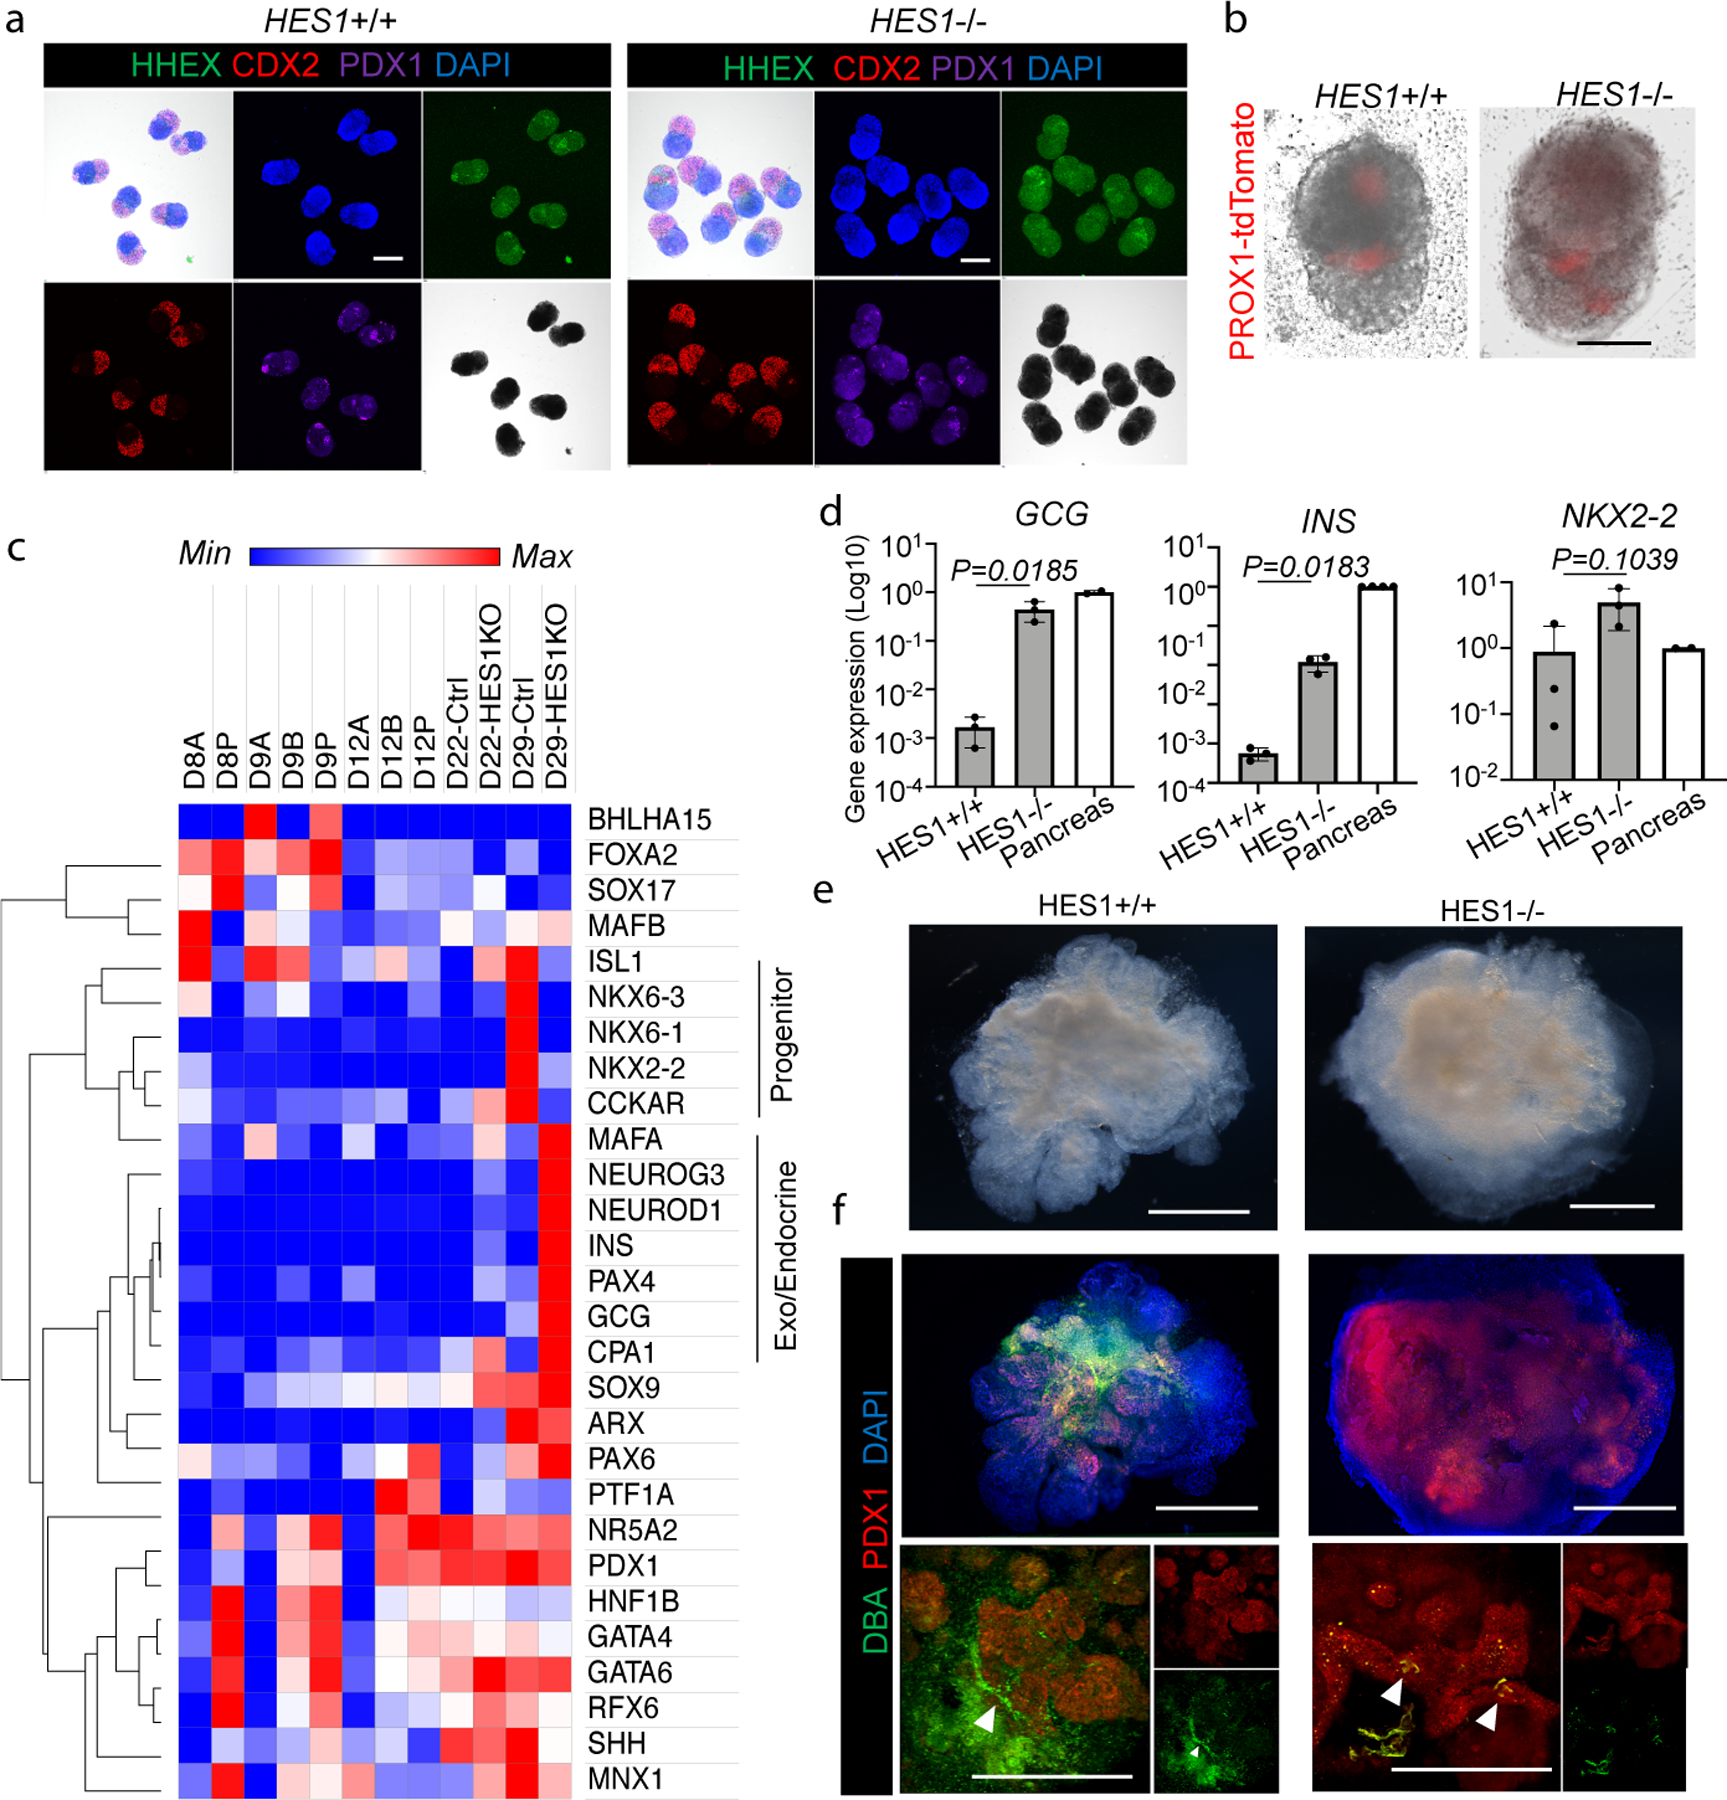
Organogenesis is a complex and interconnected process that is orchestrated by multiple boundary tissue interactions1-7. However, it remains unclear how individual, neighbouring components coordinate to establish an integral multi-organ structure. Here we report the continuous patterning and dynamic morphogenesis of hepatic, biliary and pancreatic structures, invaginating from a three-dimensional culture of human pluripotent stem cells. The boundary interactions between anterior and posterior gut spheroids differentiated from human pluripotent stem cells enables retinoic acid-dependent emergence of hepato-biliary-pancreatic organ domains specified at the foregut-midgut boundary organoids in the absence of extrinsic factors. Whereas transplant-derived tissues are dominated by midgut derivatives, long-term-cultured microdissected hepato-biliary-pancreatic organoids develop into segregated multi-organ anlages, which then recapitulate early morphogenetic events including the invagination and branching of three different and interconnected organ structures, reminiscent of tissues derived from mouse explanted foregut-midgut culture. Mis-segregation of multi-organ domains caused by a genetic mutation in HES1 abolishes the biliary specification potential in culture, as seen in vivo8,9. In sum, we demonstrate that the experimental multi-organ integrated model can be established by the juxtapositioning of foregut and midgut tissues, and potentially serves as a tractable, manipulatable and easily accessible model for the study of complex human endoderm organogenesis.


Conflict of interest statement

Competing Interests: The authors declare no competing interests

Figures

Extended Data Fig. 1:
Extended Data Fig. 1:. Anterior and posterior gut cell specification and boundary organoid formation.
a. Flow cytometry of EpCAM in day 7 anterior and posterior gut cells using TkDA human iPSCs and 72_3 human iPSCs. The gating strategy was FSC A / SSC A > FSC H / FSC W > SSC H / SSC W > PI / FSC A > EpCAM-BV421 / SSC A. Representative image of independent three experiments showing similar results. b. Wholemount immunostaining, flowcytometry with percentage of each population showed in inlet, and qPCR for SOX2, CDX2, and organoid images of each time point. Data is mean ± s.d.; n =3 independent experiments. Unpaired, two-tailed t-test. Scale bars, 50 µm c. The image of day 11 boundary organoids. Anterior and posterior gut spheroids were differentiated from H1 ESCs or 1383D6 iPSCs, mixed and transferred into Matrigel. Independent experiments repeated twice for each line with similar results. Scale bar is 200 μm. d. Wholemount Immunofluorescent staining of PDX1, CDX2, FOXF1, and HHEX in boundary organoids derived from 72_3 iPSC at day 12. Representative image of n = 30 Independent organoids showing similar results. Arrowhead indicates boundary of organoid. Scale bar is 100 μm. e. Wholemount immunofluorescent staining of CDX2, E-Cadherin, and HHEX in boundary region of boundary organoids derived from H1 ESC at day 12. Representative image of n = 6 Independent organoids showing similar results. Scale bar is 50 μm.
Extended Data Fig. 2:
Extended Data Fig. 2:. Cell-cell contact of anterior-posterior gut spheroids induced HBP marker expression.
a. Anterior and posterior spheroids were mixed at Day 8, fused the following day at Day 9, cultured and collected at Day 12 for quantitative RT-PCR. The spheroids that not fused were also collected at Day 12 for comparison. Independent experiments repeated twice with similar results. b. PDX1 and HHEX gene expressions in the condition of fused, not-fused, posterior spheroid (day8), and iPS cells. Data are mean ± s.d. from two independent experiments. c. Comparison of different anterior and posterior gut combinations. Immunofluorescent staining of CDX2, HHEX, and PDX1 in the combination of AP, AA, and PP spheroids at D12. Representative of n = 4 for AA and PP, and n= 6 for AP independent organoids showing similar results. Scale bar is 200 μm.
Expended Data Fig. 3:
Expended Data Fig. 3:. HBP progenitors developed from posterior gut cells.
a. Non labeled iPS cells were differentiated into anterior spheroid while AAVS1-GFP labeled iPS cells were differentiated into posterior spheroid. Top column showed bright field and GFP fluorescent image during boundary organoid formation. Bottom column showed whole mount immunostaining for HHEX and PDX1 at day13. The HHEX expression was overlapped with GFP expression. Top and bottom column were representative of n = 3 independent organoids showing similar results. Scale bar is 200 μm. b. H2B-GFP labeled and unlabeled PROX1::tdTomato reporter iPSCs were differentiated into anterior and posterior spheroid, respectively. tdTomato expression was only detected in unlabeled original posterior gut spheroid. Independent experiments were repeated twice with similar results. Scale bar is 200 μm c. Using unlabeled iPSCs and PROX1::tdTomato reporter iPSCs, anterior and posterior gut spheroids were differentiated. Two combinations, reporter cell derived anterior and unlabeled cell posterior (left column), or unlabeled cell derived anterior and reporter cell derived posterior spheroid (right column) were examined by tdTomato expression. Top row: bright field image, bottom row: tdTomato fluorescence image. Representative of n = 3 independent organoids showing similar results. Scale bar is 200 μm
Expended Data Fig. 4:
Expended Data Fig. 4:. characterization of HBP progenitors from boundary organoid
a. Generating PROX1-tdTomato reporter line by CRISPR-Cas9 system. b. PROX1 reporter activity in boundary organoid. All images are boundary organoids derived from PROX1::tdTomato reporter line at day 12. Top and bottom side of the organoids indicated anterior and posterior side, respectively. Arrowhead indicates PROX1::tdTomato expression at boundary of each spheroid. Independent experiments repeated three times with similar results. Scale bar is 100 μm. c. Transcriptomic characterization of dissected anterior, boundary, and posterior domains by RNAseq. Heatmap shows downstream gene expression related to FGF, BMP, Hedgehog, NOTCH and RA signal pathway selected from GO term category and KEGG pathway category. Heatmap was separated into 8 detailed groups (C1 – C8) by hierarchical clustering. d. Default developmental potential of transplanted boundary organoid. Middle panels show H&E staining and immunohistochemistry, right panel show immunofluorescence. The experiment was repeated by independent three samples with similar results. Scale bar is 100 µm.
Extended Data Fig. 5:
Extended Data Fig. 5:. HHEX, PDX1 and PROX1 inhibition by retinoic acid receptor antagonist exposure in human boundary organoid and mouse embryo.
a. Retinoic acid receptor antagonist, BMS493 pretreated anterior or posterior spheroids were fused to induce HBP anlage formation, and wholemount stained for HHEX, PDX1 and CDX2. Compared to untreated control group, the group of BMS493 pretreated posterior spheroid was inhibited HHEX and PDX1 expression at boundary, suggesting retinoic acid receptor function in posterior side was important to establish HBP boundary organoid. Representative of n = 4 independent organoids showing similar results. Scale bar: 200 μm b,c. Prox1 inhibition by BMS493 exposure with embryonic day (E) 9.0 Prox1::GFP reporter mouse embryo explant culture. The whole embryo was cultured in the rotator-type bottle culture system for 24 hrs. Retinoic acid receptors antagonist BMS493 treated group was compared with control (adding DMSO) group. b. Bright field image and GFP fluorescent image for embryo after culture. Representative of n = 3 independent organoids showing similar results. c. The area of GFP expressing parts were quantified from GFP image in (b). Data were mean ± s.d. (n = 3). P = 0.0035 by Unpaired, two-tailed Student’s t-test. Scale bar: 1 mm
Extended Data Fig. 6:
Extended Data Fig. 6:. Transplantation of dissected PROX1 expressing domain from human organoid and mouse embryo
a Dissected PROX1 positive boundary domain at day 13 was transplanted into immunodeficient mouse, and formed duct like structure in the tissue expressing PROX1 and duct marker SOX9 after 1 month. Representative of n = 2 independent transplants showing similar results. b E9.0 Prox1-GFP mouse embryonic HBP domain was transplanted and formed limited tissue expressing Prox1 (GFP) or Pdx1 at post 7 days of transplantation. Representative of n = 2 independent transplants showing similar results.
Extended Data Fig. 7:
Extended Data Fig. 7:. Optimization of in vitro culture system.
a. Illustration for the dissection strategy of PROX1 positive region from organoids with representative image. The imaging experiments were repeated by independent twelve samples with similar results. Scale is 100 µm b. Optimization of organoid culture system by comparing: 1) Floating, 2) Embedded into Matrigel, 3) Embedded into Matrigel and cultured with Transwell from D13, 4) Dissected, embedded into Matrigel, and cultured with Transwell from D13. Left panel shows the typical morphology of invaginating or branching organoid. The imaging experiments were repeated by independent twelve samples with similar results. Scale is 100 µm c. Illustration of Optimization of in vitro culture system. we compared various culture formats to enhance morphological change, such as invagination and branching morphogenesis, of PROX1 positive HBP domain. At day 7, anterior and posterior gut spheroids were mixed and connected after 24 hour-culture. Connected spheroids were transferred into Matrigel drop or low binding culture plate to compare between non-floating and floating conditions during HBP domain emergence. The organoid in Matrigel embedded group was started to express tdTomato at day 11. The tdTomato positive region was manually dissected under microscope according to the fluorescence expression and transferred into Matrigel drop again or Transwell to compare the effect from various agonist and antagonist in medium. d. Morphogenesis of boundary organoids through 2 days from day 13. The imaging experiments were repeated by independent three samples with similar results. Scale is 100 µm
Extended Data Fig.8:
Extended Data Fig.8:. Comparison of organoid size, PROX1 positive area, branching and invagination in various condition.
a. Comparison of PROX1-tdTomato expression in AP, AA and PP combination at day 50 of culture. Representative image of n = 6 independent organoid showing similar results. Scale bar: 500 μm The quantification of entire spheroid area (b) and of PROX1 positive region (c). n = 11 (AP), 6 (AA) and 7 (PP). Data is mean ± 25th and 75th percentile are shown by central and outer lines of the boxes; whiskers go down to the smallest value and up to the largest. P = 0.0278 (AP vs AA), 0.0052 (AP vs PP) and 0.8566 (AA vs PP) in (b), and P = 0.0011 (AP vs AA), 0.0022 (AP vs PP) and 0.9063 (AA vs PP) in (c); one-way ANOVA, followed by Tukey’s test. d. Percentage of branching, invaginating and other type of PROX1 positive organoid, defined as in Extended Data Fig. 7b. AP combination showed the spheroids with branching and invagination while other two combination did not. e. Failure to branch and invaginate from posterior region of HBPOs. Dissected posterior region from day 11 organoid cultured until day 30. While HBPO formed PROX1 expressing branching structure, posterior dissected region of HBP that contain PDX1 expression did not form its structure. Independent experiment repeated twice with similar results. Scale bar is 200 μm.
Extended Data Fig. 9:
Extended Data Fig. 9:. Expression of organ domain-specific markers in HBPOs.
a. Immunofluorescent staining of AFP, Albumin, and HHEX at day30. AFP and Albumin expressed in the same region but not HHEX. HHEX were hepatocyte progenitor marker which result in disappearance of the expression at the later stage. Independent experiment was repeated twice with similar results. b. Immunofluorescent staining of NKX6.1, NKX6.3 and PDX1. NKx6.3 were expressed in the area of pancreatic markers PDX1 and NKX6.1 expression. Independent experiment was repeated three times with similar results. c. Immunofluorescent staining of EpCAM, PROX1, SOX9, and CLF. Representative image of n = 3 independent organoids showing similar results. Scale bar: 100 μm
Extended Data Fig. 10:
Extended Data Fig. 10:. Upregulation of pancreatic marker genes and depletion of bile duct markers in HES−/− organoids.
a. Gene targeting strategy for HES1 knock out (KO) line by CRISPR-Cas9 system. b. Confirmation of modified gene sequence of control and HES1 KO (Del #11) c. Representative photo of n = 3 HES1 −/− iPSC culture showing similar results. Scale bar is 500 µm d. HES1 expression in organoid at day 20. Data is mean ± s.d.; n = 6 independent organoids. Unpaired two-tailed t-test. e. Heatmap shows gene expression profile of pancreatic associated markers at day 22 of HES1+/+ and HES1−/− HBPOs. This is related to Main fig. 4c. f. Connected structure inhibited in long term cultured HES1 KO organoid. Wholemount staining of DBA and SOX9 in HES1−/− and HES1+/+ organoids. DBA and SOX9 disappeared in HES1−/− organoids. Independent experiment was repeated three times with similar results. Scale bar: 200 μm.
Figure 1.
Figure 1.. Boundary organoid generates multi-endoderm domains
a. Schematic overview for the hepato-biliary-pancreatic (HBP) organoid from PSC (see, video S1). b. Tracing of fused spheroids from day 8 to day 11. Upper: Bright-field. Middle: wholemount immunostaining for SOX2, PDX1 and CDX2. Lower: wholemount immunostaining for CDX2, HHEX and PDX1. Arrow: PDX1 and HHEX positive region. Independent 12 samples were analyzed with similar results. c. Frequency of PDX1 positive cell in each area of fused spheroid. d. Percentages of PDX1 positive cells in each area compared to DAPI stained total cells numbers. Data are mean ± s.e.m. (n = 6), one-way ANOVA, followed by Tukey’s test. e. Percentage of HHEX and PDX1 positive cells in anterior-posterior (AP) (n = 4), anterior-anterior (AA) (n = 3) and posterior-posterior (PP) (n = 3) combination at day11 compared to total cell numbers. Data are mean ± s.d., one-way ANOVA, followed by Tukey’s test. f. Transcriptomic characterization of boundary organoids using the gene-sets of anterior foregut, liver/biliary/pancreas primordium and mid/hindgut markers reported ,. From day 8 (D8) to day 12 (D12), anterior (A), boundary (B), and posterior (P) domains were dissected and applied for RNAseq as indicated in left representative image. Independent 12 organoids for D11 and 30 organoids for D9 and D12 were microdissected with similar results. Scale bars, 50 µm (f), 100 µm (b).
Figure 2.
Figure 2.. Self-emergence of hepato-biliary-pancreatic progenitors from boundary organoid without inductive factors.
a. PROX1-tdTomato expression from day 9 to day 11. Independent 19 samples were taken image with similar results. b. PROX1-tdTomato positive area in AP (n = 11), AA (n = 6) and PP (n = 7) combinations. Mean ± 25th and 75th percentile is shown by central and boxes; whiskers go down to the smallest and up to the largest. One-way ANOVA, followed by Tukey’s test. c. Hepatic invagination in mouse liver primordium explant (Prox1::GFP) and human boundary organoids (PROX1::tdTomato). Independent three samples for mouse and four samples for organoid were analyzed with similar results. d. Immunostaining of PROX1 in E8.75 mice embryo and boundary organoids at day13. The experiments were repeated twice for mice embryo and three times for organoid independently with similar results. e. Gene expression of PDX1, HHEX, SOX2, and CDX2 at day11 with three days culture of retinoic acid (RA), BMS493, R-75251, or WIN18446. Data is mean ± s.d.; n = 4 independent experiments for Day11 control and RA, and n = 3 for others. one-way ANOVA and Dunnett’s test for multiple comparisons versus Day11 control. f. Gene expression analysis for RA pathway in epithelial or mesenchymal cells from original anterior or posterior spheroids. Each gut spheroids were differentiated using mCherry or GFP labeled iPSCs and dissociated into single cells after boundary formation. Anterior/ Posterior separation was performed by mCherry or GFP expression, whereas epithelial / mesenchymal separation was by EpCAM expression. Scale bars, 50 µm (a), 200 µm (c), 100 µm (d).
Figure 3.
Figure 3.. Modeling human hepato-biliary-pancreatic organogenesis.
a. Morphogenetical change of PROX1 dissected domain through 30 days of air-liquid interface culture. b. Stereomicroscopic image of day 37 organoids. c. Boundary organoid has PROX1 expressing HBP domains branched out for putative pancreatic domains, similar to cultured mouse hepato-biliary-pancreas. Left: cultured mouse E10.5 embryonic tissue during 4 days, Right: PROX1-tdTomato HBP domain at day 90. d. Left: Illustration of invagination liver, bile duct and pancreas connected with intestine. Right: H&E in D90 boundary organoid. e-f. Immunostaining of CK19 and PDX1; PROX1, SOX9 and NGN3; and alpha-SMA and SOX17 (e) and AFP, EpCAM, and alpha-SMA (f). g-h Wholemount staining of PDX1, NKX6.1 and GATA4 (g), DBA and PDX1; and PROX1 and DBA (h). i-k. Immunostaining of NKX6.1 and HNF1B (i), Amylase and GATA4 (j) or NR5A2 (j’) and Amylase and CCKAR (k). l. CCK treatment response in putative biliary structure. m. Hormone induced secretory function of exocrine pancreatic domain. ELISA of amylase before and after 3 days- CCK treatment. Mean ± 25th and 75th percentile is shown by central and boxes; whiskers go down to the smallest and up to the largest. n =10 independent experiments. Unpaired two-tailed t-test. The imaging experiments were repeated by independent two samples (b), three samples (d, e, f, h, i, j and k), four samples (c, g and l) and six samples (a) with similar results. Scales, 100 µm (h, j), 200 µm (a, c, d, e, f, g, i), 1 mm (b), 500 µm (k), 50 µm (l).
Figure 4.
Figure 4.. Modeling HES1-mediated organ segregation error in HBPOs.
a. Confirmation of boundary domain formation from HES1 −/− iPSC by wholemount immunostaining of SOX2, CDX2, PDX1 and HHEX. Independent experiments were repeated twice with similar results. b. PROX1-tdTomato expression in HES1 −/− organoids at D11. Representative of n = 6 independent organoids showing similar results. c. RNAseq of pancreas associated markers at day22 of HES1 −/− HBPOs. d. Log fold gene expression of GCG, INS, and NKX2–2 in HES1 −/− organoid and human adult pancreas. Data are mean ± s.d. n = 3 independent experiments for organoids. Unpaired, two-tailed t-test for HES1 +/+ and −/− organoids. e. Macroscopic observation of boundary domain of HES1−/− organoid. Representative of n = 3 independent organoids showing similar results. f. Wholemount staining for PDX1 and DBA in HES1 KO organoids. Representative of n = 3 independent organoids showing similar results. Scale bars, 200 µm (a), 100 µm (b), 500 µm (e, f).

Similar articles

Cited by

References

    1. Smith DM, Nielsen C, Tabin CJ & Roberts DJ Roles of BMP signaling and Nkx2.5 in patterning at the chick midgut-foregut boundary. Development 127, 3671–3681 (2000). - PubMed
    1. Hentsch B et al. Hlx homeo box gene is essential for an inductive tissue interaction that drives expansion of embryonic liver and gut. Genes Dev 10, 70–79 (1996). - PubMed
    1. San Roman AK & Shivdasani RA Boundaries, junctions and transitions in the gastrointestinal tract. Exp Cell Res 317, 2711–2718, doi:10.1016/j.yexcr.2011.07.011 (2011). - DOI - PMC - PubMed
    1. Nielsen C, Murtaugh LC, Chyung JC, Lassar A & Roberts DJ Gizzard formation and the role of Bapx1. Dev Biol 231, 164–174, doi:10.1006/dbio.2000.0151 (2001). - DOI - PubMed
    1. Bort R, Martinez-Barbera JP, Beddington RS & Zaret KS Hex homeobox gene-dependent tissue positioning is required for organogenesis of the ventral pancreas. Development 131, 797–806, doi:10.1242/dev.00965 (2004). - DOI - PubMed

Publication types

MeSH terms