. 2019 Oct;574(7776):122-126.
doi: 10.1038/s41586-019-1595-3. Epub 2019 Sep 25.

Analysis of the B cell receptor repertoire in six immune-mediated diseases

Affiliations

Analysis of the B cell receptor repertoire in six immune-mediated diseases

R J M Bashford-Rogers et al. Nature. 2019 Oct.

Abstract

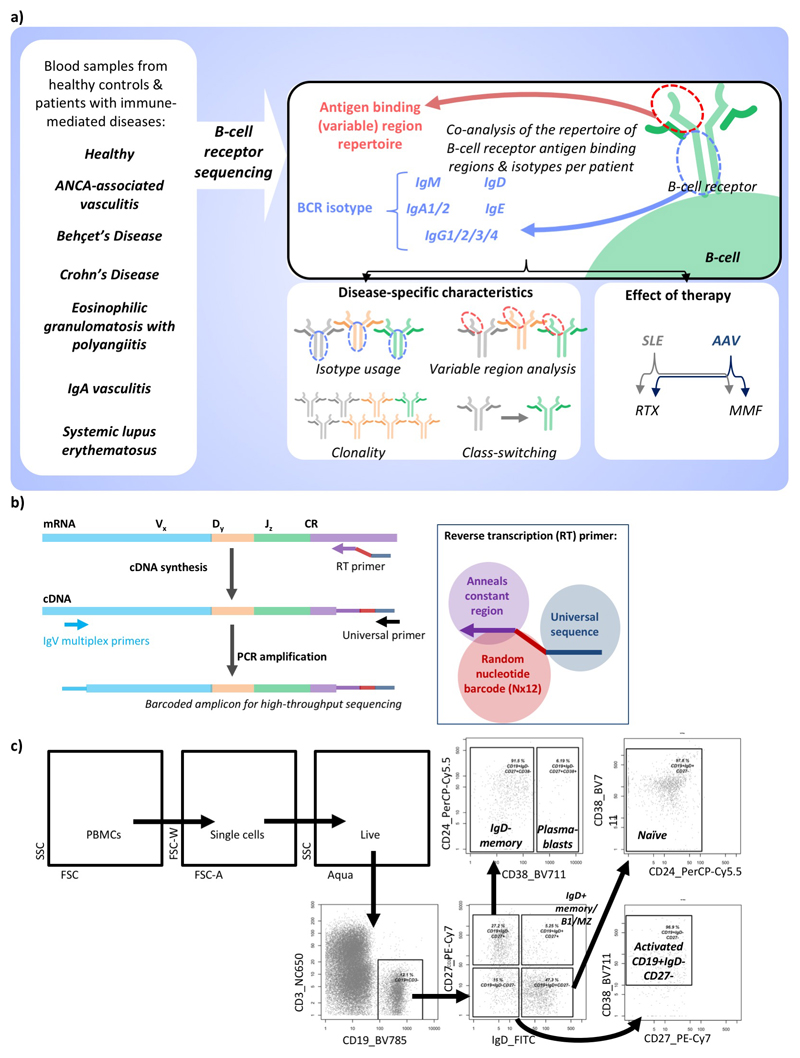
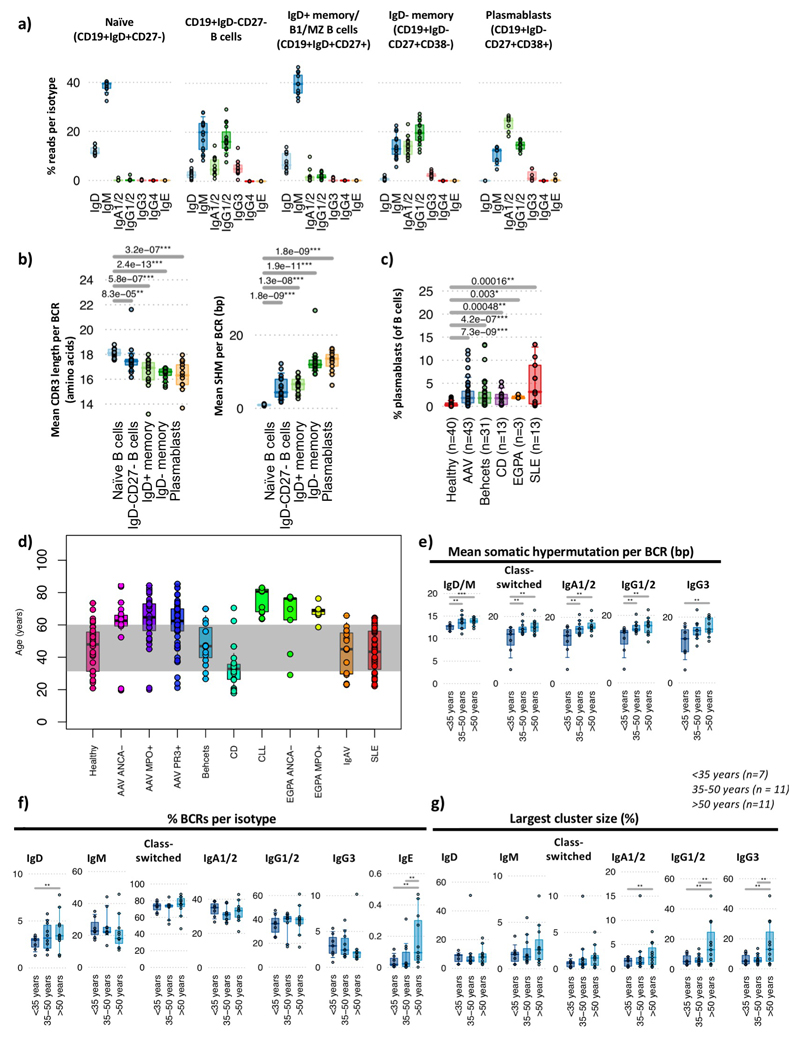
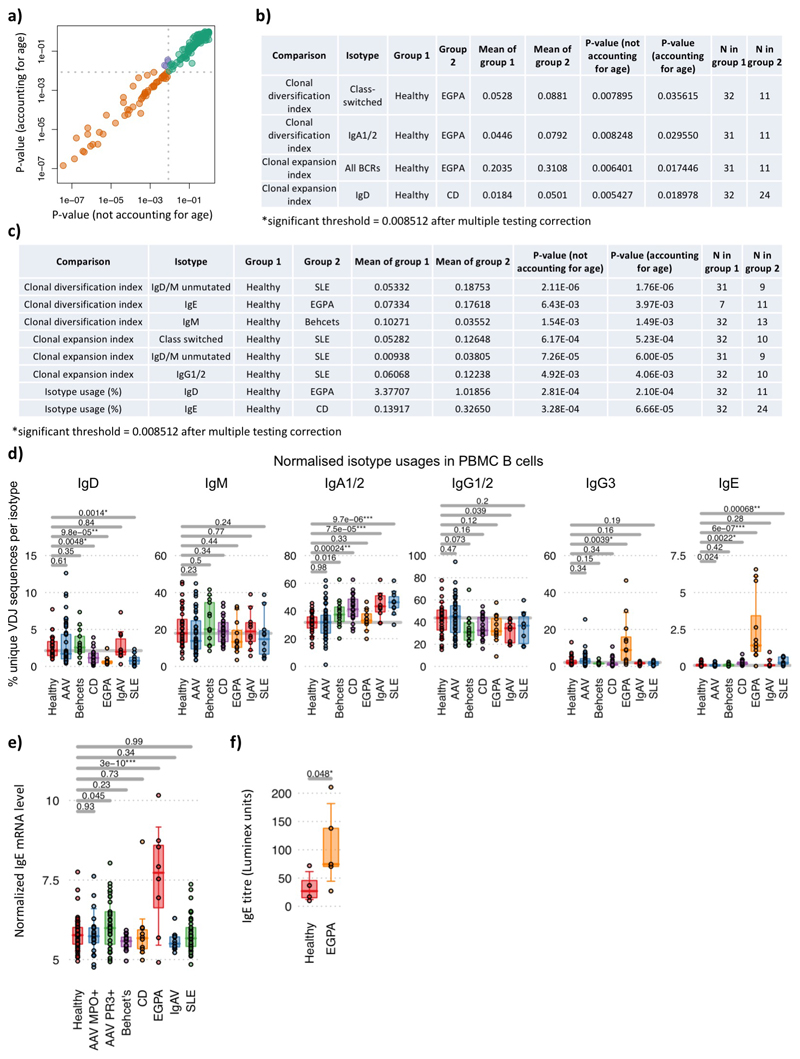
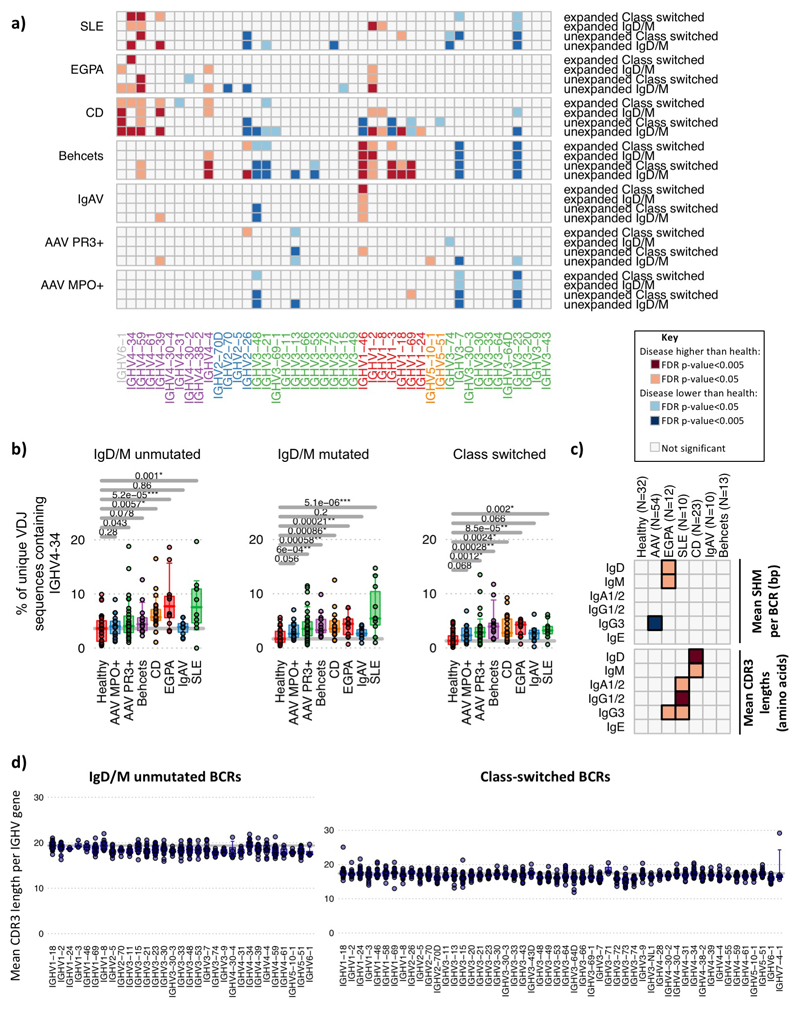
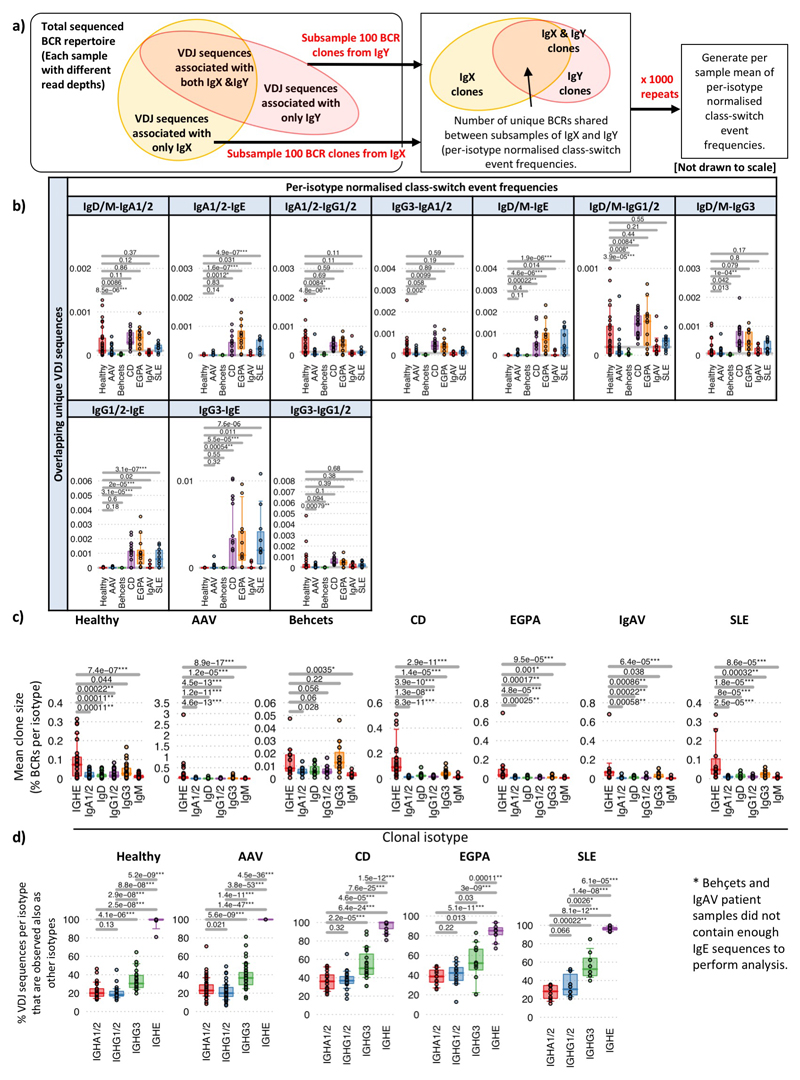
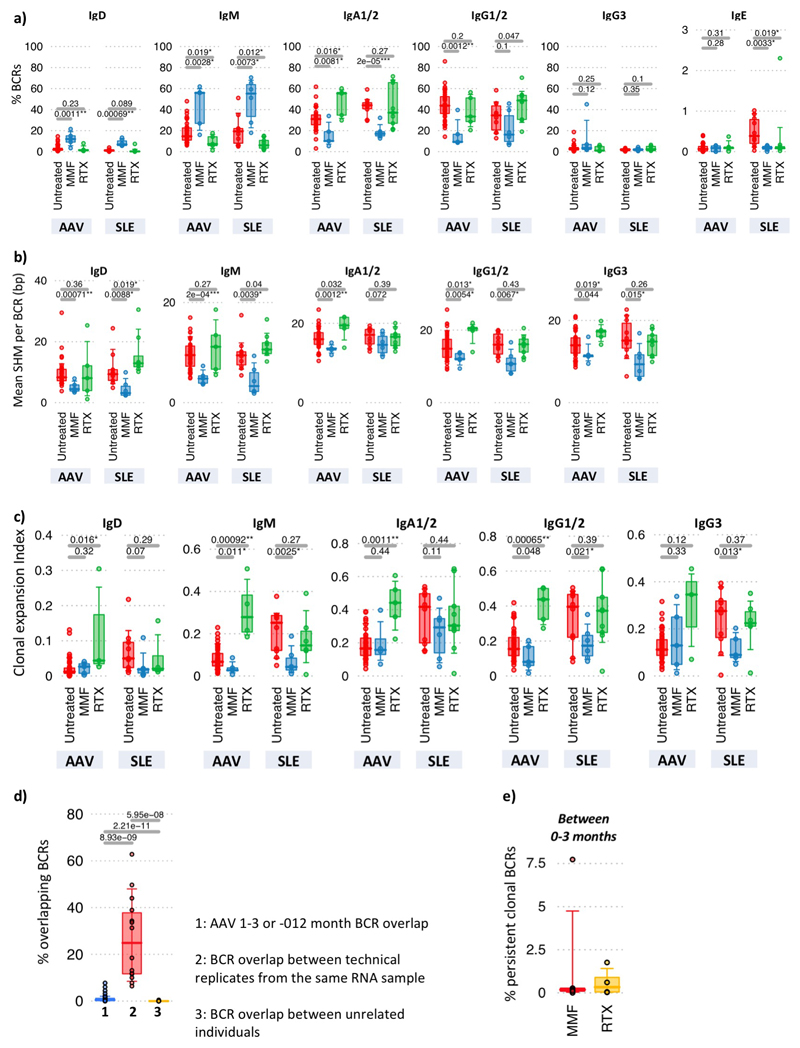
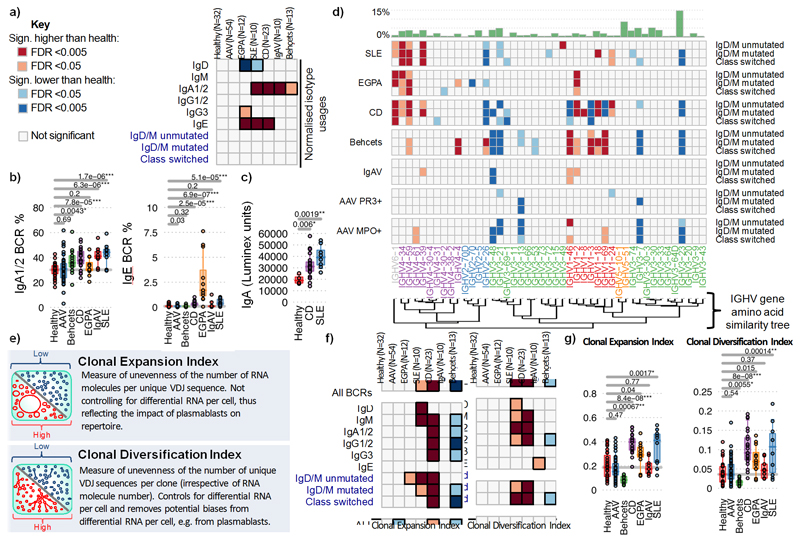
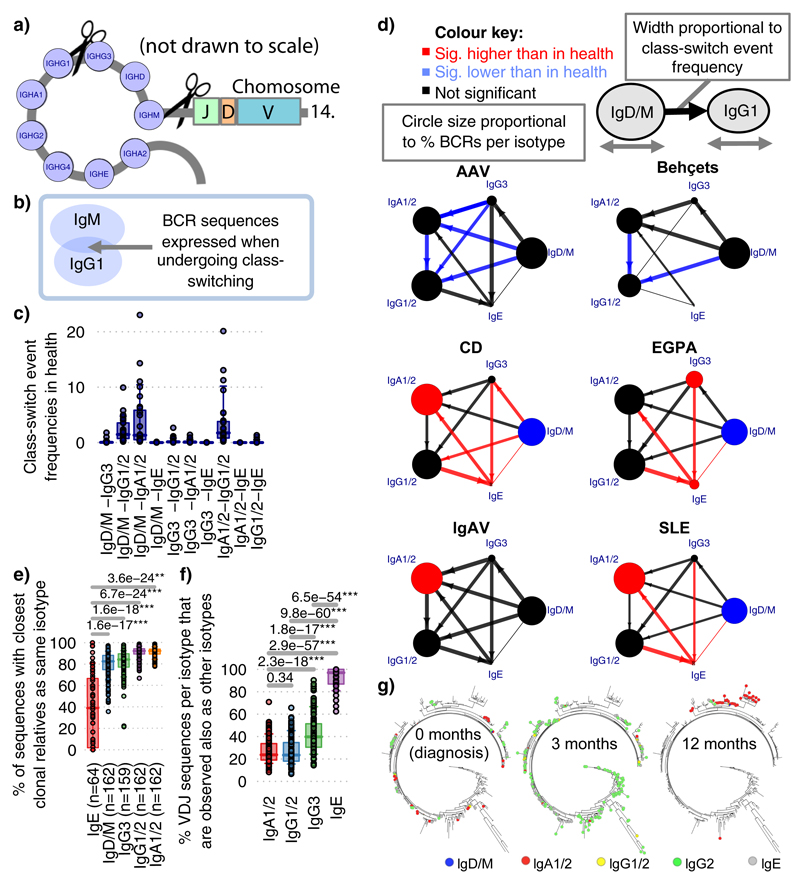
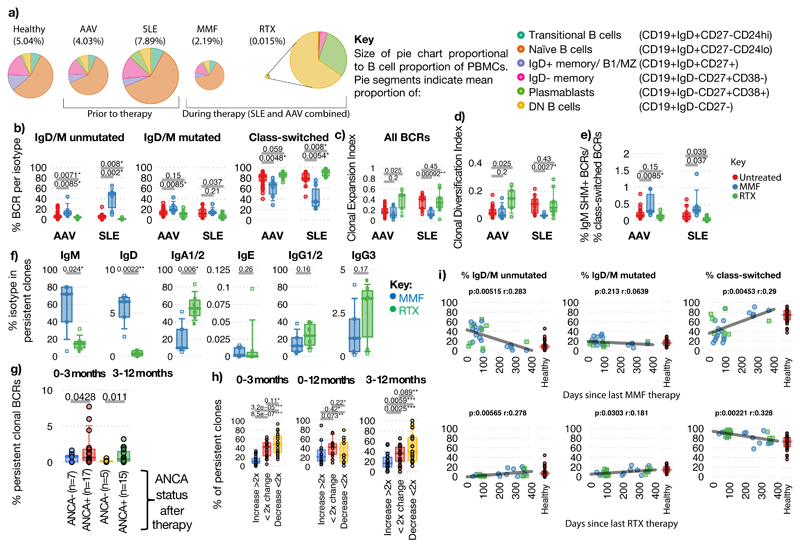
B cells are important in the pathogenesis of many, and perhaps all, immune-mediated diseases. Each B cell expresses a single B cell receptor (BCR)1, and the diverse range of BCRs expressed by the total B cell population of an individual is termed the 'BCR repertoire'. Our understanding of the BCR repertoire in the context of immune-mediated diseases is incomplete, and defining this could provide new insights into pathogenesis and therapy. Here, we compared the BCR repertoire in systemic lupus erythematosus, anti-neutrophil cytoplasmic antibody (ANCA)-associated vasculitis, Crohn's disease, Behçet's disease, eosinophilic granulomatosis with polyangiitis, and immunoglobulin A (IgA) vasculitis by analysing BCR clonality, use of immunoglobulin heavy-chain variable region (IGHV) genes and-in particular-isotype use. An increase in clonality in systemic lupus erythematosus and Crohn's disease that was dominated by the IgA isotype, together with skewed use of the IGHV genes in these and other diseases, suggested a microbial contribution to pathogenesis. Different immunosuppressive treatments had specific and distinct effects on the repertoire; B cells that persisted after treatment with rituximab were predominately isotype-switched and clonally expanded, whereas the inverse was true for B cells that persisted after treatment with mycophenolate mofetil. Our comparative analysis of the BCR repertoire in immune-mediated disease reveals a complex B cell architecture, providing a platform for understanding pathological mechanisms and designing treatment strategies.


Figures

Extended Data Figure 1
Extended Data Figure 1. Overview of BCR repertoire strategy.
a) Schematic diagram of the B cell receptor repertoire analysis strategy. b) Schematic diagram of the B cell receptor sequencing strategy. In the reverse transcription (RT) step, the primer anneals to the constant region of the B cell receptor mRNA to generate cDNA with a random 12 nucleotide barcode. This barcode can be computationally used to reduce PCR amplification biases after sequencing. The product is cleaned and PCR amplified using multiple primers binding to the FR1 region of the IgH genes along with a universal sequence complementary to the end of the RT primer. c) Gating strategy to flow sort B cell subsets from healthy donor PBMCs.
Extended Data Figure 2
Extended Data Figure 2. Impact of B cell subset and age on repertoire.
a) The isotype usage frequencies from BCR sequencing data from sorted naïve B cells (CD19+IgD+CD27-), CD19+CD27-IgD- B cells, IgD+ memory/B1/MZ B cells (CD19+CD27+IgD+) and IgD- memory B cells (CD19+CD27+IgD-CD38-) and plasmablasts (CD19+CD27+IgD-CD38+) from 19 healthy individuals. b) (left) The mean CDR3 lengths and (right) mean SHM per BCR from healthy individual cell-sorted B cell populations (n=19). c) The plasmablast frequency per patient in peripheral blood at enrolment as a percentage of CD19+ B cells. d) Distribution of patient ages within this study, grouped by disease. e-g) PBMC BCR repertoire correlations with age in healthy individuals for g) the mean number of somatic hypermutation per BCR per bp, f) the percentages of BCRs per isotype; g) percentage sizes of the largest cluster per sample. For b-c: P-values calculated by two-sided by ANOVA and * denotes FDR <0.05, ** <0.005, *** <0.0005, where FDR determined by Šidák method. For e-g: P-values calculated by two-sided by Wilcoxon test. * denotes p-values <0.05, ** <0.005, *** <0.0005, NS otherwise, with raw p-values provided in Table S4. Boxplots show the 25th, 50th and 75th percentiles; whiskers show upper and lower quartiles.
Extended Data Figure 3
Extended Data Figure 3. Repertoire changes with age and isotpe usages with disease.
a) Correlation of p-values obtained using age as a covariate versus excluding age in the analysis across 178 BCR features (calculated by two-sided by ANOVA), and b) analyses where statistical significance was discordant (i.e. below significance threshold without accounting for age and above significance threshold while using age as a covariate, or vice versa, purple points from (a)). c) Analyses where statistically significant p-values were decreased by >1.5 fold after using age as a covariate. Grey dotted lines in (a) indicate the threshold of significance after account for multiple testing (FDR<0.05, determined by Šidák method). d) The percentages of normalized isotype usages (unique VDJ sequences per isotype) for PBMC BCR repertoires per disease. e) Normalized IgE immunoglobulin constant region transcript levels between disease groups from transcriptomic data. n=58, 23, 33, 13, 10, 8, 11 and 37 for healthy, AAV MP0+, AAV PR3+, Behçhet’s, CD, EGPA, IgAV and SLE patients respectively. f) IgE titre between healthy individuals (n=4) and EGPA patients (n=5). P-values calculated by two-sided by ANOVA for (d)-(e) and * denotes FDR <0.05, ** <0.005, *** <0.0005, where FDR determined by Šidák method. Boxplots show the 25th, 50th and 75th percentiles; whiskers show upper and lower quartiles.
Extended Data Figure 4
Extended Data Figure 4. Changes in IGHV gene usage with disease.
Changes in IGHV gene usage between unexpanded and expanded clones. a) Heatmap of each IGHV gene frequency difference between healthy individuals and each autoimmune disease patient group within BCRs from IgM+D+ or isotype-switched (IgA/IgG/E) BCR from unexpanded clones (clontaining <3 unique BCRs) or expanded clones (3 or more unique BCRs per clone). Only genes >0.1% in frequency are shown. IGHV genes are ordered according to amino acid similarity as in Figure 2. b) IGHV4-34 BCR frequencies with autoreactive AVY & NHS motifs compared between healthy individuals and disease groups, separated by BCR type: IgM+D+SHM- BCR sequences, IgM+D+SHM+ BCR sequences and IgM-D- BCR sequences (defined in (a)). c) Heatmaps showing the (top) mean SHM per BCR and (bottom) relative mean CDR3 lengths mean SHM per BCR per isotype per disease from total PBMC B cells. d) The distribution of the mean CDR3 lengths per IGHV gene in healthy individuals (n=32). Each point represents a mean CDR3 length for an individual for (left) unmutated IgD/M BCRs and (right) class-switched BCRs. Instances where IGHV genes represented by fewer than 10 BCRs in an individual are excluded. For (a)-(d): n=32, 18, 32, 12, 10, 23, 10 and 13 for healthy, AAV MP0+, AAV PR3+, EGPA, SLE, CD IgAV and Behçet’s patients respectively. P-values calculated by two-sided ANOVA. Orange squares indicate significantly higher, and blue squares significantly lower, corresponding gene frequency between healthy individuals and disease. FDR determined by Šidák method.
Extended Data Figure 5
Extended Data Figure 5. Network subsampling methods for preserving repertoire structure.
a) Schematic diagram of the cluster-vertex migration in the CC algorithm. b) Maximum cluster sizes between true (unsampled) networks and sub-sampled networks of 2000 clones by the tree subsampling methods. c) Comparison of representative networks from each patient group at diagnosis. The sample patient samples are represented across the three sampling methods. Each vertex represents a unique sequence, where relative vertex size is proportional to the number of identical reads. Edges join vertices that differ by single nucleotide non-indel differences and clusters are collections of related, connected vertices. Networks are comprised of a subsample of 2000 clones using the corresponding subsampling method. Each vertex is represented by a pie chart indicating the percentage of each isotype, where blue = IgD/M, red = IgA1/2, yellow = IgG1/2, green = IgG3, and grey = IgE.
Extended Data Figure 6
Extended Data Figure 6. BCR repertoire clonality between diseases.
a) Boxplots of the Clonal Expansion Index and b) the Clonal Diversification Index for PBMC BCR repertoires per disease. c) Plots of the percentage of clones per sample per disease greater than clone size, C. Clone size is defined as the number of unique VDJ sequences that are clonally related. For each disease, the mean percentage is indicated by the dark blue line, and the upper and lower interquartile ranges indicated by the light blue areas. Overlaid in grey is the equivalent for healthy individuals. Differences in read depth were accounted for by subsampling 5000 clones from each repertoire and determining a mean of 20 repeats. As a disease comparison, we show the distribution for CLL. d) Boxplots of the percentage of clones larger than 10, 20, 30, 40, or 50 unique VDJs per disease. Differences in reads depth were accounted for by performing subsamples 5000 clones and determining a mean of 20 repeats. For (a),(b),(d): P-values calculated by two-sided by ANOVA for (a),(b),(d). * denotes FDR <0.05, ** <0.005, *** <0.0005, and FDR determined by Šidák method. n=32, 18, 32, 12, 10, 23, 10 and 13 for healthy, AAV MP0+, AAV PR3+, EGPA, SLE, CD IgAV and Behçet’s patients respectively. Boxplots show the 25th, 50th and 75th percentiles; whiskers show upper and lower quartiles.
Extended Data Figure 7
Extended Data Figure 7. BCR repertoire similarity between diseases and class-switch recombination estimation.
a) The maximum clone sizes (as a percentage of unique VDJ sequences of a given isotype in largest clone divided by the total of unique BCRs of that isotype) for PBMC BCR repertoires per disease across isotypes. b) Global repertoire dissimilarity measures between disease groups. Heatmap showing the global repertoire dissimilarity measures between disease groups based on the combination of three main BCR features (isotype frequency, clonal expansion index, clonal diversification index) and determining joint differences between groups (MANOVA test using disease group and age as covariables). The light and dark orange squares indicate significant differences between corresponding disease groups (false discovery rate (FDR) < 0.05 and 0.005 respectively, where FDR determined by Šidák method. n=32, 18, 32, 12, 10, 23, 10 and 13 for healthy, AAV MP0+, AAV PR3+, EGPA, SLE, CD IgAV and Behçet’s patients respectively. c) The sequence of B cell isotype expression is defined by the order of constant regions on the chromosome, where the possible class-switching is depicted by the arrows between constant regions. d) Schematic diagram of class-switch types detectable from the sequencing data due to the ambiguity of isotype between IgA1/2 and IgG1/2 in the isotype-specific sequencing and splicing of IgD from IgM-containing transcripts. Possible class-switching events are represented by the arrows between constant regions. e) Multiple unique RNA sequences with identical antigen binding regions (V-D-J) but different constant regions represent instances of class switching. f) Schematic diagram of sub-sampling of BCR repertoires to generate the relative class-switch event frequency. This is the frequency of unique VDJ regions expressed as two isotypes (i.e. from more than one B cell, where one has undergone CSR), and determined as proportion of unique BCRs present as both isotypes IgX and IgY within a random subsample of 8000 BCRs, where the mean of 1000 repeats was generated. This provides information on the frequency of BCRs observed associated with any two isotypes (class-switching events) while accounting for total read depth, but not accounting for differences in the relative frequencies of BCRs per isotype. For (a): n=32, 18, 32, 12, 10, 23, 10 and 13 for healthy, AAV MP0+, AAV PR3+, EGPA, SLE, CD IgAV and Behçet’s patients respectively. P-values calculated by two-sided ANOVA, * denotes FDR <0.05, ** <0.005, *** <0.0005, and FDR determined by Šidák method. Boxplots show the 25th, 50th and 75th percentiles; whiskers show upper and lower quartiles.
Extended Data Figure 8
Extended Data Figure 8. Class-switch recombination estimation differences between diseases.
a) Boxplots of the proportion of class-switch events between isotypes for each autoimmune disease. Boxplots show the 25th, 50th and 75th percentiles; whiskers show upper and lower quartiles. b) Boxplots of the proportion of class-switch events between autoimmune diseases across isotypes for PBMC BCR repertoires via subsampling total repertoire. P-values calculated by two-sided ANOVA and * denotes FDR <0.05, ** <0.005, *** <0.0005, where FDR was determined by the Šidák method. n=32, 18, 32, 12, 10, 23, 10 and 13 for healthy, AAV MP0+, AAV PR3+, EGPA, SLE, CD IgAV and Behçet’s patients respectively. Boxplots show the 25th, 50th and 75th percentiles; whiskers show upper and lower quartiles. c) Phylogenetic trees of representative clonal expansions from patients demonstrating class-switch recombination events. Each vertex is a unique BCR sequence and is represented by a pie chart indicating the percentage of each isotype, where blue = IgD/M, red = IgA1/2, yellow = IgG1/2, green = IgG3, and grey = IgE. Branch lengths are estimated by maximum parsimony, and the BCRs with the lowest number of somatic hypermutations are indicated (denoted “BCRs closest to germline”).
Extended Data Figure 9
Extended Data Figure 9. Normalised class-switch recombination estimation differences between diseases and IgE clonal features.
a) Schematic diagram of sub-sampling of BCR repertoires to generate the per-isotype normalized class-switch event frequencies, defined as the frequency of unique VDJ regions expressed as two isotypes whilst normalizing for differences in isotype frequencies. To account for differences in isotype proportions, BCRs from each isotype were randomly subsampled to a fixed depth of 200 reads, and the proportion of unique VDJ sequences present between each pair of isotypes was counted. The mean of 1000 repeats was generated. b) Boxplots of the proportion of the per-isotype normalized class-switch event frequencies between isotypes for each autoimmune disease. P-values calculated by two-sided by ANOVA and * denotes FDR <0.05, ** <0.005, *** <0.0005, where FDR determined by Šidák method. n=32, 18, 32, 12, 10, 23, 10 and 13 for healthy, AAV MP0+, AAV PR3+, EGPA, SLE, CD IgAV and Behçet’s patients respectively. Boxplots show the 25th, 50th and 75th percentiles; whiskers show upper and lower quartiles. c) Boxplots of the mean cluster sizes per patient per isotype as a percentage of BCRs per isotype, comparing IgE-associated clones with non-IgE-associated clones for each disease. d) The proportion of VDJ sequences per isotype that are observed also as other isotypes for each disease. P-values calculated by two-sided Wilcoxon tests and * denotes FDR <0.05, ** <0.005, *** <0.0005, where FDR determined by Šidák method. n=32, 18, 32, 12, 10, 23, 10 and 13 for healthy, AAV MP0+, AAV PR3+, EGPA, SLE, CD IgAV and Behçet’s patients respectively. Boxplots show the 25th, 50th and 75th percentiles; whiskers show upper and lower quartiles.
Extended Data Figure 10
Extended Data Figure 10. Impact of therapy on BCR repertoire.
The a) percentages of BCRs per isotype, b) mean SHM pre BCR per isotype, and c) clonal expansion indices of AAV and SLE patient samples taken at diagnosis (red, untreated), and patients post 3-months induction therapies with MMF (blue) or RTX (green). For AAV, the patients per group were: Untreated (n=42), MMF (n=5), RTX (n=5), and for SLE, the patients per group were: Untreated (n=11), MMF (n=6), RTX (n=9). d) The percentage of BCRs shared between diagnosis and 3 or 12 months post-induction therapy AAV samples (blue), BCRs shared between repertoires from the same RNA tube (red), and BCRs shared between samples from unrelated patient samples. Zero overlap was found between unrelated samples, whereas significantly higher overlap between BCRs shared between repertoires from the same RNA tube compared to BCRs shared between diagnosis and 3 or 12 months post-induction therapy AAV samples. This suggests that the overlap measurements yield realistic and normalized values at this sampling depth. e) The percentages of persistent BCRs shared between diagnosis and 3 months post induction therapy, split between patients receiving different therapies. P-values calculated by two-sided Wilcoxon tests. Boxplots show the 25th, 50th and 75th percentiles; whiskers show upper and lower quartiles.
Figure 1
Figure 1. Differences in isotype, IGHV gene usages and clonality between IMDs.
a) Heatmap of the normalized isotype usages per disease. b) The percentages of normalized IgA1/2 and IgE BCR percentage usages per disease. c) IgA titre in healthy individuals (n=4) and CD (n=20) and SLE (n=8) patients. d) Heatmap of IGHV gene frequency and BCR subtypes in health and disease: IgM+D+SHM- BCR sequences, (>78% derived from naive B cells); IgM+D+SHM+ BCR sequences - SHM is evidence of antigenic stimulation; and IgM-D- BCR sequences, all isotype-switched and therefore post-antigenic. Light and dark orange squares indicate significantly higher, and light and dark blue squares lower, gene frequency in disease than health. Only genes >0.1% in frequency are shown. Relative mean gene frequencies in healthy individuals are indicated at the top (full heatmap in Supplemental data file 3). IGHV genes are ordered according to amino acid similarity, indicated by the IGHV gene amino acid similarity tree (see methods). e) Explanations of clonality measures and network representations of BCR repertoires. f) Heatmap showing the (left) Clonal Expansion Index and (right) Clonal Diversification Index of each isotype per disease from total PBMC B cells. g) The (left) Clonal Expansion Index and (right) Clonal Diversification Index for PBMC BCR repertoires per disease. For (a),(b),(d),(f),(g): n=32, 18, 32, 12, 10, 23, 10 and 13 for healthy, AAV MP0+, AAV PR3+, EGPA, SLE, CD IgAV and Behçet’s patients respectively. P-values calculated by two-sided ANOVA for (a)-(c) and * denotes false discovery rate (FDR) <0.05, ** <0.005, *** <0.0005, where FDR determined by Šidák method. For (d),(f): Light and dark orange squares indicate significantly higher, and light and dark blue squares significantly lower, isotype use in disease compared to health. Boxplots show the 25th, 50th and 75th percentiles; whiskers show upper and lower quartiles.
Figure 2
Figure 2. Class-switching in IMDs.
a) Schematic diagram of class-switch recombination (CSR). b) Relative frequencies of CSR between different constant regions may be determined through the frequency of unique VDJ regions expressed as two isotypes normalized for read depth. c) Relative class-switch recombination event frequencies across healthy individuals (n=32). d) CSR frequencies across autoimmune diseases. Each circle represents an isotype class per disease, where the size is proportional to percentage of unique BCRs corresponding to that isotype, coloured according to whether it is significantly higher (red), lower (blue) or not different (black) to healthy individuals. Arrows indicate class-switching between isotypes, where the thickness is proportional to the relative class-switch recombination event frequencies for each disease, colored according to whether these are significantly higher (red), lower (blue) or not different (black) to healthy individuals. P-values calculated by two-sided ANOVA, FDR determined by Šidák method and threshold of significance is FDR<0.05. e) The proportion of VDJ sequences per isotype that are also observed as other isotypes (across health and diseases, n=149). f) The proportion of VDJ sequences where closest clonal relatives are also present as same isotype (across health and diseases, n=149). g) A representative phylogenetic tree of an IgE-associated clone maintained over the course of therapy from an EGPA ANCA-patient (patient 145). Colors indicate isotype usage and time-point for each BCR. All nodes scaled to unitary size. For (c),(e)-(g): Boxplots show the 25th, 50th and 75th percentiles; whiskers show upper and lower quartiles. For (e)-(g): P-values calculated by two-sided Wilcoxon tests for (a)-(c); * denotes FDR <0.05, ** <0.005, *** <0.0005, and FDR determined by Šidák method.
Figure 3
Figure 3. The impact of therapy on the B cell receptor repertoire.
a) Mean proportion and phenotype distribution of B cells within PBMCs in healthy controls and in AAV and SLE patients before and after therapy (B cell percentage of PBMC in brackets). Data from AAV and SLE patients is combined post-therapy. b-d) Percentages of b) unmutated IgD/IgM, mutated IgD/IgM and antigen-experienced switched BCRs (IgA1/2/IgG1/2/IgG3/IgE), c) Clonal expansion, d) Clonal Diversification Indices, and e) ratio of the percentage of IgM+SHM+ BCRs over class-switched BCRs of AAV and SLE patient samples at diagnosis (red, untreated), and patients 3-months post-treatment with MMF (blue) or RTX (green). For AAV: Untreated (n=42), MMF (n=5), RTX (n=5), and for SLE: Untreated (n=11), MMF (n=6), RTX (n=9). f) Isotype percentages of persistent clones between diagnosis and post-induction therapy in AAV patients: MMF (n=5) and RTX (n=6). g) Percentages of persistent BCRs shared between diagnosis and 3-months, or between 3- and 12-months post-induction therapy respectively, split between patients who became serum ANCA-negative after induction versus those who remain serum ANCA positive. h) Percentages of persistent clones expanded by >2 fold, changed <2-fold or decreased by >2-fold between diagnosis and post-induction therapy in AAV patients (n=12, 20 and 19 for 0-3-months, 0-12-months and 3-12-months respectively. i) Correlation between proportions of BCR types with time since last treatment of (top) MMF (n=27), and (bottom) RTX (n=26). Pearson's correlation p-values indicated. Healthy individual BCR frequencies in red. For (b)-(h): P-values calculated by two-sided ANOVA, * denotes FDR <0.05, **<0.005, ***<0.0005, FDR determined by Šidák method. Boxplots show the 25th, 50th and 75th percentiles; whiskers show extent of outliers.

Comment in

References

    1. Nossal GJV, Lederberg J. Antibody production by single cells. Nature. 1958;181:1419–1420. - PubMed
    1. Lydyard PM, Whelan A, Fanger MW. Instant Notes Series; Instant Notes in Immunology. 2000;i-x:1–318.
    1. Nemazee D. Mechanisms of central tolerance for B cells. Nat Rev Immunol. 2017;17:281–294. doi: 10.1038/nri.2017.19. - DOI - PMC - PubMed
    1. Wardemann H, et al. Predominant autoantibody production by early human B cell precursors. Science. 2003;301:1374–1377. doi: 10.1126/science.1086907. - DOI - PubMed
    1. Stavnezer J, Schrader CE. IgH chain class switch recombination: mechanism and regulation. J Immunol. 2014;193:5370–5378. doi: 10.4049/jimmunol.1401849. - DOI - PMC - PubMed

Publication types