. 2019 Sep 18;5(9):eaax6352.
doi: 10.1126/sciadv.aax6352. eCollection 2019 Sep.

SLC36A1-mTORC1 signaling drives acquired resistance to CDK4/6 inhibitors

Affiliations

SLC36A1-mTORC1 signaling drives acquired resistance to CDK4/6 inhibitors

Akihiro Yoshida et al. Sci Adv. .

Abstract

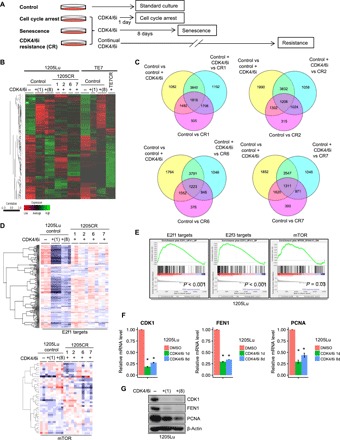
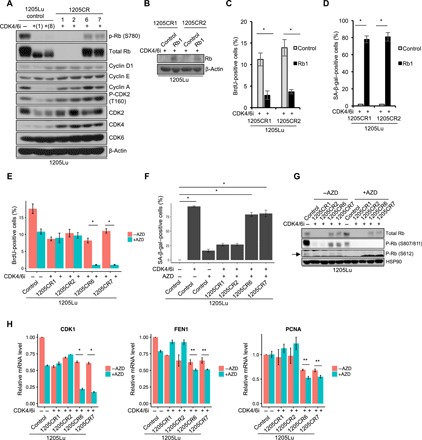
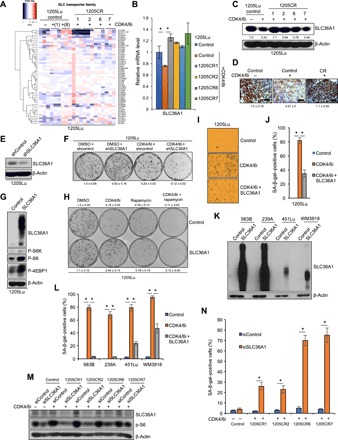
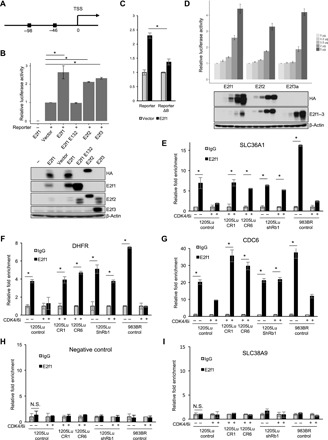
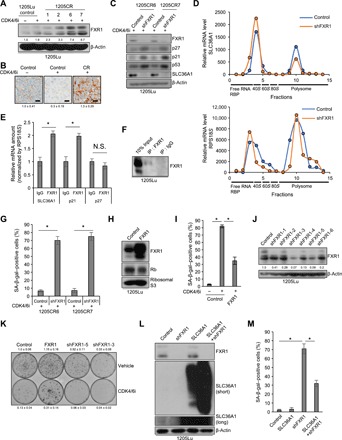
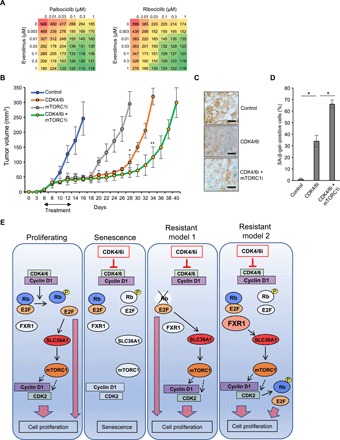
The cyclin-dependent kinase 4/6 (CDK4/6) kinase is dysregulated in melanoma, highlighting it as a potential therapeutic target. CDK4/6 inhibitors are being evaluated in trials for melanoma and additional cancers. While beneficial, resistance to therapy is a concern, and the molecular mechanisms of such resistance remain undefined. We demonstrate that reactivation of mammalian target of rapamycin 1 (mTORC1) signaling through increased expression of the amino acid transporter, solute carrier family 36 member 1 (SLC36A1), drives resistance to CDK4/6 inhibitors. Increased expression of SLC36A1 reflects two distinct mechanisms: (i) Rb loss, which drives SLC36A1 via reduced suppression of E2f; (ii) fragile X mental retardation syndrome-associated protein 1 overexpression, which promotes SLC36A1 translation and subsequently mTORC1. Last, we demonstrate that a combination of a CDK4/6 inhibitor with an mTORC1 inhibitor has increased therapeutic efficacy in vivo, providing an important avenue for improved therapeutic intervention in aggressive melanoma.


Figures

Fig. 1
Fig. 1. Comprehensive analyses of CR cells.
(A) Scheme for exposure of melanoma-derived cell lines to palbociclib and outcome. (B) Heat map with hierarchical clustering of samples from 1205Lu cells (control), 1205Lu cells treated with palbociclib (1 μM) for 1 or 8 days, and CR clones (1205CR1, 1205CR2, 1205CR6, and 1205CR7) (left) and TE7 cells treated with palbociclib (1 μM) for 1 or 8 days and CR cells (TE7CR) (right). (C) Venn diagrams of differentially expressed genes of samples [dimethyl sulfoxide (DMSO) versus palbociclib treatment (1 μM) for 8 days (control versus control + CDK4/6i), palbociclib treatment (1 μM) for 8 days versus 1205CR1, 1205CR2, 1205CR6, or 1205CR7 (CDK4/6i versus CR1, CR2, CR6, or CR7), control + palbociclib (CDK4/6i) versus CR1, CR2, CR6, or CR7 (q < 0.1)]. (D) Heat map of 1205Lu cells from (B) for expression of E2f target genes and mTOR signaling. (E) GSEA analysis of CR cells compared to senescent cells [palbociclib treatment (1 μM) for 8 days] for E2f1 targets (P < 0.001), E2f3 targets (P < 0.001), and mTOR signaling (P = 0.03). (F and G) Samples from 1205Lu cells with or without treatment of palbociclib (1 μM) for 24 hours or 8 days were prepared. (F) Quantitative polymerase chain reaction (qPCR) analysis using sets of primers for CDK1, FEN1, and PCNA. Data were normalized by glyceraldehyde-3-phosphate dehydrogenase (GAPDH) and represent means ± SD. *P < 0.01 (one-sample two-tailed Student’s t test; n = 3). (G) Western blot analysis using antibodies to CDK1, FEN1, PCNA, and β-actin.
Fig. 2
Fig. 2. Different resistance mechanisms between 1205CR1-2 and 1205CR6-7 cells.
(A) Western blot analysis of lysates from 1205Lu cells treated with or without palbociclib (1 μM) for 1 or 8 days, and CR clones proliferating with palbociclib (1 μM) (1205CR1, 1205CR2, 1205CR6, and 1205CR7) using antibodies indicated on the right of the panel. (B) Western blot analysis of lysates from 1205CR1-2 cells overexpressing vehicle (control) or Rb1 using antibodies to Rb1 and β-actin. (C) 1205CR1-2 cells were subjected to BrdU incorporation for 45 min following introduction of Rb1 for 48 hours. BrdU-positive cells were determined by fluorescence-activated cell sorting (FACS) analysis. Data represent means ± SD. *P < 0.01 (two-tailed Student’s t test; n = 3). (D) Quantification of senescence-associated β-galactosidase (SA-β-gal)–positive cells in 1205CR1-2 with or without Rb1. Data represent means ± SD. *P < 0.01 (two-tailed Student’s t test; n = 3). (E) 1205Lu, 1205CR1, 1205CR2, 1205CR6, and 1205CR7 were subjected to a 45-min BrdU pulse following exposure to AZD5438 (AZD) treatment (0.5 μM). BrdU-positive cells were determined by FACS analysis and quantified; data represent means ± SD, *P < 0.01 (two-tailed Student’s t test; n = 3). (F) Quantification of SA-β-gal–positive cells in 1205Lu, 1205CR1, 1205CR2, 1205CR6, and 1205CR7 cells treated with AZD5438 (0.5 μM) or palbociclib (1 μM) for 8 days; data represent means ± SD, *P < 0.01 (two-tailed Student’s t test; n = 3). (G) Western blot analysis of lysates from 1205Lu, 1205CR1, 1205CR2, 1205CR6, and 1205CR7 cells after treatment of AZD5438 (0.5 μM) for 24 hours using antibodies indicated on the right of the panel. (H) qPCR analysis of samples from (G) using sets of primers for CDK1, FEN1, and PCNA. Data were normalized by GAPDH and represent means ± SD, *P < 0.01 (two-tailed Student’s t test; n = 3) and **P < 0.05 (two-tailed Student’s t test; n = 3).
Fig. 3
Fig. 3. SLC36A1 overrides CDK4/6i-induced senescence.
(A) Clustering of SLC transporters from 1205Lu cells treated with or without palbociclib (1 μM) for 1 day and 1205CR1, 1205CR2, 1205CR6, and 1205CR7 cells proliferating with palbociclib (1 μM) for 8 days. (B) qPCR analysis of samples from 1205Lu cells treated with or without palbociclib (1 μM) for 8 days or in 1205CR1, 1205CR2, 1205CR6, and 1205CR7 cells proliferating with palbociclib (1 μM) using a set of primers for SLC36A1. Data were normalized by GAPDH and represent means ± SD. *P < 0.01 (two-tailed Student’s t test; n = 3). (C) Western blot analysis of lysates from (B) for SLC36A1 and β-actin. The numbers indicate quantifications of SLC36A1 determined by SLC36A1/β-actin ratio. (D) Representative images of IHC staining of sections from xenograft tumors treated with either vehicle or palbociclib (1 μM) or tumors resistance to CDK4/6i for SLC36A1. Scale bars, 100 μm. The numbers indicate quantification of SLC36A1 intensity determined by IHC scoring (see Materials and Methods) from three independent experiments. (E) Western blot analysis of lysates from 1205Lu cells introduced with shcontrol or shSLC36A1 using antibodies to SLC36A1 and β-actin. (F) Clonogenic colony formation assay of cells from (E) treated with or without palbociclib (1 μM) for 8 days. The numbers indicate quantification of colonies from three independent experiments. (G) Western blot analysis of lysates from 1205Lu cells infected with empty vector (control) or SLC36A1 using antibodies to SLC36A1, p-S6K, and β-actin. (H) Clonogenic colony formation assay of cells from (G) treated with rapamycin (50 nM), palbociclib (1 μM), or rapamycin (50 nM) + palbociclib (1 μM) for 8 days. The numbers indicate quantification of colonies from three independent experiments. (I) Representative images of SA-β-gal staining from (G) treated with palbociclib (1 μM) for 8 days. (J) Quantification of SA-β-gal–positive cells from (I). Data represent means ± SD. *P < 0.01 (two-tailed Student’s t test; n = 3). (K) Western blot analysis of lysates from WM983B, WM239A, 451Lu, and WM3918 cells infected with empty vector (control) or SLC36A1 using antibodies to SLC36A1 and β-actin. (L) Quantification of SA-β-gal–positive cells from (K) and parental cells treated with or without palbociclib (1 μM) for 8 days. Data represent means ± SD. *P < 0.01 (two-tailed Student’s t test; n = 3). (M) Western blot analysis of lysates from 1205Lu, 1205CR1, 1205CR2, 1205CR6, and 1205CR7 cells transfected with siControl or siSLC36A1 using antibodies against SLC36A1, p-S6, and β-actin. (N) Quantification of SA-β-gal–positive cells after 8 days after transfection; data represent means ± SD, *P < 0.01 (two-tailed Student’s t test; n = 3).
Fig. 4
Fig. 4. SLC36A1 is an E2f target gene.
(A) Schematic of the SLC36A1 promoter. Boxes indicate the positions of putative E2f1 binding motifs. (B) Luciferase assays of lysates from HEK293T cells transfected with luciferase reporter construct containing SLC36A1 promoter (Reporter) and secreted alkaline phosphatase (SEAP) together with either empty vector, E2f1, E2f1 E132 (E2f1m), E2f2, or E2f3a. Data were normalized by SEAP for each sample (top). Data were normalized by SEAP and represent means ± SD, *P < 0.01 (one-sample two-tailed Student’s t test; n = 3). Western blot analysis of samples from (B) (top) using antibodies indicated on the right of the panel (bottom). (C) Luciferase assays of lysates from HEK293T cells transfected with Reporter or Reporter lacking of putative E2F1 binding sites (Reporter ΔB) and SEAP together with either empty vector or E2f1. Data were normalized by SEAP and represent means ± SD. *P < 0.01 (one-sample two-tailed Student’s t test; n = 3). (D) Luciferase assays of lysates from HEK293T cells transfected with Reporter and SEAP together with different amount plasmids of E2f1, E2f2, or E2f3a (0, 0.2, 0.5, 2, and 5 μg). Data were normalized by SEAP for each sample (top). Western blot analysis of samples from (C) (top) using antibodies indicated on the right of the panel (bottom). (E to I) The fixed chromatin of 1205Lu cells with or without treatment of palbociclib (1 μM) for 24 hours, 1205CR1 proliferating with palbociclib (1 μM), 1205CR6 proliferating with palbociclib (1 μM), 1205Lu cells introduced shRb with or without treatment of palbociclib (1 μM) for 24 hours, and 983BR cells with or without treatment of palbociclib (1 μM) for 24 hours was analyzed by chromatin immunoprecipitation (ChIP) assay using specific antibodies to control immunoglobulin G (IgG) (gray bars) or E2f1 (black bars). Precipitated DNA was subjected to qPCR analysis using sets of primers recognizing sequences that flank the E2f1 putative binding sites (SLC36A1) (E) or sequences that do not contain E2f motifs (negative control) (H). E2f binding to dihydrofolate reductase (DHFR) (F), CDC6 (G), or SLC38A9 (I) served as controls. Data were normalized by IgG and represent means ± SD, *P < 0.01 (two-tailed Student’s t test; n = 3). N.S., not significant (n = 3).
Fig. 5
Fig. 5. FXR1 overrides CDK4/6i-induced senescence through SLC36A1.
(A) Western blot analysis of lysates from 1205Lu cells treated with or without palbociclib (1 μM) for 8 days and 1205CR1, 1205CR2, 1205CR6, and 1205CR7 cells using antibodies to FXR1 and β-actin. The numbers indicate quantifications of FXR1 determined by FXR1/β-actin ratio. (B) Representative images of IHC staining of sections from xenograft tumors treated with either vehicle or palbociclib (1 μM) or tumors resistance to CDK4/6i for FXR1. Scale bars, 50 μm. The numbers indicate quantification of FXR1 intensity determined by IHC scoring (see Materials and Methods) from three independent experiments. (C) Western blot analysis of lysates from 1205CR6-7 cells with or without shFXR1 using antibodies indicated on the right of the panels. (D) Fractions from HEK293T cells with or without shFXR1 were collected by density gradient fractionation. Purified RNA was subjected to qRT-PCR analysis using sets of primers for SLC36A1 (top) and RPS18S (bottom). This experiment was performed three times, and representative data were shown. RBP, ribose-binding protein. (E) Lysates of 1205Lu cells were analyzed by RIP assay using antibodies to control IgG or FXR1 and subjected to qRT-PCR using sets of primers for SLC36A1, p21, and p27. Data were normalized by IgG and represent means ± SD, *P < 0.01 (one-sample two-tailed Student’s t test; n = 3). (F) Western blot analysis of the lysates from (E) using antibodies to FXR1. (G) Quantification of SA-β-gal–positive cells in 1205CR6-7 cells introduced with shcontrol (control) or shFXR1. Data represent means ± SD, *P < 0.01 (two-tailed Student’s t test; n = 3). (H) Western blot analysis of lysates from 1205Lu cells introduced with empty vector (control) or FXR1 using antibodies to FXR1, Rb, and ribosomal S3. (I) Quantification of SA-β-gal–positive cells in 1205Lu cells introduced with vehicle (control) or FXR1 with or without palbociclib treatment (1 μM) for 8 days. Data represent means ± SD, *P < 0.01 (two-tailed Student’s t test; n = 3). (J) Western blot analysis of lysates from 1205Lu cells with shcontrol or shFXR1 using antibodies to FXR1 and β-actin. The numbers indicate quantifications of FXR1 determined by FXR1/β-actin ratio. (K) Clonogenic colony formation assay of cells from (H) and (J) treated with or without palbociclib (1 μM) for 8 days. The numbers indicate quantification of colonies from three independent experiments. (L) Western blot analysis of lysates from 1205Lu cells infected with shcontrol, shFXR1, SLC36A1, or shFXR1 + SLC36A1 using antibodies to FXR1, SLC36A1, and β-actin. (M) Quantification of SA-β-gal–positive cells from (L). Data represent means ± SD, *P < 0.01 (two-tailed Student’s t test; n = 3).
Fig. 6
Fig. 6. Synergistic effects of a CDK4/6i and an mTORC1 inhibitor.
(A) Cell proliferation assay of 1205Lu cells treated with palbociclib (left) or ribociclib (right) at varying concentrations (0, 0.01, 0.03, 0.1, 0.3, and 1 μM) and everolimus at varying concentrations (0, 0.003, 0.01, 0.03, 0.1, 0.3, and 1 μM) for 4 days. Red indicates high cell number, and green color indicates low cell number. (B) A total of 2 × 10⁶ cells of 1205Lu cells were subcutaneously injected into 6-week-old SCID mice. Treatments (palbociclib; 90 mg/kg) by oral gavage, everolimus (10 mg/kg) by intraperitoneal injection, or palbociclib (45 mg/kg) + everolimus (10 mg/kg) were initiated when tumors reached to 2 mm of diameter as indicated with arrows. Each group, 10 tumors; tumor volumes were measured every 2 days. Data represent means ± SD from n = 10 tumors per group, *P < 0.001 (two-tailed Student’s t-test; control versus palbociclib or everolimus, n = 10) and **P < 0.001 (two-tailed Student’s t-test; palbociclib versus palbociclib + everolimus, n = 10). (C) Representative images of SA-β-gal staining in fresh primary tumors culture on the dental sponges in cell culture medium with palbociclib (1 μM), rapamycin (50 nM), or palbociclib (1 μM) + rapamycin (50 nM) for 8 days (n = 3). Scale bars, 50 μm. (D) Quantification of SA-β-gal–positive cells from (C). Data represent means ± SD, *P < 0.01 (two-tailed Student’s t test; n = 3). (E) Model of CDK4/6i-induced senescence and its acquired resistance in melanoma.

References

    1. Choi Y. J., Li X., Hydbring P., Sanda T., Stefano J., Christie A. L., Signoretti S., Look A. T., Kung A. L., von Boehmer H., Sicinski P., The requirement for cyclin D function in tumor maintenance. Cancer Cell 22, 438–451 (2012). - PMC - PubMed
    1. Ackermann J., Frutschi M., Kaloulis K., McKee T., Trumpp A., Beermann F., Metastasizing melanoma formation caused by expression of activated N-RasQ61K on an INK4a-deficient background. Cancer Res. 65, 4005–4011 (2005). - PubMed
    1. Ibrahim N., Haluska F. G., Molecular pathogenesis of cutaneous melanocytic neoplasms. Annu. Rev. Pathol. 4, 551–579 (2009). - PubMed
    1. Sauter E. R., Yeo U.-C., von Stemm A., Zhu W., Litwin S., Tichansky D. S., Pistritto G., Nesbit M., Pinkel D., Herlyn M., Bastian B. C., Cyclin D1 is a candidate oncogene in cutaneous melanoma. Cancer Res. 62, 3200–3206 (2002). - PubMed
    1. Lee E. K., Lian Z., D’Andrea K., Letrero R., Sheng W. Q., Liu S., Diehl J. N., Pytel D., Barbash O., Schuchter L., Amaravaradi R., Xu X., Herlyn M., Nathanson K. L., Diehl J. A., The FBXO4 tumor suppressor functions as a barrier to BRAFV600E-dependent metastatic melanoma. Mol. Cell. Biol. 33, 4422–4433 (2013). - PMC - PubMed

Publication types

MeSH terms