

Reversal of the Warburg phenomenon in chemoprevention of prostate cancer by sulforaphane
- PMID: 31555797
- PMCID: PMC7175465
- DOI: 10.1093/carcin/bgz155
Reversal of the Warburg phenomenon in chemoprevention of prostate cancer by sulforaphane
Abstract
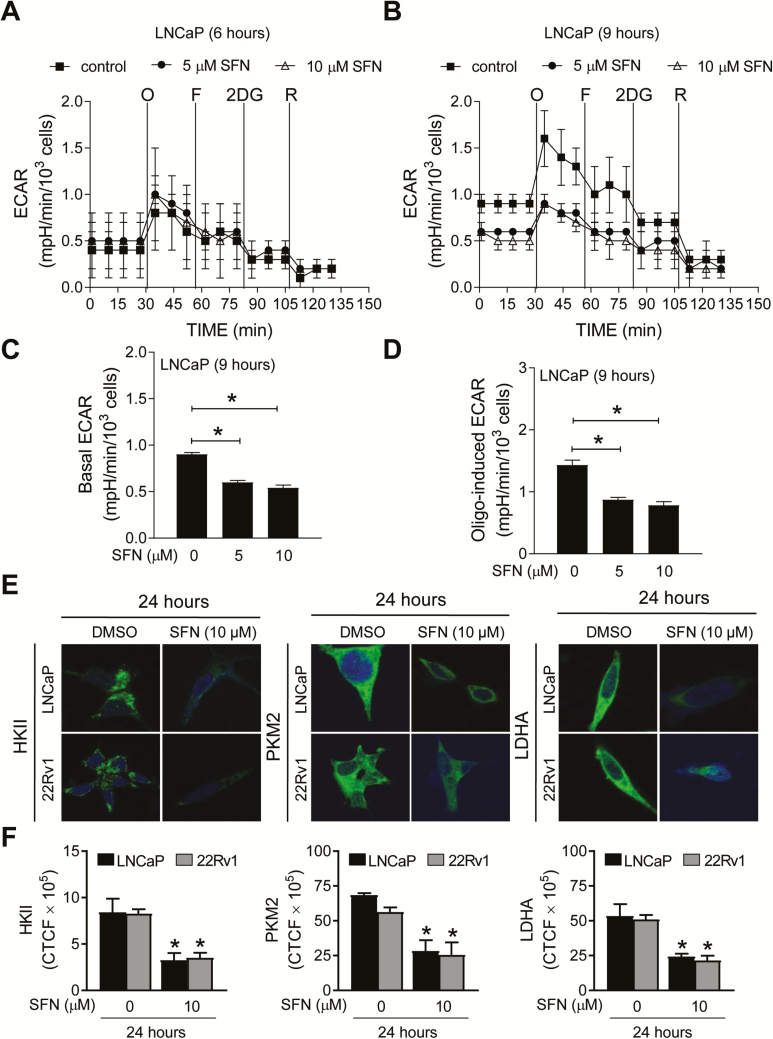
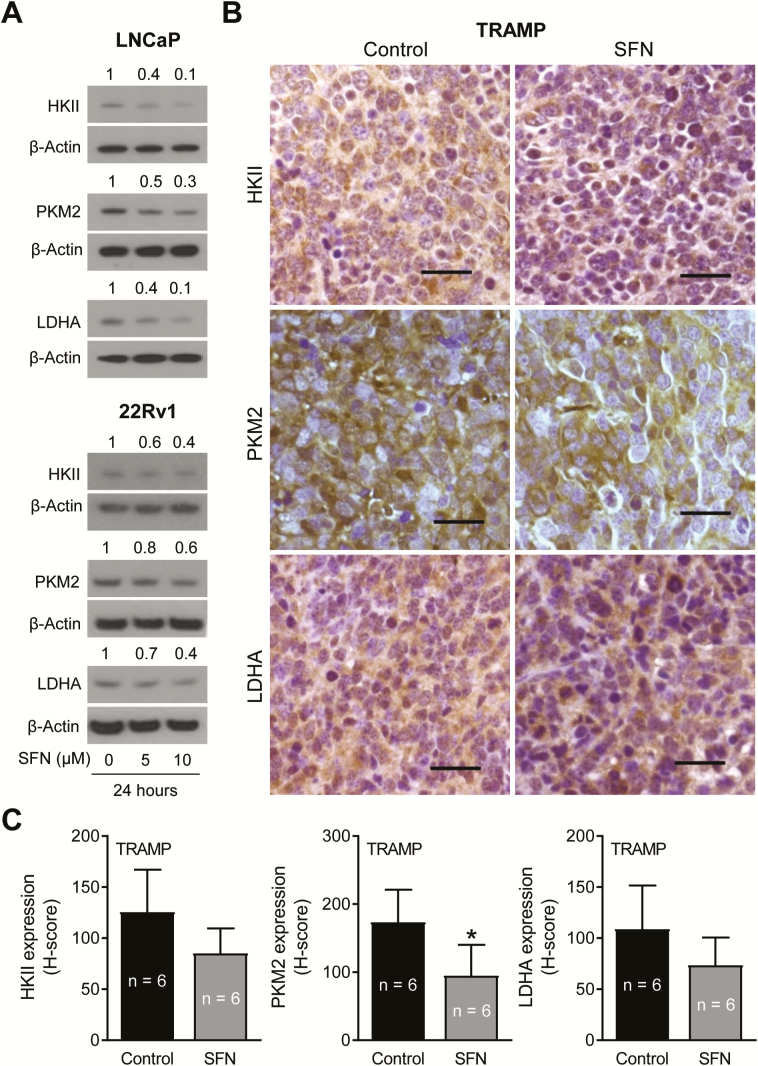
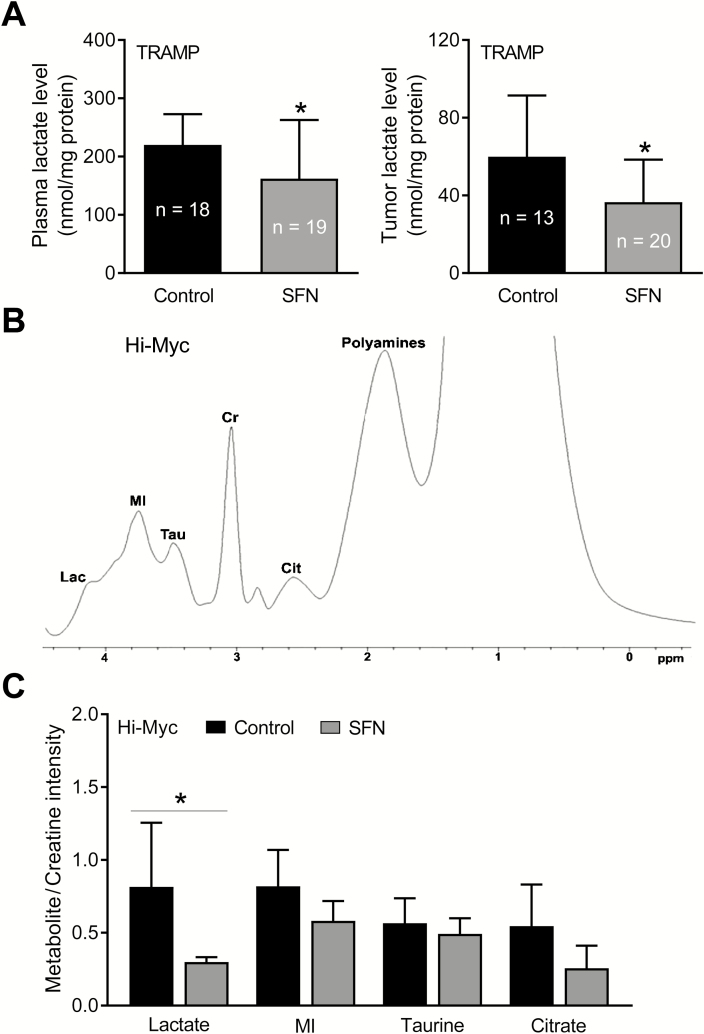
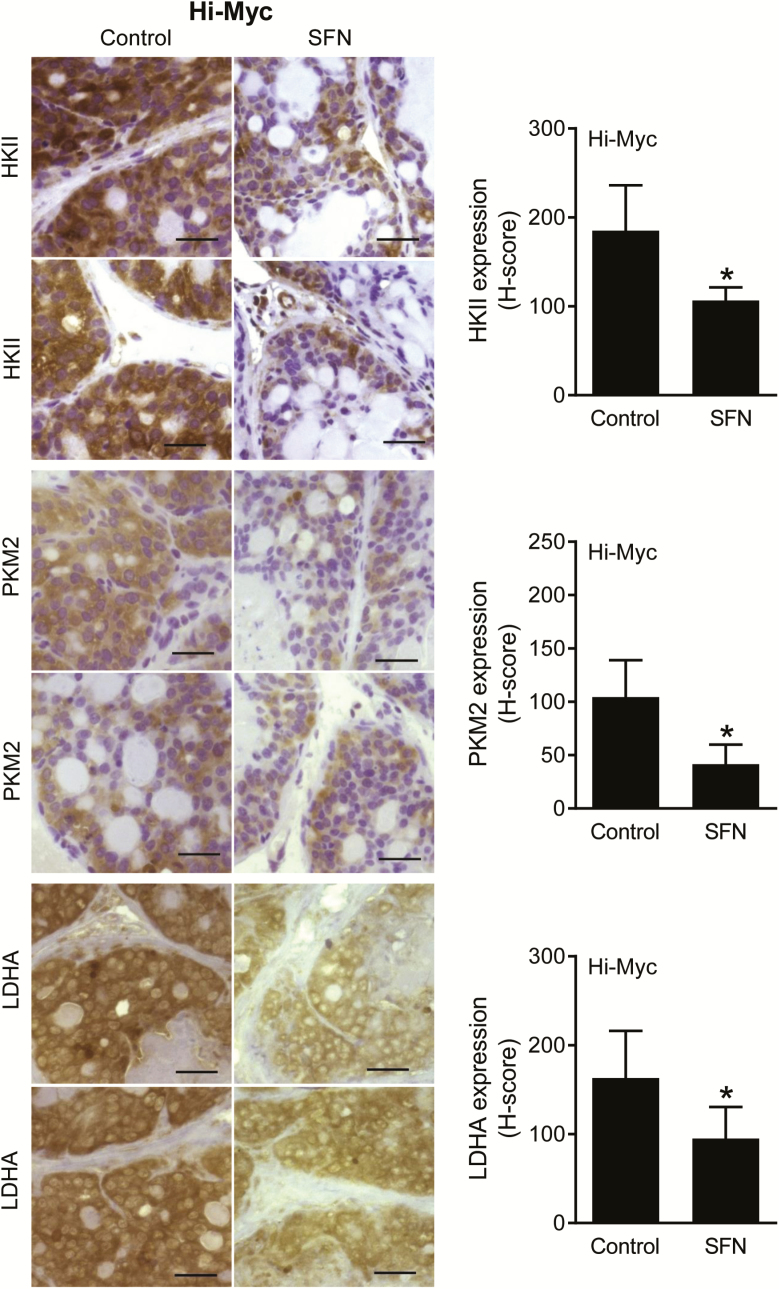
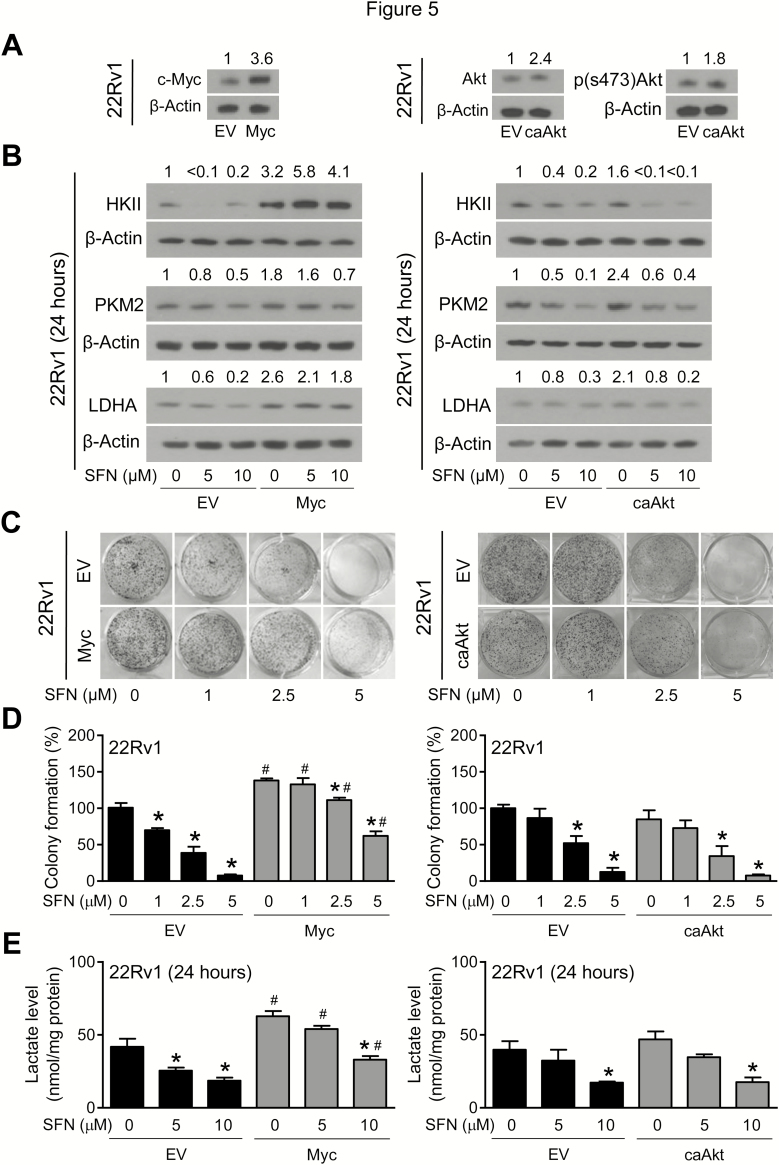
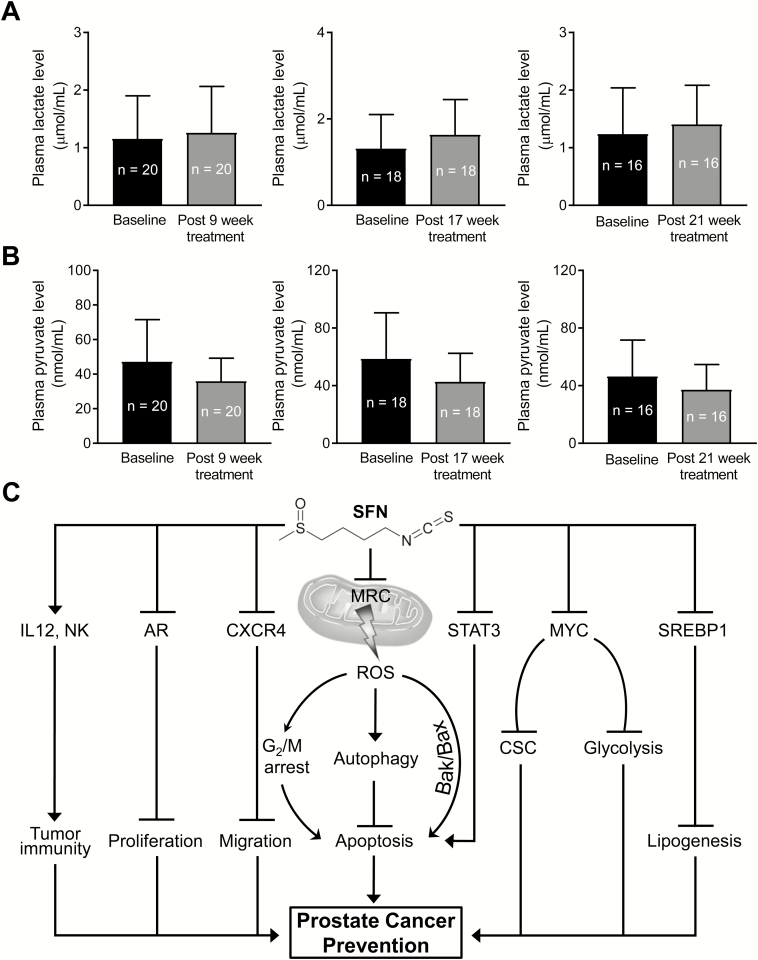
Inhibition of metabolic re-programming represents an attractive approach for prevention of prostate cancer. Studies have implicated increased synthesis of fatty acids or glycolysis in pathogenesis of human prostate cancers. We have shown previously that prostate cancer prevention by sulforaphane (SFN) in Transgenic Adenocarcinoma of Mouse Prostate (TRAMP) model is associated with inhibition of fatty acid metabolism. This study utilized human prostate cancer cell lines (LNCaP, 22Rv1 and PC-3), two different transgenic mouse models (TRAMP and Hi-Myc) and plasma specimens from a clinical study to explore the glycolysis inhibition potential of SFN. We found that SFN treatment: (i) decreased real-time extracellular acidification rate in LNCaP, but not in PC-3 cell line; (ii) significantly downregulated expression of hexokinase II (HKII), pyruvate kinase M2 and/or lactate dehydrogenase A (LDHA) in vitro in cells and in vivo in neoplastic lesions in the prostate of TRAMP and Hi-Myc mice; and (iii) significantly suppressed glycolysis in prostate of Hi-Myc mice as measured by ex vivo1H magnetic resonance spectroscopy. SFN treatment did not decrease glucose uptake or expression of glucose transporters in cells. Overexpression of c-Myc, but not constitutively active Akt, conferred protection against SFN-mediated downregulation of HKII and LDHA protein expression and suppression of lactate levels. Examination of plasma lactate levels in prostate cancer patients following administration of an SFN-rich broccoli sprout extract failed to show declines in its levels. Additional clinical trials are needed to determine whether SFN treatment can decrease lactate production in human prostate tumors.
© The Author(s) 2019. Published by Oxford University Press. All rights reserved. For Permissions, please email: journals.permissions@oup.com.
Figures
Similar articles
-
Prostate cancer chemoprevention by sulforaphane in a preclinical mouse model is associated with inhibition of fatty acid metabolism.Carcinogenesis. 2018 May 28;39(6):826-837. doi: 10.1093/carcin/bgy051. Carcinogenesis. 2018. PMID: 29668854 Free PMC article.
-
Inhibition of Glycolysis in Prostate Cancer Chemoprevention by Phenethyl Isothiocyanate.Cancer Prev Res (Phila). 2018 Jun;11(6):337-346. doi: 10.1158/1940-6207.CAPR-17-0389. Epub 2018 Mar 15. Cancer Prev Res (Phila). 2018. PMID: 29545400 Free PMC article.
-
CXCR4 is a novel target of cancer chemopreventative isothiocyanates in prostate cancer cells.Cancer Prev Res (Phila). 2015 May;8(5):365-74. doi: 10.1158/1940-6207.CAPR-14-0386. Epub 2015 Feb 23. Cancer Prev Res (Phila). 2015. PMID: 25712054 Free PMC article.
-
Transgenic Adenocarcinoma of the Mouse Prostate (TRAMP) model: A good alternative to study PCa progression and chemoprevention approaches.Life Sci. 2019 Jan 15;217:141-147. doi: 10.1016/j.lfs.2018.12.002. Epub 2018 Dec 4. Life Sci. 2019. PMID: 30528182 Review.
-
Epigenetic impact of dietary isothiocyanates in cancer chemoprevention.Curr Opin Clin Nutr Metab Care. 2013 Jul;16(4):405-10. doi: 10.1097/MCO.0b013e328362014e. Curr Opin Clin Nutr Metab Care. 2013. PMID: 23657153 Review.
Cited by
-
TRIM47 promotes the Warburg effect and reduces ferroptosis in prostate cancer by FBP1 and FOXO1.Transl Androl Urol. 2024 Sep 30;13(9):1991-2004. doi: 10.21037/tau-23-605. Epub 2024 Sep 26. Transl Androl Urol. 2024. PMID: 39434735 Free PMC article.
-
Comprehensive Analysis of the Relationship Between Metabolic Reprogramming and Immune Function in Prostate Cancer.Onco Targets Ther. 2021 May 18;14:3251-3266. doi: 10.2147/OTT.S304298. eCollection 2021. Onco Targets Ther. 2021. PMID: 34040390 Free PMC article.
-
A novel metabolic function of Myc in regulation of fatty acid synthesis in prostate cancer.Oncogene. 2021 Jan;40(3):592-602. doi: 10.1038/s41388-020-01553-z. Epub 2020 Nov 16. Oncogene. 2021. PMID: 33199826 Free PMC article.
-
Oxidative stress and redox signaling in CRPC progression: therapeutic potential of clinically-tested Nrf2-activators.Cancer Drug Resist. 2021 Mar 19;4(1):96-124. doi: 10.20517/cdr.2020.71. eCollection 2021. Cancer Drug Resist. 2021. PMID: 35582006 Free PMC article. Review.
-
Targeting Prostate Cancer Metabolism Through Transcriptional and Epigenetic Modulation: A Multi-Target Approach to Therapeutic Innovation.Int J Mol Sci. 2025 Jun 23;26(13):6013. doi: 10.3390/ijms26136013. Int J Mol Sci. 2025. PMID: 40649790 Free PMC article. Review.
References
-
- Siegel R.L., et al. (2018) Cancer statistics, 2018. CA. Cancer J. Clin., 68, 7–30. - PubMed
-
- Hanahan D., et al. (2011) Hallmarks of cancer: the next generation. Cell, 144, 646–674. - PubMed
-
- Liu Y. (2006) Fatty acid oxidation is a dominant bioenergetic pathway in prostate cancer. Prostate Cancer Prostatic Dis., 9, 230–234. - PubMed
-
- Rossi S., et al. (2003) Fatty acid synthase expression defines distinct molecular signatures in prostate cancer. Mol. Cancer Res., 1, 707–715. - PubMed
Publication types
MeSH terms
Substances
Grants and funding
LinkOut - more resources
Full Text Sources
Medical
Molecular Biology Databases
Research Materials
Miscellaneous
