. 2019 Nov;33(11):12915-12928.
doi: 10.1096/fj.201900803R. Epub 2019 Sep 26.

Long noncoding RNA SMAD5-AS1 acts as a microRNA-106a-5p sponge to promote epithelial mesenchymal transition in nasopharyngeal carcinoma

Affiliations

Long noncoding RNA SMAD5-AS1 acts as a microRNA-106a-5p sponge to promote epithelial mesenchymal transition in nasopharyngeal carcinoma

Ying-Juan Zheng et al. FASEB J. 2019 Nov.

Abstract

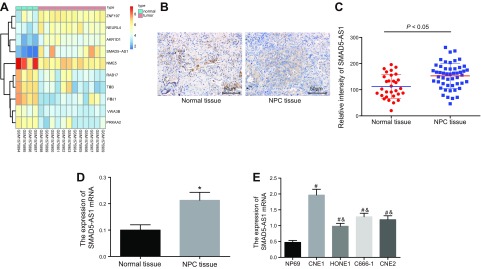
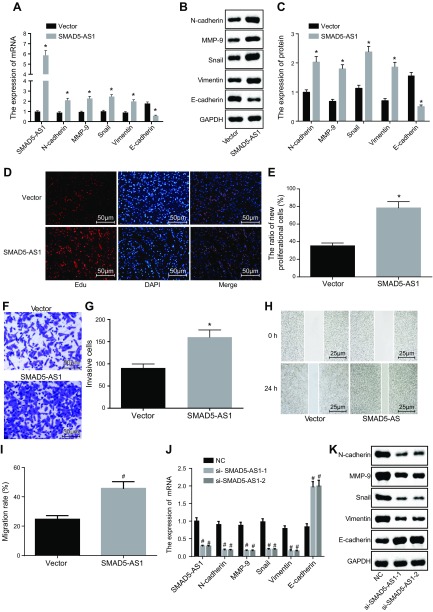
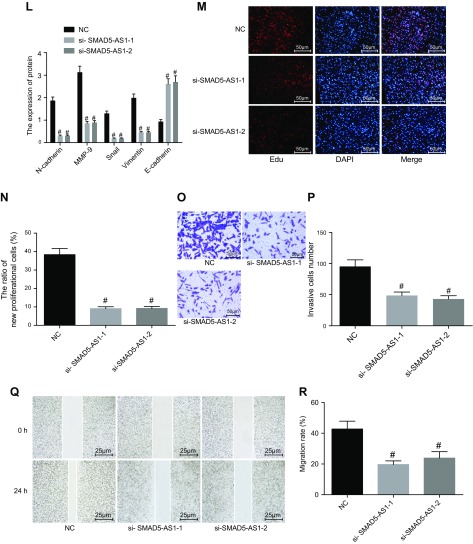
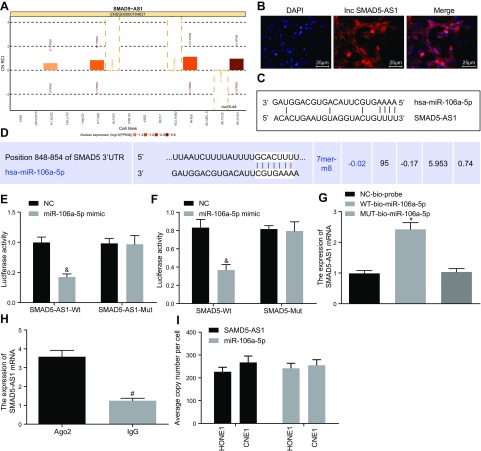
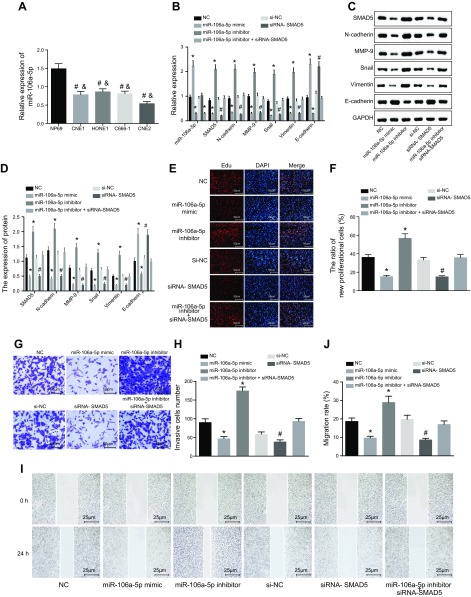
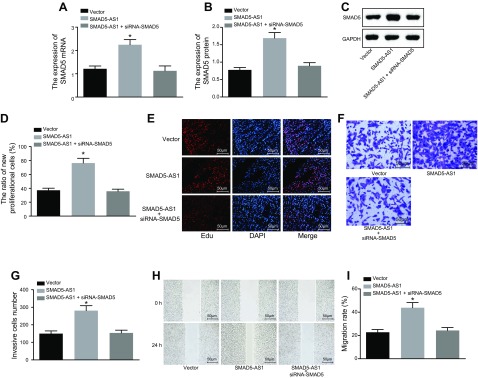
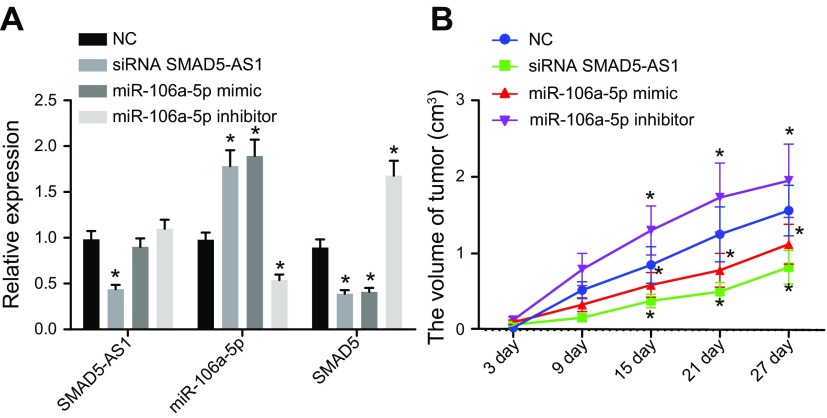
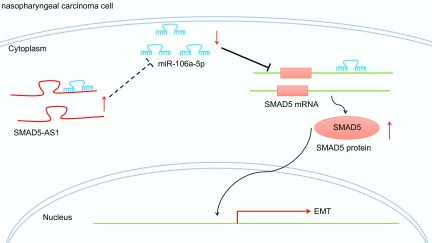
Nasopharyngeal carcinoma (NPC) is a malignant epithelial cancer of the head and neck with high prevalence in southern China, which is accompanied by notable invasiveness and metastasis. Long noncoding RNAs (lncRNAs) participate in the progression of various cancers including NPC. Microarray-based analysis identified highly expressed lncRNA mothers against decapentaplegic homolog 5 (SMAD5)-antisense RNA 1 (AS1) related to NPC. Interestingly, it is found that SMAD5-AS1 competitively bound to microRNA (miR)-106a-5p to regulate SMAD5. Herein, the study aimed to clarify the role of SMAD5-AS1/miR-106a-5p/SMAD5 axis in the process of epithelial mesenchymal transition (EMT) in NPC. SMAD5-AS1 was highly expressed and miR-106a-5p was poorly expressed in NPC tissues and cell lines. The NPC cells were treated with a series of small interfering RNAs, mimics, or inhibitors to explore the effects of SMAD5-AS1, SMAD5, and miR-106a-5p on EMT, cell proliferation, migration, and invasion in NPC. Of note, SMAD5-AS1 silencing or miR-106a-5p overexpression reduced expression of N-cadherin, matrix metallopeptidase 9, Snail, and Vimentin while elevating E-cadherin expression, thus inhibiting EMT, cell proliferation, migration, and invasion in NPC by down-regulation of SMAD5. Moreover, SMAD5 silencing could reduce the ability of EMT induced by SMAD5-AS1 up-regulation. SMAD5-AS1 silencing or miR-106a-5p elevation inhibited tumorigenesis in nude mice. Taken together, SMAD5-AS1 silencing suppressed EMT, cell proliferation, migration, and invasion in NPC by elevating miR-106a-5p to down-regulate SMAD5, which provided a novel therapeutic target for NPC treatment.-Zheng, Y.-J., Zhao, J.-Y., Liang, T.-S., Wang, P., Wang, J., Yang, D.-K., Liu, Z.-S. Long noncoding RNA SMAD5-AS1 acts as a microRNA-106a-5p sponge to promote epithelial mesenchymal transition in nasopharyngeal carcinoma.

Keywords: SMAD5; ceRNA; invasion; migration; proliferation.


Conflict of interest statement

Y.-J.Z. and J.-Y.Z. are regarded as co-first authors. The authors declare no conflicts of interest.

Figures

Figure 1
Figure 1
SMAD5-AS1 is highly expressed in NPC tissues and cells. A) The heatmap of NPC-related gene expression dataset GSE64634. B, C) Expression of SMAD5-AS1 in the NPC tissues (n = 50) and the normal nasopharyngeal epithelial tissues (n = 30) determined by RNA in situ hybridization assay. D) The expression of SMAD5-AS1 in the NPC tissues and the normal nasopharyngeal epithelial tissues determined by qRT-PCR. E) The expression of SMAD5-AS1 in the normal cell line and the NPC cell lines determined by qRT-PCR. Measurement data were expressed as means ± sd. Comparisons between NPC tissues and normal nasopharyngeal epithelial tissues were analyzed via Student’s t test and the comparisons among multiple groups were analyzed by 1-way ANOVA, followed by Tukey’s’s post hoc test. The experiment was repeated 3 times. *P < 0.05 vs. the normal nasopharyngeal epithelial tissues; #P < 0.05 vs. the NP69 cell line; &P < 0.05 vs. the CNE1 cell line ZNF197, zinc finger protein 197; NEURL4, neuralized homologue 4; AKR1D1, aldo-keto reductase 1D1; SMAD5-AS1, SMAD5 antisense RNA 1; NME5, non-metastatic cells 5; RAB17, ras-related protein 17; PRKAA2, activated protein kinase-alpha2.
Figure 2
Figure 2
SMAD5-AS1 silencing inhibits cell proliferation, invasion, migration, and EMT in NPC. A) The expression of SMAD5-AS1, E-cadherin, N-cadherin, MMP-9, Snail, and Vimentin in cells treated with pc-DNA SMAD5-AS1 determined by qRT-PCR. B) Gray value analysis of E-cadherin, N-cadherin, MMP-9, Snail, and Vimentin in cells treated with pc-DNA SMAD5-AS1. C) Protein expression of E-cadherin, N-cadherin, MMP-9, Snail, and Vimentin detected by Western blot analysis in cells treated with pc-DNA SMAD5-AS1. D, E) Cell proliferation of cells treated with pc-DNA SMAD5-AS1 measured by EdU assay. F, G) Cell invasion of cells treated with pc-DNA SMAD5-AS1 evaluated by Transwell assay. H, I) Cell migration of cells treated with pc-DNA SMAD5-AS1 measured by scratch test. J) The expression of SMAD5-AS1, E-cadherin, N-cadherin, MMP-9, Snail, and Vimentin in cells treated with empty vector, si-SMAD5-AS1-1, and si-SMAD5-AS1-2 determined by qRT-PCR. K) Gray value analysis of E-cadherin, N-cadherin, MMP-9, Snail, and Vimentin in cells treated with empty vector NC, si-SMAD5-AS1-1, and si-SMAD5-AS1-2. L) Protein expression of E-cadherin, N-cadherin, MMP-9, Snail, and Vimentin in cells treated with empty vector, si-SMAD5-AS1-1, and si-SMAD5-AS1-2 detected by Western blot analysis. M, N) Cell proliferation of cells treated with empty vector, si-SMAD5-AS1-1, and si-SMAD5-AS1-2 estimated by EdU assay. O, P) Cell invasion of cells treated with empty vector, si-SMAD5-AS1-1, and si-SMAD5-AS1-2 measured by Transwell assay. Q, R) Cell migration of cells treated with empty vector, si-SMAD5-AS1-1, and si-SMAD5-AS1-2 detected by scratch test. Measurement data were expressed as means ± SD. Comparison between 2 groups was analyzed by nonpaired Student's t test and comparisons among multiple groups were analyzed by 1-way ANOVA, followed by Tukey's post hoc test. The experiment was repeated 3 times. *P < 0.05 vs. the vector group; #P < 0.05 vs. the NC group.
Figure 2
Figure 2
SMAD5-AS1 silencing inhibits cell proliferation, invasion, migration, and EMT in NPC. A) The expression of SMAD5-AS1, E-cadherin, N-cadherin, MMP-9, Snail, and Vimentin in cells treated with pc-DNA SMAD5-AS1 determined by qRT-PCR. B) Gray value analysis of E-cadherin, N-cadherin, MMP-9, Snail, and Vimentin in cells treated with pc-DNA SMAD5-AS1. C) Protein expression of E-cadherin, N-cadherin, MMP-9, Snail, and Vimentin detected by Western blot analysis in cells treated with pc-DNA SMAD5-AS1. D, E) Cell proliferation of cells treated with pc-DNA SMAD5-AS1 measured by EdU assay. F, G) Cell invasion of cells treated with pc-DNA SMAD5-AS1 evaluated by Transwell assay. H, I) Cell migration of cells treated with pc-DNA SMAD5-AS1 measured by scratch test. J) The expression of SMAD5-AS1, E-cadherin, N-cadherin, MMP-9, Snail, and Vimentin in cells treated with empty vector, si-SMAD5-AS1-1, and si-SMAD5-AS1-2 determined by qRT-PCR. K) Gray value analysis of E-cadherin, N-cadherin, MMP-9, Snail, and Vimentin in cells treated with empty vector NC, si-SMAD5-AS1-1, and si-SMAD5-AS1-2. L) Protein expression of E-cadherin, N-cadherin, MMP-9, Snail, and Vimentin in cells treated with empty vector, si-SMAD5-AS1-1, and si-SMAD5-AS1-2 detected by Western blot analysis. M, N) Cell proliferation of cells treated with empty vector, si-SMAD5-AS1-1, and si-SMAD5-AS1-2 estimated by EdU assay. O, P) Cell invasion of cells treated with empty vector, si-SMAD5-AS1-1, and si-SMAD5-AS1-2 measured by Transwell assay. Q, R) Cell migration of cells treated with empty vector, si-SMAD5-AS1-1, and si-SMAD5-AS1-2 detected by scratch test. Measurement data were expressed as means ± SD. Comparison between 2 groups was analyzed by nonpaired Student's t test and comparisons among multiple groups were analyzed by 1-way ANOVA, followed by Tukey's post hoc test. The experiment was repeated 3 times. *P < 0.05 vs. the vector group; #P < 0.05 vs. the NC group.
Figure 3
Figure 3
SMAD5-AS1 increases SMAD5 expression by competitively binding to miR-106a-5p. A) Subcellular location prediction of SMAD5-AS1. B) Subcellular location of SMAD5-AS1 detected by FISH assay, DAPI represented nuclear localization, Inc displayed localization of lncRNA SMAD5-AS1, and Merge represented the colocalization of nucleus and SMAD5-AS1. C) The relationship between SMAD5-AS1 and miR-106a-5p predicted by online website. D) The relationship between miR-106a-5p and SMAD5 predicted by online website. E) The relationship between SMAD5-AS1 and miR-106a-5p verified by dual luciferase reporter gene assay. F) The targeting relationship between miR-106a-5p and SMAD5 confirmed by dual luciferase reporter gene assay. G) The binding of SMAD5-AS1 and miR-106a-5p detected by RNA pull-down. H) The binding of SMAD5-AS1 and Ago2 was examined by RNA-IP. I) The absolute quantitation of SAMD5-AS1 and miR-106a-5p in HONE1 and CNE1 cell lines. Measurement data were expressed as means ± sd. Comparison between 2 groups was analyzed by nonpaired t test and comparisons among multiple groups were analyzed by 1-way ANOVA, followed by Tukey’s post hoc test. The experiment was repeated 3 times. &P < 0.05 vs. the NC group; *P < 0.05 vs. the NC-bio-probe group; #P < 0.05 vs. the Ago2 group FPKM, per kilobase of exon per million; hsa, human serum albumin.
Figure 4
Figure 4
miR-106a-5p inhibits EMT in NPC by suppressing SMAD5 expression. The cells used for following assays were treated with empty vector, miR-106a-5p inhibitor, miR-106a-5p mimic, and siRNA-SMAD5 alone or in combination. A) Cell line that presented the lowest miR-106a-5p was screened. #P < 0.05 vs. normal cell line NP69; &P < 0.05 vs. NPC cell line CNE2. B) MiR-106a-5p expression and mRNA expression of SMAD5, E-cadherin, N-cadherin, MMP-9, Snail, and Vimentin determined by qRT-PCR. C) Gray value analysis of SMAD5, E-cadherin, N-cadherin, MMP-9, Snail, and Vimentin. D) Protein expression of SMAD5, E-cadherin, N-cadherin, MMP-9, Snail, and Vimentin detected by Western blot analysis. E, F) Cell proliferation detected by the EdU assay. G, H) Cell migration determined by the Transwell assay. I, J) The effect of miR-106a-5p on CNE2 cell migration detected by the scratch test. Measurement data were expressed as means ± sd. Comparisons among multiple groups were analyzed by 1-way ANOVA, followed by Tukey’s post hoc test. The experiment was repeated 3 times. *P < 0.05 vs. the NC group; #P < 0.05 vs. the miR-106a-5p inhibitor group.
Figure 5
Figure 5
SMAD5 inhibition attenuates cell proliferation, invasion, migration, and EMT induced by SMAD5-AS1 elevation. The cells used for following assays were treated with pc-DNA, SMAD5-AS1, or siRNA-SMAD5. A) The mRNA expression of SMAD5. B, C) The protein expression of SMAD5. D, E) Cell proliferation detected by the EdU assay. F, G) Cell invasion tested by the Transwell assay. H, I) The effect of SMAD5 on CNE1 cell migration evaluated by the scratch test. Measurement data were expressed as means ± sd. Comparisons among multiple groups were analyzed by 1-way ANOVA, followed by Tukey’s post hoc test. The experiment was repeated 3 times. *P < 0.05 vs. the vector group.
Figure 6
Figure 6
SMAD5-AS1 inhibition and miR-106a-5p overexpression can both attenuate NPC tumorigenesis. The nude mice used for following assays were injected with cells after treatment of empty vector, miR-106a-5p inhibitor, siRNA SMAD5-AS1, or miR-106a-5p mimic. A) Expression of SMAD5-AS1, miR-106a-5p, and SMAD5 in nude mice after different treatments. B) Tumor growth curve of nude mice after different treatments. Measurement data were expressed as means ± sd. Comparisons among multiple groups were analyzed by 1-way ANOVA, followed by Tukey’s post hoc test. Comparisons among multiple groups at different time points were analyzed via repeated measurement ANOVA, followed by Tukey’s post hoc test; n = 12. *P < 0.05 vs. the NC group.
Figure 7
Figure 7
Diagram showing the mechanisms that involve the regulatory role of SMAD5-AS1/miR-106a-5p/SMAD5 axis in the EMT process in NPC. In NPC cells, highly expressed SMAD5-AS1 could competitively bind to miR-106a-5p to increase SMAD5 expression, which promoted EMT in NPC.

References

    1. Li T., Chen J. X., Fu X. P., Yang S., Zhang Z., Chen KhH., Li Y. (2011) microRNA expression profiling of nasopharyngeal carcinoma. Oncol. Rep. 25, 1353–1363 - PubMed
    1. Qi G., Chen J., Shi C., Wang Y., Mi S., Shao W., Yu X., Ma Y., Ling J., Huang J. (2016) Cinnamic acid (CINN) induces apoptosis and proliferation in human nasopharyngeal carcinoma cells. Cell. Physiol. Biochem. 40, 589–596 - PubMed
    1. Lee A. W., Tung S. Y., Ngan R. K., Chappell R., Chua D. T., Lu T. X., Siu L., Tan T., Chan L. K., Ng W. T., Leung T. W., Fu Y. T., Au G. K., Zhao C., O’Sullivan B., Tan E. H., Lau W. H. (2011) Factors contributing to the efficacy of concurrent-adjuvant chemotherapy for locoregionally advanced nasopharyngeal carcinoma: combined analyses of NPC-9901 and NPC-9902 Trials. Eur. J. Cancer 47, 656–666 - PubMed
    1. Qu C., Liang Z., Huang J., Zhao R., Su C., Wang S., Wang X., Zhang R., Lee M. H., Yang H. (2012) MiR-205 determines the radioresistance of human nasopharyngeal carcinoma by directly targeting PTEN. Cell Cycle 11, 785–796 - PMC - PubMed
    1. Li X. J., Peng L. X., Shao J. Y., Lu W. H., Zhang J. X., Chen S., Chen Z. Y., Xiang Y. Q., Bao Y. N., Zheng F. J., Zeng M. S., Kang T. B., Zeng Y. X., Teh B. T., Qian C. N. (2012) As an independent unfavorable prognostic factor, IL-8 promotes metastasis of nasopharyngeal carcinoma through induction of epithelial-mesenchymal transition and activation of AKT signaling. Carcinogenesis 33, 1302–1309 - PMC - PubMed

MeSH terms