. 2019 Sep 26;15(9):e1008358.
doi: 10.1371/journal.pgen.1008358. eCollection 2019 Sep.

Multi-omics analysis identifies mitochondrial pathways associated with anxiety-related behavior

Affiliations

Multi-omics analysis identifies mitochondrial pathways associated with anxiety-related behavior

Zuzanna Misiewicz et al. PLoS Genet. .

Abstract

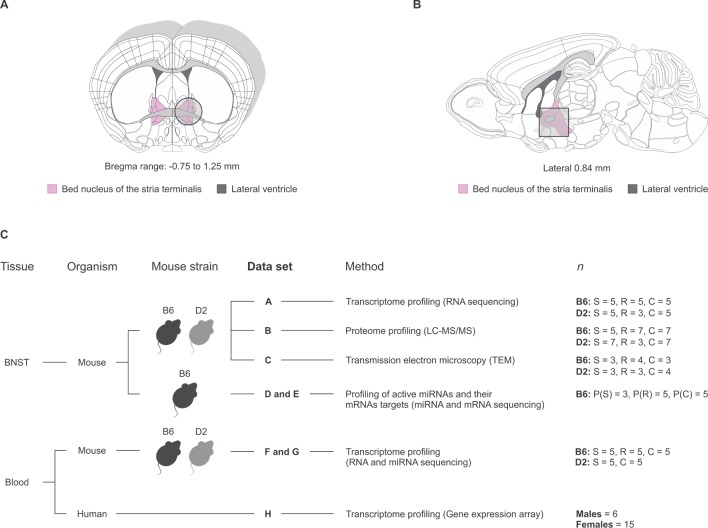
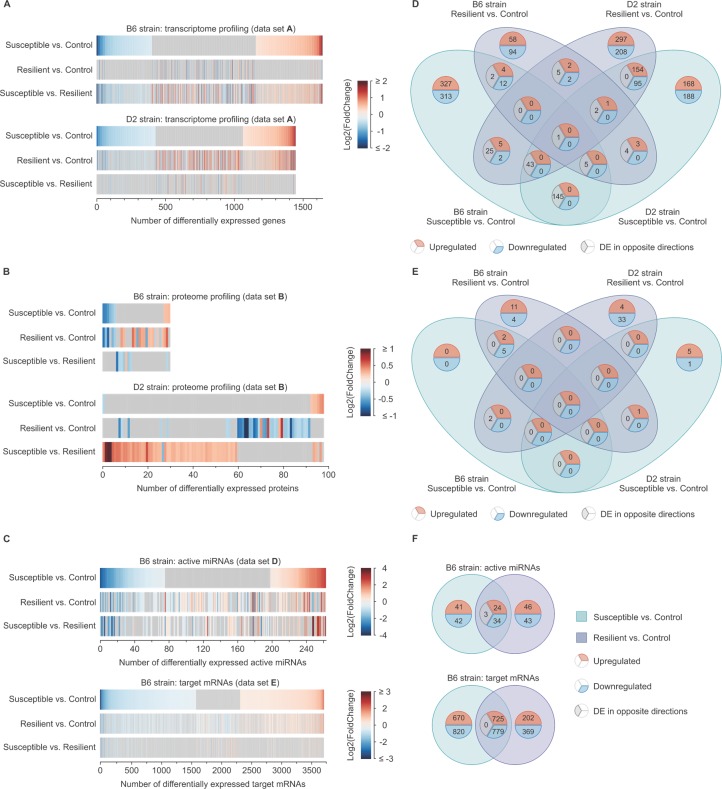
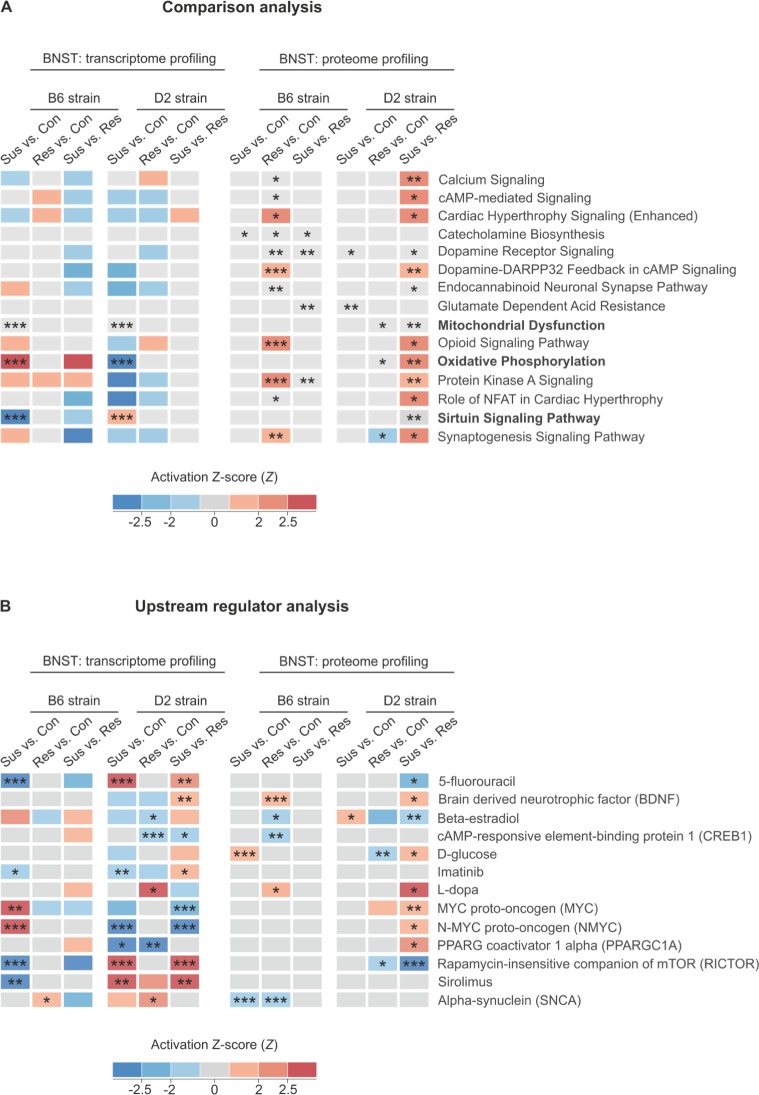
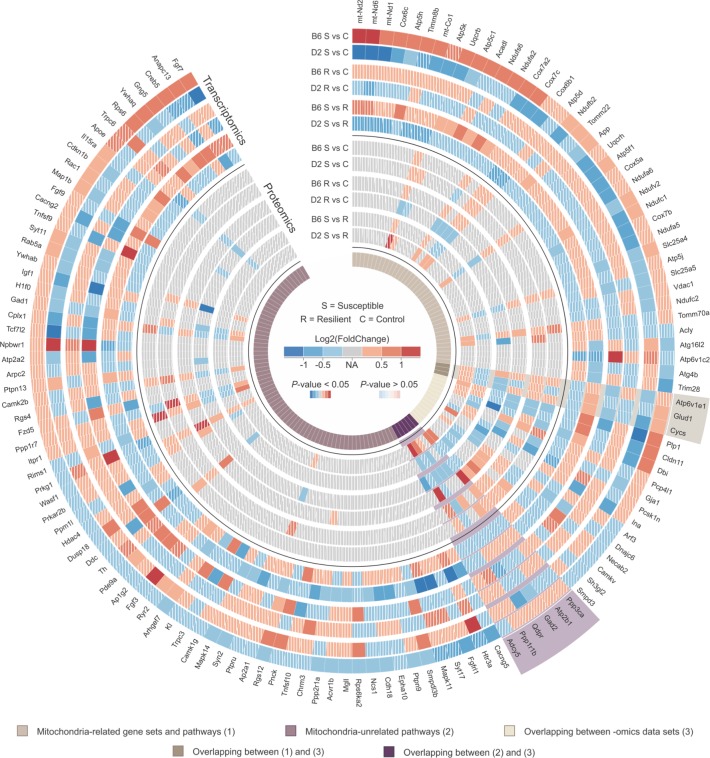
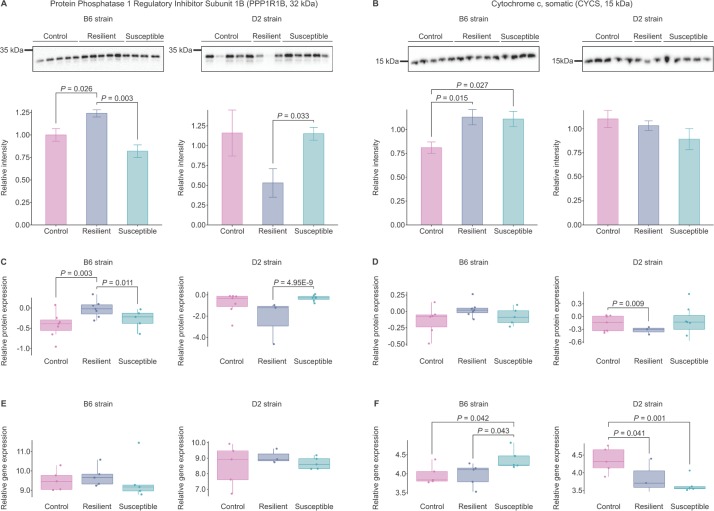
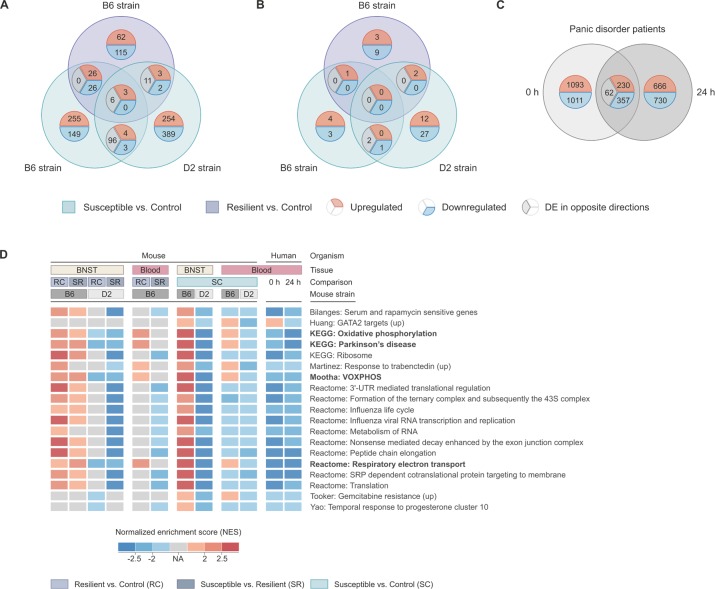
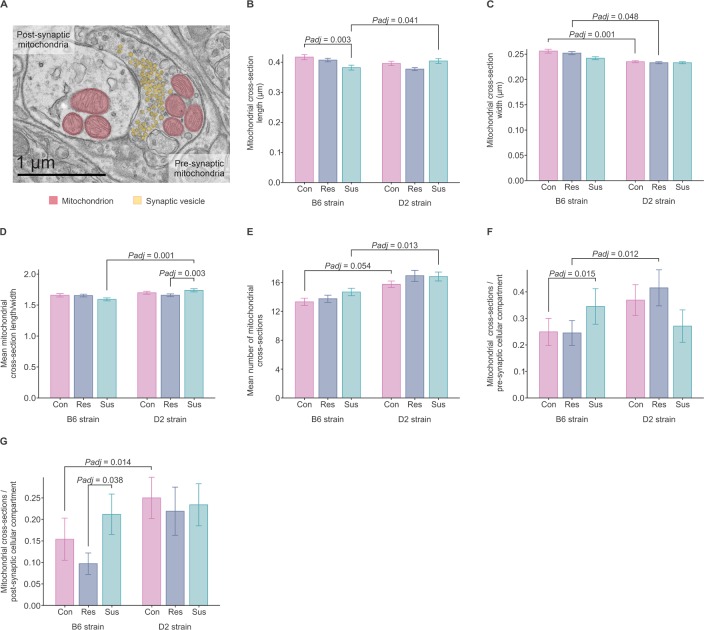
Stressful life events are major environmental risk factors for anxiety disorders, although not all individuals exposed to stress develop clinical anxiety. The molecular mechanisms underlying the influence of environmental effects on anxiety are largely unknown. To identify biological pathways mediating stress-related anxiety and resilience to it, we used the chronic social defeat stress (CSDS) paradigm in male mice of two inbred strains, C57BL/6NCrl (B6) and DBA/2NCrl (D2), that differ in their susceptibility to stress. Using a multi-omics approach, we identified differential mRNA, miRNA and protein expression changes in the bed nucleus of the stria terminalis (BNST) and blood cells after chronic stress. Integrative gene set enrichment analysis revealed enrichment of mitochondrial-related genes in the BNST and blood of stressed mice. To translate these results to human anxiety, we investigated blood gene expression changes associated with exposure-induced panic attacks. Remarkably, we found reduced expression of mitochondrial-related genes in D2 stress-susceptible mice and in exposure-induced panic attacks in humans, but increased expression of these genes in B6 stress-susceptible mice. Moreover, stress-susceptible vs. stress-resilient B6 mice displayed more mitochondrial cross-sections in the post-synaptic compartment after CSDS. Our findings demonstrate mitochondrial-related alterations in gene expression as an evolutionarily conserved response in stress-related behaviors and validate the use of cross-species approaches in investigating the biological mechanisms underlying anxiety disorders.


Conflict of interest statement

The authors have declared that no competing interests exist.

Figures

Fig 1
Fig 1. Genetic background has a strong effect on the behavioral response to chronic social defeat stress (CSDS).
(A) Timeline of behavioral experiments including CSDS, social avoidance (SA) test, forced swim test (FST), and tissue collection. (B) Schematic illustration of 10-day CSDS. The protocol involved a daily confrontation of max. 10 min of two conspecific mice, the experimental mouse in the defeated group (black) and the aggressor mouse (white), followed by sensory contact through a clear perforated plexiglass divider for the remaining of the 24 hours. As indicated by the black arrow, the defeated mice met a new aggressor every day during the 10 days of CSDS. (C) Schematic illustration of the control condition. Two control mice were placed in a single cage separated by a clear perforated plexiglass divider. As indicated by the black arrow, every 24 hours the control mouse was placed into a cage with a new unfamiliar neighbor mouse. Unlike the defeated mice, the control mice were never in physical contact with their neighbors. (D) Schematic illustration of trial I and II of the SA test. (E) SA test results showing social interaction ratios. n = B6: Susceptible = 34, Resilient = 78, Control = 56; D2: Susceptible = 62, Resilient = 8, Control = 56. Outliers criterion: IQR > 3. (F) Percentage of mice resilient and susceptible to stress. n = B6: Susceptible = 34, Resilient = 78 D2: Susceptible = 62, Resilient = 8. B6: C57BL/6NCrl; D2: DBA/2NCrl; FST: Forced swim test; IQR: interquartile range; SA: social avoidance test.
Fig 2
Fig 2. Overview of the BNST tissue collection and analyzed data sets.
(A-B) BNST was dissected from both hemispheres by punching the indicated area (shaded area outlined with a circle or a square) for (A) transcriptomic, proteomic, profiling of active miRNA and their target mRNAs, and (B) transmission electron microscopy (TEM) analyses. Figure outlines are based on Allen Mouse Brain Atlas [103, 104]. The bregma for outline shown in figure (A) is 0.38. (C) Schematic of analyzed data sets. B6: C57BL/6NCrl; C: control; D2: DBA/2NCrl; LC-MS/MS: liquid chromatography–tandem mass spectrometry; R: resilient; S: susceptible.
Fig 3
Fig 3. Distinct transcriptional stress response in the BNST of the D2 and B6 strains following CSDS.
(A-C) Union heatmaps showing fold changes (FCs) of (A) significantly differentially expressed (DE; P < 0.05 and |FC| ≥ 1.2) genes (data set A), (B) proteins (data set B), and (C) active miRNAs and their target mRNAs (data sets D and E) following CSDS. The genes are rank-ordered by the FCs in the susceptible vs. control comparison, separately for each strain and–omics data set. (D-F) Venn diagrams showing overlap between significantly DE (D) genes (data set A), (E) proteins (data set B), and (F) active miRNAs and their target mRNAs (data sets D and E) following CSDS. B6: C57BL/6NCrl; CSDS: chronic social defeat stress; D2: DBA/2NCrl.
Fig 4
Fig 4. Transcriptomic and proteomic analyses implicate dysregulation of mitochondria-related canonical pathways in the BNST of B6 and D2 mice following CSDS.
Merged heatmap showing (A) significantly dysregulated canonical pathways and (B) upstream regulators from the Ingenuity Pathway Analysis (IPA) database ordered alphabetically. Mitochondria-related canonical pathways (written in bold) were found to be significantly dysregulated (PFDR < 0.05) on both gene and protein levels. The IPA Z-score, predicting the activation (red) or inhibition (blue) of the respective signaling pathway or upstream regulator cluster, is marked in color. B6: C57BL/6NCrl; cAMP: cyclic adenosine monophosphate; Con: control; D2: DBA/2NCrl; DARPP-32: dopamine- and cAMP-regulated phosphoprotein; NAFT: nuclear factor of activated T-cells; PPARG: peroxisome proliferator-activated receptor gamma; Res: resilient; Sus: susceptible. *PFDR < 0.05, ** PFDR < 0.01, *** PFDR < 0.001.
Fig 5
Fig 5. Common differentially expressed (DE) genes and proteins included in the enriched mitochondria-related gene sets and pathways in the BNST of B6 and D2 mice following CSDS.
Merged heatmap showing the expression fold change (FC) and P-value of resilient vs. control, susceptible vs. control and susceptible vs. resilient comparisons from the BNST transcriptomic and proteomic analyses (data sets A and B, respectively). Only DE molecules (P < 0.01) in at least one of the 12 comparisons are shown. “Mitochondria-related gene sets and pathways” include “Mitochondrial Dysfunction,” “Oxidative Phosphorylation” and “Sirtuin Signaling Pathway” shown in Fig 4A and all gene sets shown in S3 Fig. All remaining canonical pathways included in Fig 4A are referred to as “Mitochondria-unrelated pathways”. Genes and proteins significantly DE in the same comparison between at least two BNST data sets are referred to as overlapping between–omic data sets and were selected based on results shown in S6 Table. Molecules with P > 0.05, are shown in diagonal stripe pattern, while those with P < 0.05 are shown with solid colors. Molecules not present in a data set are shown in gray. B6: C57BL/6NCrl; C: control; D2: DBA/2NCrl; R: resilient; S: susceptible.
Fig 6
Fig 6. Protein phosphatase 1 Regulatory Subunit 1B (PPP1R1B) and cytochrome c somatic (CYCS) show opposite patterns of expression in the BNST of B6 and D2 strains following CSDS.
(A-B) Western blot (WB), (C-D) relative protein (data set B; LC-MS/MS), and (E-F) gene expression (data set A; RNA sequencing) analysis of total PPP1R1B and CYCS in mouse BNST following exposure to CSDS. Mean values ± S.E.M. B6: C57BL/6NCrl; D2: DBA/2NCrl; LC-MS/MS: liquid chromatography–tandem mass spectrometry.
Fig 7
Fig 7. Converging analysis of blood cell gene expression data from stressed mice and panic disorder patients with exposure-induced panic attacks.
(A-C) Venn diagrams showing overlap between significantly differentially expressed (A) mouse genes (data set F; P < 0.05 and |FC| ≥ 1.2), (B) mouse miRNAs (data set G; P < 0.05 and |FC| ≥ 1.2), and (C) genes (data set H; P < 0.05) in panic disorder (PD) patients’ blood cells. (D) Merged heatmap from gene set enrichment analysis showing the significantly enriched gene sets (PFDR < 0.25) present in at least 50% of all comparisons. Gene sets which did not pass the cut-off are marked in gray (NA). A positive (or negative) NES for a given gene set implicates its overrepresentation at the top (or bottom, respectively) of the ranked list of upregulated (or downregulated, respectively) genes. Gene sets are ordered alphabetically. B6: C57BL/6NCrl; BNST: bed nucleus of the stria terminalis; D2: DBA/2NCrl.
Fig 8
Fig 8. Chronic social defeat stress affects BNST mitochondrial morphology of B6 and D2 mice.
(A) Transmission electron microscopy image showing pre- and post-synaptic neuronal compartments, mitochondria (red) and vesicles (yellow) located next to the synapse. (B-G) Graphs showing mean differences between B6 and D2 stress-susceptible, resilient and control mice in (B) maximum (length) and (C) minimum (width) diameters of mitochondrial cross-sections, (D) mean mitochondrial cross-section length/width ratio, i.e., maximum/minimum diameter (E) mean number of mitochondrial cross-sections (F-G) number of mitochondrial cross-sections per (F) pre-synaptic and (G) post-synaptic cellular compartment. P-values were adjusted for multiple testing with test-wise Bonferroni correction. Mean values ± S.E.M. B6: C57BL/6NCrl; Con: control; D2: DBA/2NCrl; Res: resilient; Sus: susceptible.

References

    1. Pirkola S, Isometsa E, Aro H, Kestila L, Hamalainen J, Veijola J, et al. Childhood adversities as risk factors for adult mental disorders: results from the Health 2000 study. Soc Psychiatry Psychiatr Epidemiol. 2005;40(10):769–77. 10.1007/s00127-005-0950-x - DOI - PubMed
    1. Nestler EJ, Hyman SE. Animal models of neuropsychiatric disorders. Nat Neurosci. 2010;13(10):1161–9. 10.1038/nn.2647 - DOI - PMC - PubMed
    1. Laine MA, Sokolowska E, Dudek M, Callan SA, Hyytia P, Hovatta I. Brain activation induced by chronic psychosocial stress in mice. Sci Rep. 2017;7(1):15061 10.1038/s41598-017-15422-5 - DOI - PMC - PubMed
    1. Laine MA, Trontti K, Misiewicz Z, Sokolowska E, Kulesskaya N, Heikkinen A, et al. Genetic Control of Myelin Plasticity after Chronic Psychosocial Stress. eNEURO. 2018;5(4): ENEURO.0166-18.2018 10.1523/ENEURO.0166-18.2018 - DOI - PMC - PubMed
    1. Avgustinovich DF, Kovalenko IL, Kudryavtseva NN. A model of anxious depression: persistence of behavioral pathology. Neurosci Behav Physiol. 2005;35(9):917–24. 10.1007/s11055-005-0146-6 - DOI - PubMed

Publication types