. 2019 Nov;23(11):7699-7708.
doi: 10.1111/jcmm.14643. Epub 2019 Sep 26.

ALPK1 regulates streptozotocin-induced nephropathy through CCL2 and CCL5 expressions

Affiliations

ALPK1 regulates streptozotocin-induced nephropathy through CCL2 and CCL5 expressions

Chi-Pin Lee et al. J Cell Mol Med. 2019 Nov.

Abstract

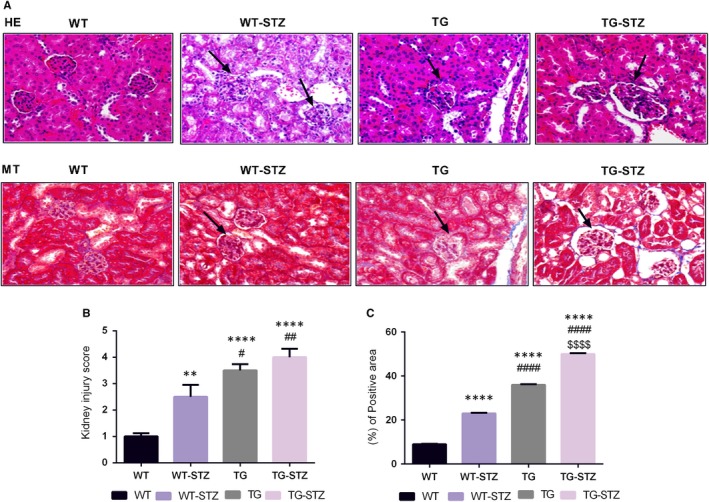
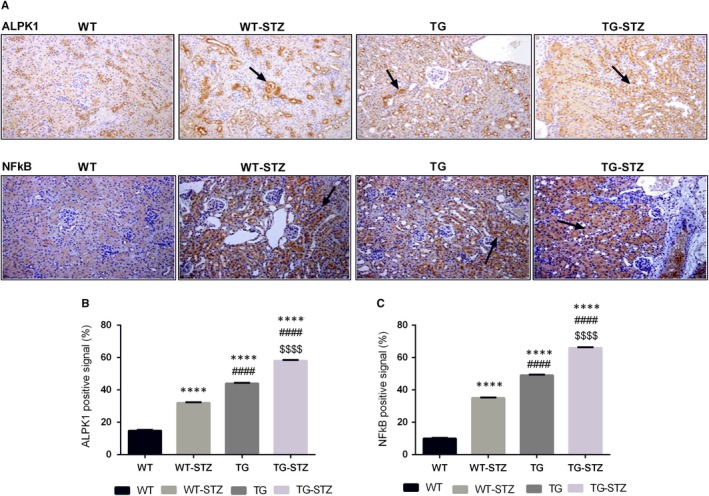
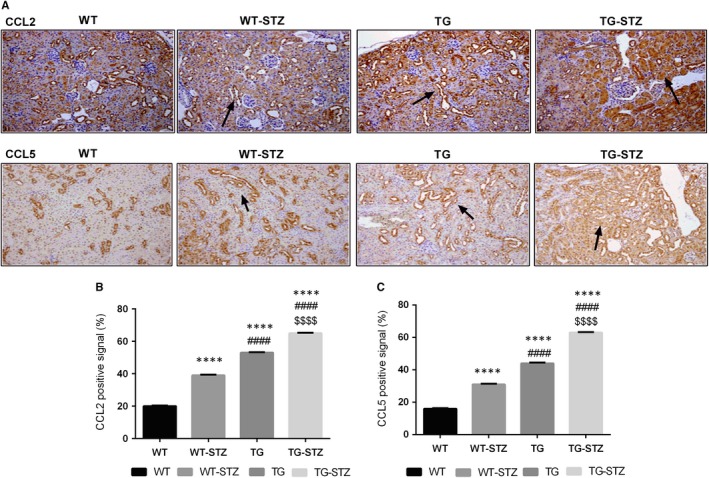
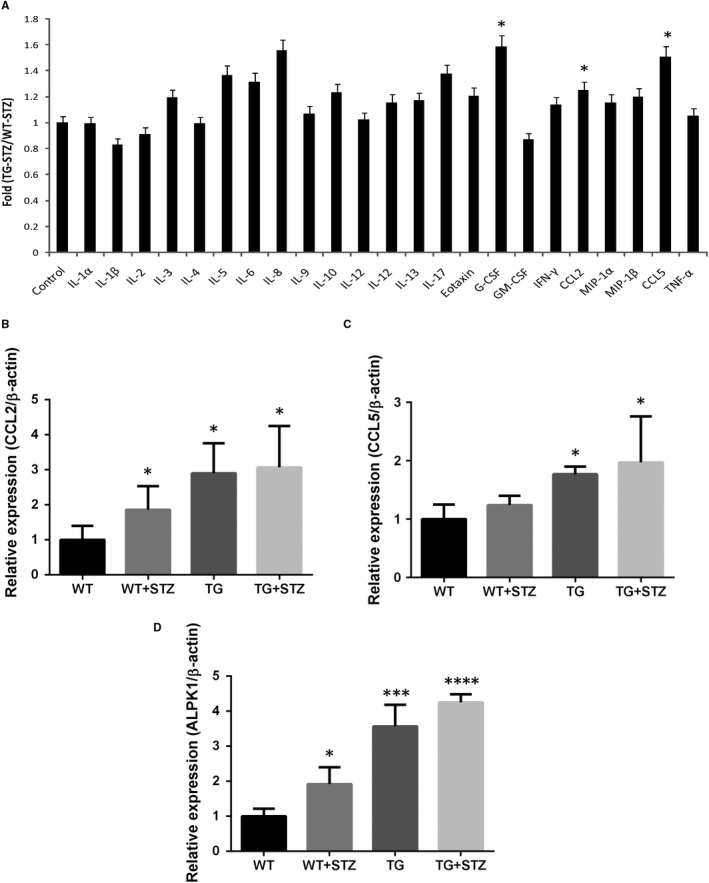
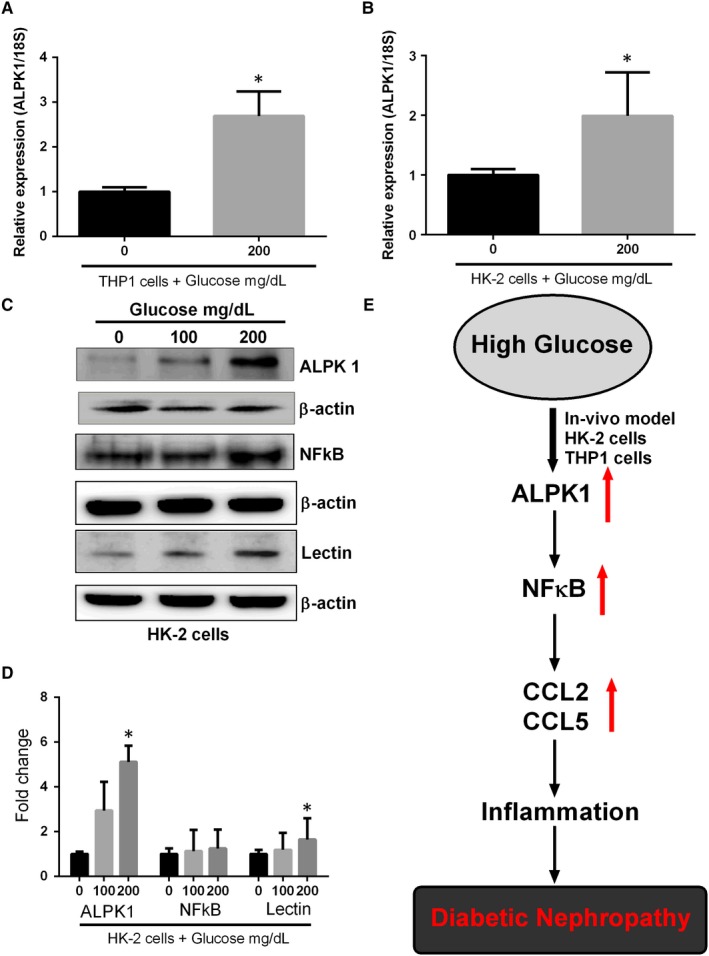
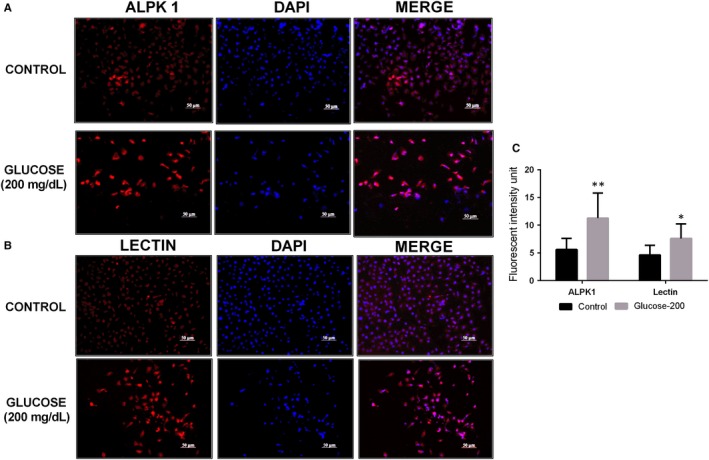
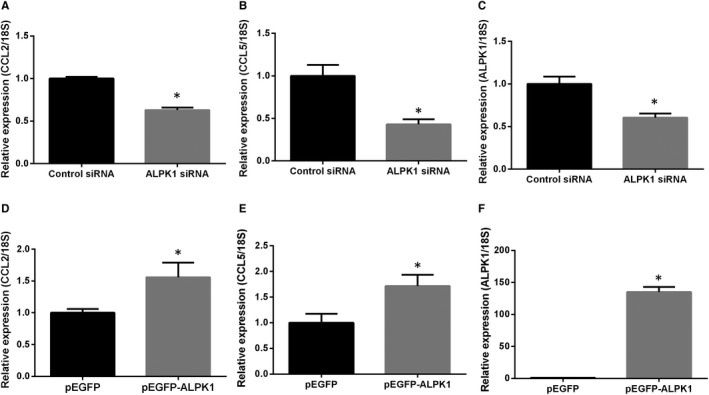
ALPK1 is associated with chronic kidney disease, gout and type 2 diabetes mellitus. Raised renal ALPK1 level in patients with diabetes was reported. Accelerated fibrotic nephropathies were observed in hyperglycaemic mice with up-regulated ALPK1. The aim of this study was to identify the mediators contributing to ALPK1 effect involving in nephropathies induction. The haematoxylin and eosin staining, Masson's trichrome and immunohistochemical analysis of ALPK1, NFkB, CCL2 and CCL5 were performed in the mice kidney. Cytokine antibody array analysis was performed in streptozotocin-treated wild-type mice (WT-STZ) and streptozotocin-treated ALPK1 transgenic mice (TG-STZ). The ALPK1 levels were measured in mice kidney and in cultured cells. We found that the higher levels of renal CCL2/MCP-1, CCL5/Rantes and G-CSF expression in TG-STZ compared with the WT-STZ. Glucose increased ALPK1 expressions in monocytic THP1 and human kidney-2 cells. The protein expression of ALPK1, NFkB and lectin was up-regulated in glucose-treated HK-2 cells. Knockdown of ALPK1 reduced CCL2 and CCL5 mRNA levels, whereas overexpressed ALPK1 increased CCL2 and CCL5 in cultured kidney cells. Taken together, these results show that high glucose increases ALPK1 and chemokine levels in the kidney. Elevated ALPK1 expression enhances renal CCL2 and CCL5 expressions in vivo and in vitro. ALPK1 is a mediator for CCL2 and CCL5 chemokine up-regulation involving in diabetic nephropathies induction.

Keywords: ALPK1; CCL2; CCL5; chemokine; diabetic nephropathy.


Conflict of interest statement

The authors declare that they have no conflict of interest exists.

Figures

Figure 1
Figure 1
Histological examinations of kidney tissues from WT, WT‐STZ, TG and TG‐STZ (A). Haematoxylin and eosin staining and Masson's trichrome staining (B). Kidney injury score of four groups (C). Collagen deposition was higher in TG‐STZ. **P < .01 are compared to the WT; ****P < .0001 are compared to the WT; #P < .05 are compared to the WT‐STZ; ##P < .01 are compared to the WT‐STZ; ####P < .0001 are compared to the WT‐STZ; and $$$$P < .0001 are compared to the TG
Figure 2
Figure 2
Immunohistochemical expression of ALPK1 and NFkB (A). The up‐regulation of ALPK1 and NFkB expression in STZ treated mice and overexpression of ALPK1 mice. Brown positive signals were predominantly distributed in renal tissues (B, C). ALPK1 and NFkB positive cells in renal tissue from the immunohistochemical analysis of WT, WT‐STZ, TG and TG‐STZ. These graphs represent mean ± SD. ****P < .0001 are compared to the WT; ####P < .0001 are compared to the WT‐STZ; and $$$$P < .0001 are compared to the TG
Figure 3
Figure 3
Immunohistochemical expression of CCL2 and CCL5 (A). The up‐regulation of CCL2 and CCL5 expression in STZ‐treated mice and overexpression of ALPK1 mice. Brown positive signals were predominantly distributed in renal tissues (B, C). CCL2 and CCL5 positive cells in renal tissue from the immunohistochemical analysis of WT, WT‐STZ, TG and TG‐STZ. These graphs represent mean ± SD. ****P < .0001 are compared to the WT; ####P < .0001 are compared to the WT‐STZ; $$$$P < .0001 are compared to the TG
Figure 4
Figure 4
Cytokine and chemokine secretion increased in TG‐STZ mice (A). Bio‐Plex Pro™ mouse cytokine array was used to screen cytokine or chemokine secretion in kidney samples from WT‐STZ and TG‐STZ (B‐D). Transcripts of CCL2, CCL5 and ALPK1 were measured by RT‐qPCR. Results of RT‐qPCR were repeated three times. Higher ALPK1 levels correlate with increased cytokine and chemokine expression in STZ‐treated mice. Values shown in the graph are mean ± SD. *P < .05 are compared with the WT; ***P < .001 are compared with the WT; ****P < .0001 are compared with the WT
Figure 5
Figure 5
Up‐regulation of ALPK1 in cultured kidney cells by glucose stimulation. THP1 and HK‐2 cells were treated with glucose for 48 h. Transcripts of ALPK1 were measured by RT‐qPCR. Glucose increased ALPK1 mRNA levels in (A). THP1 (B). HK‐2 cells. Graphs represent mean ± SD values, and each experiment was performed in triplicate (C). The protein expression of ALPK1, NFkB, lectin and β‐actin was determined by Western blotting in HK‐2 cells (D). The enhanced effect of glucose on ALPK1, NFkB and lectin protein expressions was plotted on the bar graph. ALPK1 protein signal was quantified by densitometry analysis and expressed as a fold change in respective control cells from three independent experiments (E). Schematic model showing that the ALPK1 regulates glucose induced nephropathy through CCL2 and CCL5 expressions. ∗P < .05 compared with the THP1 or HK‐2 cells without glucose stimulation
Figure 6
Figure 6
ALPK1 and lectin expression in HK‐2 cells. (A, B). Immunofluorescence staining showed a high level of ALPK1 and lectin expressions in HK‐2 cells treated with high glucose. Cell nuclei were stained with DAPI (Blue). (C). Quantification of cell fluorescent intensity. *P < .05 are compared with the control cells; **P < .01 are compared with the control cells
Figure 7
Figure 7
Effect of ALPK1 on CCL2 and CCL5 expression in cultured kidney cells (A‐C). HK‐2 cells were transfected with ALPK1 or control siRNA for 48h. Transcripts of ALPK1, CCL2 and CCL5 were measured by RT‐qPCR (D‐F). HEK293 cells were transfected with pEGFP‐ALPK1 or control pEGFP vectors for 48 h. ALPK1, CCL2 and CCL5 mRNA levels were measured by RT‐qPCR. Results of RT‐qPCR were repeated for three times. ∗P < .05 compared with cells transfected with control siRNA/pEGFP vectors.

References

    1. Yamada Y, Matsui K, Takeuchi I, Oguri M, Fujimaki T. Association of genetic variants of the alpha‐kinase 1 gene with type 2 diabetes mellitus in a longitudinal population‐based genetic epidemiological study. Biomed Rep. 2015;3(3):347‐354. - PMC - PubMed
    1. Yamada Y, Nishida T, Ichihara S, et al. Identification of chromosome 3q28 and ALPK1 as susceptibility loci for chronic kidney disease in Japanese individuals by a genome‐wide association study. J Med Genet. 2013;50(6):410‐418. - PubMed
    1. Min‐Shan Ko A, Tu H‐P, Liu T‐T, et al. ALPK1 genetic regulation and risk in relation to gout. Int J Epidemiol. 2013;42(2):466‐474. - PMC - PubMed
    1. Chen M, Xu R. Motor coordination deficits in Alpk1 mutant mice with the inserted piggy Bac transposon. BMC Neurosci. 2011;12:1. - PMC - PubMed
    1. Kuo T‐M, Yeh K‐T, Hsu H‐T, et al. ALPK1 affects testosterone mediated regulation of proinflammatory cytokines production. J Steroid Biochem Mol Biol. 2015;154:150‐158. - PubMed

Publication types

MeSH terms