. 2019 Nov 7;134(19):1585-1597.
doi: 10.1182/blood.2019000050.

γ-Secretase inhibition increases efficacy of BCMA-specific chimeric antigen receptor T cells in multiple myeloma

Affiliations

γ-Secretase inhibition increases efficacy of BCMA-specific chimeric antigen receptor T cells in multiple myeloma

Margot J Pont et al. Blood. .

Abstract

B-cell maturation antigen (BCMA) is a validated target for chimeric antigen receptor (CAR) T-cell therapy in multiple myeloma (MM). Despite promising objective response rates, most patients relapse, and low levels of BCMA on a subset of tumor cells has been suggested as a probable escape mechanism. BCMA is actively cleaved from the tumor cell surface by the ubiquitous multisubunit γ-secretase (GS) complex, which reduces ligand density on tumor cells for CAR T-cell recognition and releases a soluble BCMA (sBCMA) fragment capable of inhibiting CAR T-cell function. Sufficient sBCMA can accumulate in the bone marrow of MM patients to inhibit CAR T-cell recognition of tumor cells, and potentially limit efficacy of BCMA-directed adoptive T-cell therapy. We investigated whether blocking BCMA cleavage by small-molecule GS inhibitors (GSIs) could augment BCMA-targeted CAR T-cell therapy. We found that exposure of myeloma cell lines and patient tumor samples to GSIs markedly increased surface BCMA levels in a dose-dependent fashion, concurrently decreased sBCMA concentrations, and improved tumor recognition by CAR T cells in vitro. GSI treatment of MM tumor-bearing NOD/SCID/γc-/- mice increased BCMA expression on tumor cells, decreased sBCMA in peripheral blood, and improved antitumor efficacy of BCMA-targeted CAR T-cell therapy. Importantly, short-term GSI administration to MM patients markedly increases the percentage of BCMA+ tumor cells, and the levels of BCMA surface expression in vivo. Based on these data, a US Food and Drug Administration (FDA)-approved clinical trial has been initiated, combining GSI with concurrent BCMA CAR T-cell therapy. This trial was registered at www.clinicaltrials.gov as #NCT03502577.


Figures

None
Graphical abstract
Figure 1.
Figure 1.
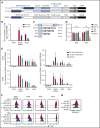
BCMA CAR design and optimization. (A) Schematic of CAR constructs containing the C11 scFv in VH/VL or VL/VH configuration (HL or LH), 4-1BB, or CD28 costimulatory domain (costim), CD3ζ signaling domain, T2A ribosomal skip sequence, and EGFRt. The previously described BCMA-2 CAR is also depicted, and contains a CD8α hinge and transmembrane (TM) domain, and a CD28 costimulatory domain. (B) CD8+ T cells were transduced with C11/HL and C11/LH 4-1BB/CD3ζ CARs containing a long spacer sequence (IgG4 hinge-CH2-CH3NQ) and selected for EGFRt expression. IFN-γ production in supernatants of CAR T cells after stimulation with K562, K562/BCMA, and 8226 cells for 24 hours was measured by ELISA. T cells were prepared from 2 different donors and values were normalized to production of C11/LH/4-1BB/CD3ζ against K562/BCMA. (C) Schematic of various spacers used in the C11/HL/4-1BB/CD3ζ BCMA-CARs. (D) IFN-γ production in supernatants of CD8+ BCMA CAR T cells with the indicated spacers after stimulation with 8226 and U266 myeloma cell lines for 24 hours as measured by ELISA. IFN-γ was normalized to production of long spacer CAR against 8226 or U266, respectively. (E) IFN-γ (left) and IL-2 (right) in supernatants of CD4+ and CD8+ T cells expressing C11/HL/3ST/4-1BB/CD3ζ, C11/HL/3ST/CD28/CD3ζ, or BCMA-2 CARs after 24 hours coculture with the indicated BCMA and BCMA+ target cells. Values were normalized to BCMA-2 against K562/BCMA. (F) Proliferation of CD4+ and CD8+ BCMA CAR T cells after stimulation with target cells for 72 hours analyzed by CFSE dilution assay. (G) Representative CAR expression on CD8+ BCMA CAR T cells after isolation and expansion as measured by BCMA/Fc conjugated to APC. The E:T ratio was 2:1 in all assays. Data in panels D through G are summarized (D-E) or representative (F-G) of 2 or more individual experiments with T cells prepared from different donors. Data depicted in bar graphs represent mean plus standard error of the mean (SEM). ***P < .001; as determined by 1-way ANOVA with the Dunnett posttest. ns, not significant.
Figure 2.
Figure 2.
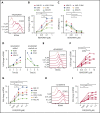
BCMA CARs recognize patient CD138+ myeloma cells in vitro. (A) Staining of BCMA on 8226 and 3 representative primary MM samples. Open histograms depict staining with isotype control. All plots are gated on CD38+ (thawed) or CD138+ (fresh) CD45propidium iodide (PI) singlet cells after Ficoll separation and CD138+ enrichment of freshly collected BMAs. Summarized data for all evaluable primary MM samples (n = 22) are shown as pie charts. (B) IFN-γ concentrations in supernatants of CD8+ BCMA CAR T cells after stimulation with primary CD138+ myeloma cells for 24 hours at a ratio of 2:1 as measured by ELISA. BCMA CAR T cells were generated from different allogeneic donors. Untransduced T cells or T cells transduced with an irrelevant CAR from the same donor were included as a control for alloreactivity as well as the CD138-depleted fraction from patient samples as a control for BCMA specificity. Supernatants from control cultures were <275 pg/mL in all assays. Correlation between BCMA and IFN-γ is depicted with P values by linear regression.
Figure 3.
Figure 3.
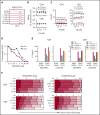
sBCMA binds BCMA CAR T cells and inhibits cytokine production. (A) sBCMA concentration in plasma from MM and control patient BM measured by ELISA. Samples were stratified by the percentage of CD138+ cells of live BMMCs as measured by flow cytometry for MM patient samples. (B) Surface staining of CD4+ BCMA and CD19 CAR T cells with APC-conjugated BCMA/Fc and anti-EGFR Ab. (C) Staining with APC-conjugated BCMA/Fc of CD4+ BCMA CAR T cells after 30 minutes preincubation with exogenous recombinant BCMA. (D) Intracellular IFN-γ (left), IL-2 (middle), or TNF (right panel) staining of CD4+ T cells after 5 hours of stimulation with 8226 or U266 (BCMA CAR T) or K562-CD19 (CD19 CAR T) in the presence and absence of exogenous recombinant BCMA at an E:T ratio of 4:1. (E) Cytolytic activity of CD4+ BCMA CAR T cells against K562/BCMA (left), U266 (middle), and 8226 (right) at varying concentrations of recombinant BCMA analyzed by a 4-hour 51Cr-release assay at an E:T ratio of 30:1 (squares) and 10:1 (circles). Data in panels B and C are representative of 2 independent experiments with T cells from different donors; data in panels D and E show summarized data with T cells from 2 different donors. Error bars represent mean plus SEM. *P < .05; as determined by 1-way ANOVA with the Tukey posttest. Data for CD8+ T cells are shown in supplemental Figure 1A.
Figure 4.
Figure 4.
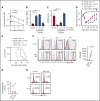
GSI decreases shedding of BCMA from myeloma cell lines and primary samples. (A) Surface BCMA staining of MM.1R after 24-hour incubation with increasing concentrations of RO4929097. (B) Fold change in surface BCMA on myeloma cell lines after 24-hour incubation with increasing concentrations of RO4929097. (C) Concentration of sBCMA in supernatant of cell lines cultured in increasing concentrations of RO4929097 for 24 hours as measured by ELISA. (D) Fold change of surface BCMA expression on myeloma cell lines cultured in 1 μM RO4929097 at various time points (hours) and after RO4929097 was washed out and cells were cultured in media without GSI (left and right panel, respectively). (E-F) Representative staining (E) and fold increase of BCMA (F) on CD138+ primary myeloma cells (n = 7) after 4-hour incubation with increasing amounts of RO4929097. (G) Fold change in surface BCMA on myeloma cell lines after 24-hour incubation with increasing concentrations of LY3039478. (H-I) Representative staining (H) and fold increase of BCMA (I) on CD138+ primary myeloma cells (n = 7) after 4-hour incubation with increasing amounts of LY3039478. Primary cells and cell lines were cultured at 0.5 × 10⁶ cells per milliliter. Fold change in BCMA is defined as treated (MFIBCMA)/control (MFIBCMA) and isotype corrected for primary samples. Data in panels A through D and G are representative of 3 independent experiments. *P < .05, **P < .01, as determined by repeated measures 1-way ANOVA with the Tukey posttest.
Figure 5.
Figure 5.
GSI pretreatment leads to increased CAR T-cell reactivity to myeloma cell line and primary myeloma samples. (A) Percentage of cytokine+ of CD4+ (top) or CD8+ (bottom panels) BCMA CAR T cells after stimulation with MOLP8 myeloma cell line pretreated with 10 μM RO4929097 or 0.1 μM LY3039478 for 4 hours. (B) Proliferation of CD4+ or CD8+ BCMA CAR T cells measured by CFSE dilution after 72 hours of stimulation with primary myeloma cells (E:T 2:1) that were pretreated with 1 μM RO4929097 (blue histogram) or 1 μM LY3039478 (light green histogram) for 4 hours. No GSI control is indicated by the red line and T cells only by the lavender histogram. Fraction of cells proliferated >3 times (CD4) or >2 times (CD8) is indicated per histogram. Data shown are representative of n = 3. (C) Representative contour plot of intracellular IFN-γ staining of CD8+ BCMA CAR T cells stimulated for 4 hours with patient primary myeloma cells pretreated with 0.1 μM LY3039478 at an E:T ratio of 5:1. (D) Percentage of IFN-γ+ CD4+ or CD8+ BCMA CAR T cells after stimulation with patient primary myeloma cells pretreated with various concentrations of RO4929097 or LY3039478. Data in panel A are summarized from 2 independent experiments with BCMA CAR T cells prepared from at least 3 different donors. Error bars represent mean plus SEM. *P < .05, **P < .01, ***P < .001 as determined by 1-way ANOVA with the Tukey posttest.
Figure 6.
Figure 6.
Inhibition of T-cell function by GSIs is dose dependent. (A) RO4929097 or LY3039478 do not affect cell surface CD19 expression on K562/CD19. Cells were cultured with or without GSI for 16 to 18 hours and stained with anti-CD19 and isotype control antibodies. (B) Viability of CD4+ and CD8+ CD19 CAR T cells incubated with GSI for 24 hours measured by propidium iodide staining, normalized to percentage of no GSI condition. (C) Cytolytic activity of CD4+ and CD8+ CD19 CAR T cells incubated for 4 hours with K562/CD19 (circles) or K562 control (triangles) with varying concentrations of RO4929097 (filled circles) or LY3039478 (open circles) at an E:T ratio of 30:1 and 10:1 as measured by 51Cr release assay. (D) IL-2 secretion by CD4+ and CD8+ CD19 CAR T cells stimulated with K562/CD19 at an E:T ratio of 2:1 for 18 hours in the presence of various concentrations of RO4929097. (E) IL-2 secretion by CD4+ and CD8+ CD19 CAR T cells stimulated with K562/CD19 or K562/BCMA at an E:T ratio of 2:1. CAR T cells were preincubated with the indicated concentrations of RO4929097 or LY3039478. GSI was either washed out (+/−) or present during the assay (+/+). IL-2 production was measured after 18 hours coculture with K562/BCMA or K562/CD19. (F) Proliferation of CD4+ and CD8+ CD19 CAR T cells stimulated with K562/CD19 or K562/BCMA in the indicated concentrations of RO4929097 (left panels) or LY3039478 (right panels) determined by CFSE dilution after 96 hours. Data from panels A through F are representative of ≥2 independent experiments. Error bars represent mean plus SEM.
Figure 7.
Figure 7.
In vivo administration of GSI prevents BCMA shedding and increases BCMA CAR efficacy. (A) Concentration of LY3039478 in peripheral blood of mice at various time points after administration of 2 doses of 1 or 3 mg/kg LY3039478 36 hours apart. (B-C) Mice were engrafted with MM.1R for 27 days, treated with 1 mg/kg LY3039478 (filled circles) or vehicle (open squares) twice 18 hours apart and euthanized at various time points after the second dose. (B) Fold change in BCMA expression on CD138+GFP+ cells from bone marrow was determined, as well as sBCMA levels (C) in peripheral blood serum of mice. (D) Quantified bioluminescence imaging and (E) survival of mice engrafted with MM.1R cells and treated with 7.5 × 10⁵ cells BCMA-CAR or CD19 CAR T cells 20 days after tumor injection; 1 mg/kg LY3039478 or vehicle was administered 3 times a week (TIW) starting at day −1 before T-cell treatment. (F) Staining of BCMA (red histograms) on 3 primary MM samples at screening for enrollment and 4 to 6 hours after 3 doses of 25 mg of LY3039478. LY3039478 was dosed orally on days 1, 3, and 5 and flow cytometry was performed on screen and day 5 samples. Time between the screening and day 5 samples is at most 39 days. Blue histograms depict staining with fluorescence minus 1 (FMO) control. Shaded area indicates positive above background, with BCMA+ percentages in top right corner. BCMA ABC is depicted in the right panel. Plots are gated on abnormal plasma cells of freshly collected BMAs. Significance was tested by the 2-tailed paired Student t test. (G) Percentage of abnormal plasma cells from samples shown in panel F. (H) Ki67 stain on samples from patients 2 and 3. Percentage of Ki67+ cells is depicted. *P < .05 as tested by the Mann-Whitney test. ****P ≤ .0001 as tested by 1-way ANOVA with the Dunnett posttest. **P ≤ 0.01 as tested by the log-rank (Mantel-Cox) test.

References

    1. Attal M, Harousseau JL, Stoppa AM, et al. . A prospective, randomized trial of autologous bone marrow transplantation and chemotherapy in multiple myeloma. Intergroupe Français du Myélome. N Engl J Med. 1996;335(2):91-97. - PubMed
    1. Barlogie B, Kyle RA, Anderson KC, et al. . Standard chemotherapy compared with high-dose chemoradiotherapy for multiple myeloma: final results of phase III US Intergroup Trial S9321 [published correction appears in J Clin Oncol. 2006;24(17):2687]. J Clin Oncol. 2006;24(6):929-936. - PubMed
    1. Bladé J, Rosiñol L, Cibeira MT, Rovira M, Carreras E. Hematopoietic stem cell transplantation for multiple myeloma beyond 2010. Blood. 2010;115(18):3655-3663. - PubMed
    1. Child JA, Morgan GJ, Davies FE, et al. ; Medical Research Council Adult Leukaemia Working Party . High-dose chemotherapy with hematopoietic stem-cell rescue for multiple myeloma. N Engl J Med. 2003;348(19):1875-1883. - PubMed
    1. Harousseau JL, Attal M, Divine M, et al. . Autologous stem cell transplantation after first remission induction treatment in multiple myeloma. A report of the French Registry on Autologous Transplantation in Multiple Myeloma. Stem Cells. 1995;13(suppl 2):132-139. - PubMed

Publication types

Substances

Associated data