. 2019 Nov;213(3):877-895.
doi: 10.1534/genetics.119.302590. Epub 2019 Sep 26.

Drosophila Heterochromatin Stabilization Requires the Zinc-Finger Protein Small Ovary

Affiliations

Drosophila Heterochromatin Stabilization Requires the Zinc-Finger Protein Small Ovary

Leif Benner et al. Genetics. 2019 Nov.

Abstract

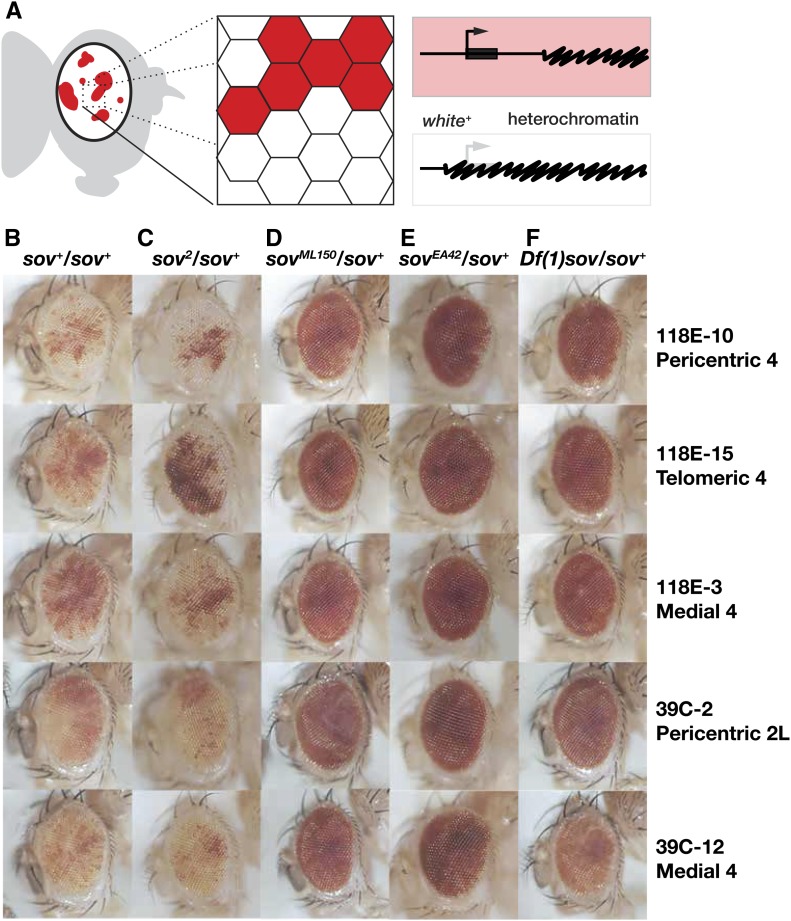
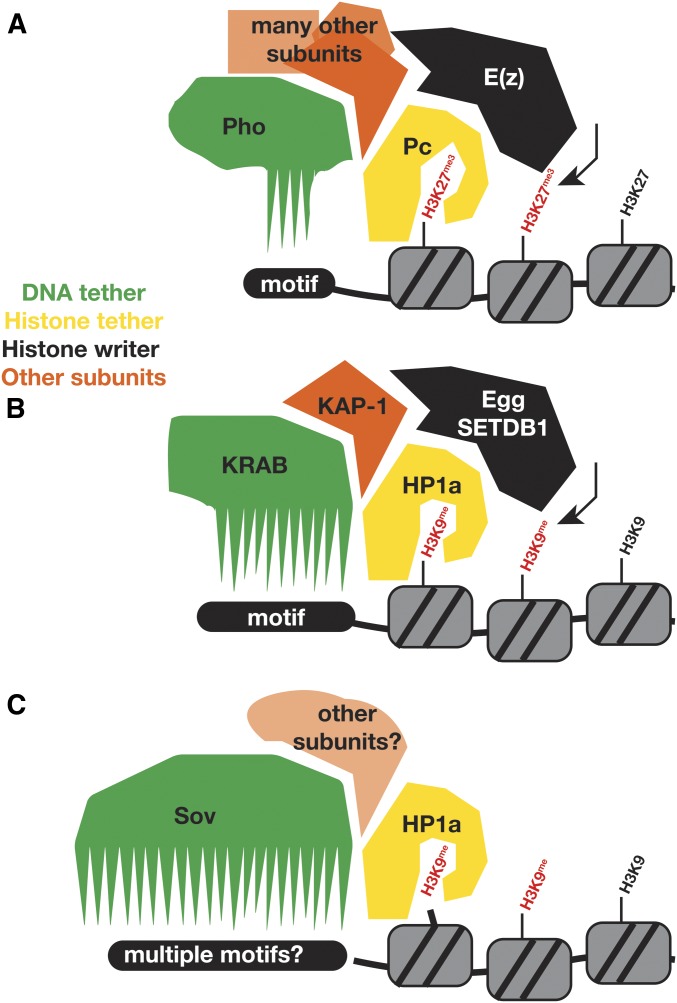
Heterochromatin-mediated repression is essential for controlling the expression of transposons and for coordinated cell type-specific gene regulation. The small ovary (sov) locus was identified in a screen for female-sterile mutations in Drosophila melanogaster, and mutants show dramatic ovarian morphogenesis defects. We show that the null sov phenotype is lethal and map the locus to the uncharacterized gene CG14438, which encodes a nuclear zinc-finger protein that colocalizes with the essential Heterochromatin Protein 1 (HP1a). We demonstrate Sov functions to repress inappropriate gene expression in the ovary, silence transposons, and suppress position-effect variegation in the eye, suggesting a central role in heterochromatin stabilization.

Keywords: HP1a; gene expression; heterochromatin; oogenesis; position-effect variegation; sov zinc-finger.


Figures

Figure 1
Figure 1
sov is CG14438. (A) Genes of the genomic interval X:6710000–6810000 (Gramates et al. 2017). (B) Deficiency (Df) and Duplication (Dp) mapping. Noncomplementing (sov, red) and complementing (sov+, green) alleles, and rearrangements, are shown. (C) Schematic of the CG14438 (black) and CR43496 (purple) genes. Transcription start sites (bent arrows), introns (thin lines), noncoding regions (medium lines), and coding regions (thick lines) are shown. Transposon insertions (red triangles), GFP tag insertion in rescuing transgene (green triangle), point mutations (red lines), the region targeted by the short hairpin RNA interference transgene (base-paired), and Sov protein features are shown. ChrX, X chromosome; NLS, nuclear localization sequence.
Figure 2
Figure 2
Sov is widely expressed and localizes to the soma and germline during oogenesis. (A) RNA expression tracks by tissue type from female (red) or male (blue) adults. (B) Cartoon of Drosophila egg chamber development showing germarium regions I–III and young egg chamber with cell types labeled. (C) Western blot analysis of WT (genotype: y1w67c23) and GFP-sov ovarian lysates probed for expression of tagged Sov protein using anti-FLAG and anti-GFP antibodies. βTub antibodies were used as a loading control. A specific band of ∼450 kDa is detected in GFP-sov extracts, corresponding to the predicted 446.6-kDa molecular weight of 3xFLAG-GFP-Sov. (D–F’) One-day-post eclosion WT germaria, visualized for GFP-Sov (green). All images show single optical sections and anterior is to the left. Dashed boxes highlight inset regions, magnified below. GFP-Sov is enriched in germarium region I (dashed line) with high expression in GSCs (arrows). (D) Sov contrasted with anti-αSpec to label spectrosomes (magenta) and anti-Vas to label germline (red). (E) Sov contrasted with anti-αSpec to label spectrosomes (red) and anti-Tj to label the soma (magenta). (F) Open arrowheads highlight localization of Sov within follicle cell nuclei outlined with WGA. (F’) Sov localizes within nurse cell and follicle cell nuclei in mature egg chambers. Bars, 10 μm, insets 5 μm. GSC, germline stem cell; reprod., reproductive; αSpec, αSpectrin; Tj, Traffic jam; Tub, Tubulin; Vas, Vasa; WGA, wheat germ agglutinin; WT, wild-type.
Figure 3
Figure 3
Sov permits normal oogenesis. (A–E) Maximum-intensity projections of germaria (0–2 day posteclosion) stained with anti-Vas (green), anti-Tj (magenta), αSpec (red), and DAPI (blue) in the noted genotypes, with excess dot spectrosomes (arrows) and empty ovarioles (asterisks) shown. (F–I) Quantification of ovarian differentiation phenotypes. sov2 represents the paternal allele in all genotypes. (F and H) Quantification of the number of dot spectrosomes per germarium from 0 to 2- or 5 to 6-day post eclosion females, respectively. (G and I) Quantification of the number of developing egg chambers per ovariole in 0–2- or 5–6-day post eclosion females, respectively. For quantification of dot spectrosomes within 0–2-day germaria, N = 28 sov2/+, N = 35 sov2/sovNP6070, N = 55 sov2/sovEA42, N = 80 sov2/sovML150, and N = 136 sov2/Df(1)sov. For quantification of the number of egg chambers within 0–2-day ovarioles, N = 26 sov2/+, N = 35 sov2/sovNP6070, N = 55 sov2/sovEA42, N = 76 sov2/sovML150, and N = 138 sov2/Df(1)sov. For quantification of dot spectrosomes within 5–6-day germaria, N = 51 sov2/+, N = 37 sov2/sovNP6070, N = 36 sov2/sovEA42, N = 64 sov2/sovML150, and N = 189 sov2/Df(1)sov. For quantification of the number of egg chambers within 5–6 day ovarioles, N = 41 sov2/+, N = 27 sov2/sovNP6070, N = 36 sov2/sovEA42, N = 62 sov2/sovML150, and N = 189 sov2/Df(1)sov. Data shown are from a single representative experiment, and the experiment was repeated twice with similar results. Bars, 10 μm. αSpec, αSpectrin; Tj, Traffic jam; Vas, Vasa.
Figure 4
Figure 4
Sov is required in the germline and soma. Immunofluorescence for the indicated probes in the noted genotypes. (A and B) Single optical sections of control (mCherryRNAi) and sovRNAi expressed in germaria (4–5 days post eclosion) using tj > GAL4 and stained with anti-Vas (blue), -Tj (green), -αSpec (red), and DAPI (white) with dot spectrosomes (arrows). (C) Cartoon of dominant female-sterile germline clonal analysis technique. Recombination occurs between homologs at FRT sequences only in the presence of HS-induced FLP expression (Chou and Perrimon 1996). (D) Quantification of vitellogenic egg production from sov germline mutant clones. HS was used (+) to induce expression of FLP, but was omitted (–, no HS) in controls. (E–G) Maximum intensity projections of egg chambers (1 day posteclosion) stained with anti-Orb (green), phalloidin (red), and DAPI (blue). Orb+ cells shown (*). Bars, (A–D) 20 μm, (G–I) 10 μm. HS, heat shock; RNAi, RNA interference; αSpec, αSpectrin; Tj, Traffic jam; Vas, Vasa.
Figure 5
Figure 5
sov functions as a repressor of gene expression. (A) Heatmap of all expressed genes in all genotypes assessed in this study. k-means cluster analysis (k = 5) was performed on gene RPKMs. The black bar demarks sterile vs. fertile phenotypes. (B) Heatmap of differentially expressed genes in sov mutants. k-means cluster analysis (k = 5) was performed on genes and clustered into groups 1–5. Group 1 (dotted box) represents genes that were derepressed in sov mutants and somatic knockdown of sov. Group 2 (solid box) represents genes that were derepressed in sov mutants and germline knockdown of sov. Values are mean-subtracted ratios scaled across genotypes (red = higher and blue = lower). Groups 3 and 4 represent genes showing allele-specific derepression. Group 5 shows genes that were repressed in sov mutants. The black bar demarks sterile vs. fertile phenotypes. (C) Tissue-biased expression in wild-type tissues for genes derepressed in sov mutant ovaries. Heatmap from mean-subtracted ratios scaled across tissues (red = higher and blue = lower). RPKM, reads per kilobase per million reads; NRC FC, normalized read count fold change.
Figure 6
Figure 6
Transposon expression in sov mutants. (A) Number of transposons with a greater (red) or less than (blue) fourfold change in gene expression (FDR padj value < 0.05) in sov mutants or RNAi knockdown when compared to controls. (B) Transposable element expression in sov mutants (sterile) and controls (fertile). Heatmap from mean-subtracted reads (in RPKM; red = higher and blue = lower) scaled for each transposable element (rows) across genotypes (columns). The black bar demarks sterile vs. fertile phenotypes. Transposon classes for DNA, non-LTR (Jockey), telomeric repeat (dashed box), and LTR (Gypsy, Copia, and PAO) are indicated. FDR, false discovery rate; rel. relative; RNAi, RNA interference; RPKM, reads per kilobase per million reads.
Figure 7
Figure 7
Sov is a dominant suppressor of position-effect variegation. (A) Cartoon of position-effect variegation in the eye. Expression of the white gene (bent arrow, thick bar, red) can be silenced (white) by proximal heterochromatin (squiggled) spreading. (B–F) Eyes from adults of the indicated genotypes (columns) with variegated expression of P{hsp26-pt-T} transgenes inserted into the indicated chromosomal positions (rows).
Figure 8
Figure 8
Sov colocalizes with HP1a. Stills from live imaging of embryos expressing GFP-Sov and RFP-HP1a. (A) Localization of GFP-Sov and RFP-HP1a (rows) in an embryo progressing from NC 10 to 11, with cell cycle stages (columns) and time (min:sec) shown. (B) NC 14 embryo. Boxed regions are magnified in insets below. An HP1a subnuclear domain is shown (arrows). (B’) Single optical section containing peak HP1a fluorescence of inset from (B). Dashed line indicates region used for histogram analysis. (A and B) Images show maximum projections through 1.5-μm volume and were captured at 1F/30 sec. Bar, 10 μm; insets, 5 μm. (C) Histogram of HP1a and Sov fluorescence intensity measured in (B’). Fluorescence levels (arbitrary units) normalized to the peak fluorescence intensity for each channel and the distance (μm) to peak HP1a signal. Half-maximum HP1a fluorescence is shaded (yellow). a.u., arbitrary units; NC, nuclear cycle; NEB, nuclear envelope breakdown; RFP, red fluorescent protein.
Figure 9
Figure 9
Working model of sov function. (A) Polycomb complexes (Pc) in flies and (B) Krüppel associated box (KRAB) complexes in mammals use a DNA-binding protein (Pho and KRAB; green) that binds sequence motifs in addition to histone code readers (Pc and HP1a; yellow), which bind to modified histones (red). These complexes also bear enzymes that create the histone marks [E(z) and Egg or SETDB1; black]. They have other proteins as well (such as KAP-1; orange). Like KRAB proteins, Sov is in complex with HP1a (yellow). We propose that it binds to DNA to provide another mechanism for tethering to chromosomes, in addition to HP1a binding to methylated H3K9. This partially redundant mechanism contributes to the stabilization of a repressed chromatin state.

References

    1. Alekseyenko A. A., Gorchakov A. A., Zee B. M., Fuchs S. M., Kharchenko P. V. et al. , 2014. Heterochromatin-associated interactions of Drosophila HP1a with dADD1, HIPP1, and repetitive RNAs. Genes Dev. 28: 1445–1460. 10.1101/gad.241950.114 - DOI - PMC - PubMed
    1. Anders S., Pyl P. T., and Huber W., 2015. HTSeq–a Python framework to work with high-throughput sequencing data. Bioinformatics 31: 166–169. 10.1093/bioinformatics/btu638 - DOI - PMC - PubMed
    1. Ashburner M., Ball C. A., Blake J. A., Botstein D., Butler H. et al. , 2000. Gene ontology: tool for the unification of biology. The Gene Ontology Consortium. Nat. Genet. 25: 25–29. 10.1038/75556 - DOI - PMC - PubMed
    1. Barton L. J., Lovander K. E., Pinto B. S., and Geyer P. K., 2016. Drosophila male and female germline stem cell niches require the nuclear lamina protein Otefin. Dev. Biol. 415: 75–86. 10.1016/j.ydbio.2016.05.001 - DOI - PMC - PubMed
    1. Beckstead R. B., Ner S. S., Hales K. G., Grigliatti T. A., Baker B. S. et al. , 2005. Bonus, a Drosophila TIF1 homolog, is a chromatin-associated protein that acts as a modifier of position-effect variegation. Genetics 169: 783–794. 10.1534/genetics.104.037085 - DOI - PMC - PubMed

Publication types

MeSH terms