. 2019 Dec 2;216(12):2838-2853.
doi: 10.1084/jem.20190111. Epub 2019 Sep 26.

Platelet-activating factor (PAF) mediates NLRP3-NEK7 inflammasome induction independently of PAFR

Affiliations

Platelet-activating factor (PAF) mediates NLRP3-NEK7 inflammasome induction independently of PAFR

Meng Deng et al. J Exp Med. .

Abstract

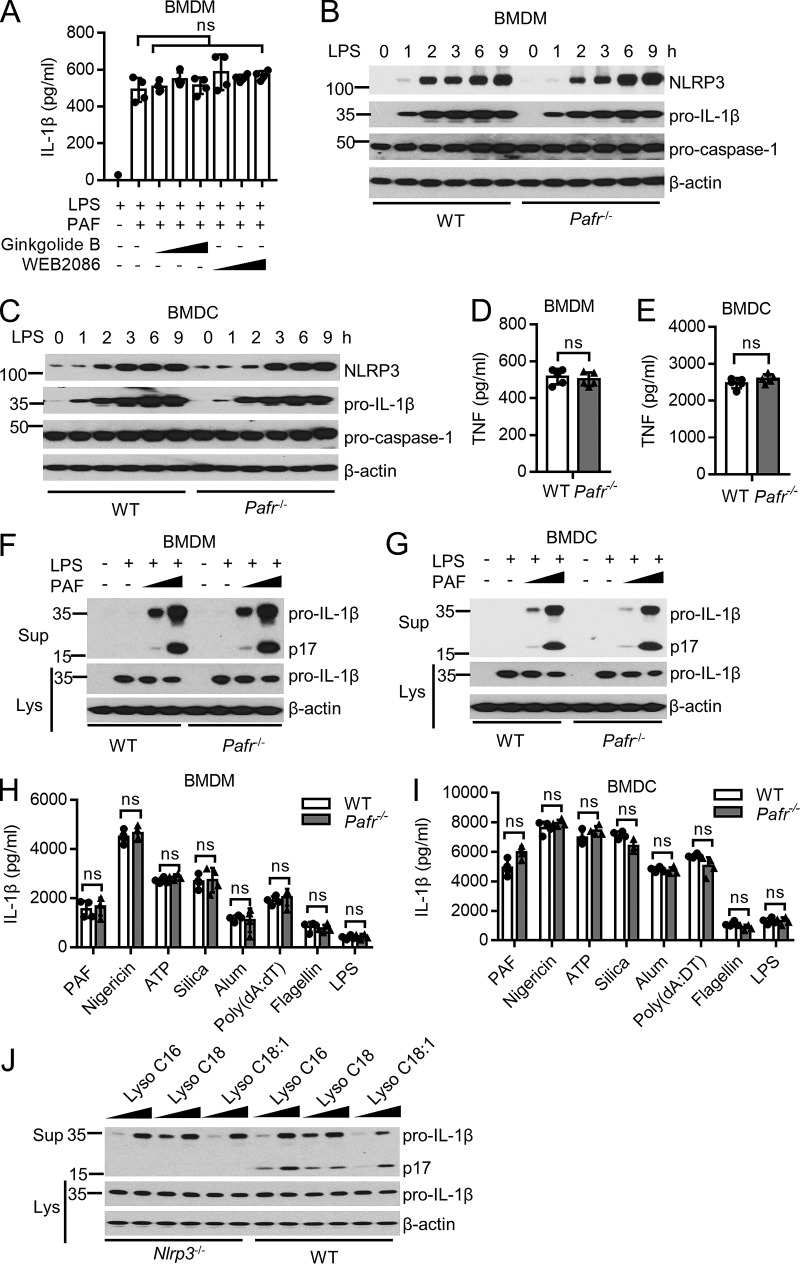
The role of lipids in inflammasome activation remains underappreciated. The phospholipid, platelet-activating factor (PAF), exerts multiple physiological functions by binding to a G protein-coupled seven-transmembrane receptor (PAFR). PAF is associated with a number of inflammatory disorders, yet the molecular mechanism underlying its proinflammatory function remains to be fully elucidated. We show that multiple PAF isoforms and PAF-like lipids can activate the inflammasome, resulting in IL-1β and IL-18 maturation. This is dependent on NLRP3, ASC, caspase-1, and NEK7, but not on NLRC4, NLRP1, NLRP6, AIM2, caspase-11, or GSDMD. Inflammasome activation by PAF also requires potassium efflux and calcium influx but not lysosomal cathepsin or mitochondrial reactive oxygen species. PAF exacerbates peritonitis partly through inflammasome activation, but PAFR is dispensable for PAF-induced inflammasome activation in vivo or in vitro. These findings reveal that PAF represents a damage-associated signal that activates the canonical inflammasome independently of PAFR and provides an explanation for the ineffectiveness of PAFR antagonist in blocking PAF-mediated inflammation in the clinic.


Figures

Figure 1.
Figure 1.
PAF induces IL-1β and IL-18 secretion in mouse and human myeloid cells. IL-1β or IL-18 ELISAs were performed in the following groups. (A and B) Resting or LPS-primed (300 ng/ml, 3 h) WT BMDMs stimulated with PAF (25 µM, 3 h) for the indicated time (A) or with PAF at indicated concentrations for 3 h (B). (C and D) Resting or LPS-primed (300 ng/ml, 3 h) BMDMs from WT, Il1b−/−, or Il18−/− mice stimulated with PAF (wedge, 25, 50, and 100 µM, 3 h). (E) WT BMDMs primed with different TLR agonists for 3 h (1 µg/ml Pam3CSK4 for TLR1/2, 107/ml HKLM for TLR2, 1 µg/ml poly(I:C) for TLR3, 1 µg/ml LPS-EK for TLR4, 1 µg/ml FLA-ST for TLR5, 1 µg/ml FSL-1 for TLR2/6, 1 µg/ml ssRNA40 for TLR7, and 200 ng/ml ODN1826 for TLR9), then stimulated with PAF (25 µM, 3 h). (F) LPS-primed (300 ng/ml, 3 h) WT BMDMs stimulated with different PAF isoforms or PAF-like lipids at indicated concentrations (3 h). (G) WT BMDMs primed with LPS (300 ng/ml, 3 h) or PAF (25 µM, 3 h) followed by nigericin treatment (10 µM, 3 h). (H and I) Primary human macrophages (H) and DCs (I) primed with LPS (20 ng/ml, 3 h) followed by PAF (wedge, 25 and 50 µM, 3 h) stimulation. Veh, vehicle control. Data are presented as mean ± SD from biological replicates and are representative of three independent experiments. *, P < 0.05; **, P < 0.01; ***, P < 0.001, unpaired Student’s t test.
Figure 2.
Figure 2.
PAF induces caspase-1 and IL-1β processing and ASC oligomerization. (A) Immunoblotting for caspase-1 and IL-1β using supernatants (Sup) and cell lysates (Lys) of LPS-primed (300 ng/ml, 3 h) WT BMDMs stimulated with PAF (wedge, 25 and 50 µM, 3 h) or nigericin (20 µM, 3 h). (B and C) IL-1β ELISA (B) and immunoblotting (C) using LPS-primed (300 ng/ml, 3 h) WT BMDMs stimulated with PAF (25 µM, 3 h) in the absence or presence of the pan-caspase inhibitor zVAD (wedge, 10 and 50 µM) or caspase-1 inhibitor zYVAD (wedge, 10 and 50 µM). (D) Confocal microscopy of LPS-primed (300 ng/ml, 3 h) ASC-citrine BMDMs stimulated with PAF (25 µM, 3 h), nigericin (10 µM, 3 h), or vehicle control (Veh). Green, ASC speck; blue, DAPI. Bars, 20 µm. (E) Immunoblotting of ASC oligomerization using cross-linked lysates of WT BMDMs treated in the same way as in D. Data are representative of three independent experiments. Data in B are presented as mean ± SD from biological replicates. ***, P < 0.001, one-way ANOVA. Protein marker size, kilodaltons.
Figure 3.
Figure 3.
PAF activates the canonical NLRP3 inflammasome. (A) IL-1β ELISA using supernatants from LPS-primed (300 ng/ml, 3 h) BMDMs of indicated genotype stimulated with PAF (25 µM), nigericin (10 µM), transfected poly(dA:dT) (2 ng/µl), transfected flagellin (1 ng/µl), transfected LPS (1 ng/µl), or vehicle control (Veh) for 3 h. (B and C) IL-1β immunoblotting using supernatants (Sup) and cell lysates (Lys) from resting or LPS-primed (300 ng/ml, 3 h) BMDMs of indicated genotypes stimulated with PAF (wedge, 25 and 50 µM) or Veh. (D and E) IL-1β ELISA (D) and immunoblotting (E) using Sup or Lys from resting or LPS-primed (300 ng/ml, 3 h) BMDMs of indicated genotypes stimulated with PAF (wedge, 25 and 50 µM) or Veh. (F and G) IL-1β ELISA (F) and immunoblotting (G) using resting or LPS-primed Sup or Lys of BMDMs of indicated genotypes stimulated with PAF (wedge, 25 and 50 µM) or Veh. (H–K) IL-1β immunoblotting using Sup or Lys from resting or LPS-primed (300 ng/ml, 3 h) BMDCs of indicated genotypes stimulated with PAF (wedge, 25 and 50 µM). Data are representative of three independent experiments. Data in A, D, and F are presented as mean ± SD from biological replicates. ***, P < 0.001. ns, not significant. One-way ANOVA (A), unpaired Student’s t test (D and F). Protein marker size, kilodaltons.
Figure 4.
Figure 4.
PAF-activated inflammasome requires NEK7 and is inhibited by an NLRP3 inhibitor, MCC950. (A and B) IL-1β ELISA (A) and immunoblotting (B) using supernatant (Sup) and cell lysate (Lys) of LPS-primed (300 ng/ml, 3 h) WT or Nek7−/− BMDMs stimulated with PAF (25 µM), nigericin (10 µM), ATP (5 mM), silica (300 µg/ml), transfected poly(dA:dT) (2 ng/µl), transfected flagellin (1 ng/µl), transfected LPS (1 ng/µl), or vehicle control (Veh) for 3 h. (C) TNF ELISA using supernatants of LPS-treated (300 ng/ml, 3 h) BMDMs. (D and E) NLRP3 and IL-1β immunoblotting using cell lysates (D) and TNF ELISA using supernatants from resting or LPS-primed (300 ng/ml, 3 h) WT BMDMs (E) in the presence of increasing doses of MCC950 (wedge, 0, 50, 500, and 5,000 nM). (F and G) IL-1β ELISA (F) and immunoblotting (G) of LPS-primed (300 ng/ml, 3 h) WT BMDMs stimulated with PAF (25 µM), nigericin (5 µM), transfected poly(dA:dT) (2 ng/µl), transfected flagellin (1 ng/µl), transfected LPS (1 ng/µl), or vehicle control (Veh) in the absence or presence of MCC950 at the concentrations shown in F. Data are representative of three independent experiments. Data in A, C, E, and F are presented as mean ± SD from biological replicates. *, P < 0.05; **, P < 0.01; ***, P < 0.001. ns, not significant. Unpaired Student’s t test (A and C); one-way ANOVA (E and F). Protein marker size, kilodaltons.
Figure 5.
Figure 5.
GSDMD is not required for IL-1β secretion induced by PAF. (A) Immunoblot of supernatants (Sup) and cell lysates (Lys) from resting or LPS-primed (300 ng/ml, 3 h) WT BMDMs stimulated with or without PAF (25 µM, 3 h). (B) Immunoblot of Sup or Lys from LPS-primed (300 ng/ml, 3 h) WT BMDMs stimulated with nigericin (10 µM, 3 h) or PAF (25 µM, 3 h). (C) IL-1β ELISA using supernatants from LPS-primed (300 ng/ml, 3 h) WT or Gsdmd−/− BMDMs stimulated with PAF (25 µM), ATP (10 mM), or silica (300 µg/ml) for the indicated time. (D) Immunoblot of supernatants from LPS-primed (300 ng/ml, 3 h) WT or Gsdmd−/− BMDMs stimulated with PAF (25 µM) for indicated time. Data are representative of three independent experiments. Data in C are presented as mean ± SD from biological replicates. **, P < 0.01; ***, P < 0.001. ns, not significant. Unpaired Student’s t test (C). FL, full-length. Protein marker size, kilodaltons.
Figure 6.
Figure 6.
PAF activation of the inflammasome is independent of PAFR. (A) IL-1β ELISA using supernatants from LPS-primed (300 ng/ml, 3 h) WT BMDMs stimulated with 25 µM PAF in the absence or presence of PAFR antagonist Ginkgolide B (wedge, 10, 50, and 100 µM) or WEB2086 (wedge, 10, 50, and 100 µM) for 3 h. (B and C) Immunoblot of cell lysates from WT and Pafr−/− BMDMs (B) or BMDCs (C) treated with LPS (300 ng/ml) for the indicated time. (D and E) TNF ELISA using supernatants from LPS-primed (300 ng/ml, 3 h) WT and Pafr−/− BMDMs (D) or BMDCs (E). (F and G) Immunoblot using supernatants (Sup) and cell lysates (Lys) from resting or LPS-primed (300 ng/ml, 3 h) WT and Pafr−/− BMDMs (F) or BMDCs (G) stimulated with PAF (wedge, 25 and 50 µM). (H and I) IL-1β ELISA using supernatants from LPS primed WT or Pafr−/− BMDMs (H) or BMDCs (I) stimulated with PAF (25 µM), nigericin (10 µM), ATP (5 mM), silica (300 µg/ml), alum (300 µg/ml), transfected poly(dA:dT) (2 ng/µl), transfected flagellin (1 ng/µl), or transfected LPS (1 ng/µl) for 3 h. (J) Immunoblot of supernatants or cell lysates from LPS-primed (300 ng/ml, 3 h) WT and Nlrp3−/− BMDMs stimulated with the indicated lysoPAF isoforms (wedge, 25 and 50 µM). Data are representative of three independent experiments. Data in A, D, E, H, and I are presented as mean ± SD from biological replicates. ns, not significant. One-way ANOVA (A); unpaired Student’s t test (D, E, H, and I). Protein marker size, kilodaltons.
Figure 7.
Figure 7.
PAF activation of inflammasome requires calcium, potassium flux, reduced cAMP, and intact lipid rafts, but not ROS, cathepsin, ATP, or uric acid signaling. (A–G and I–K) IL-1β immunoblotting using supernatants (Sup) and lysates (Lys) from LPS-primed (300 ng/ml, 3 h) WT BMDMs stimulated with PAF (25 µM, 3 h) in the absence or presence of indicated inhibitors or enzymes (A, B, D–G, and I–K) or cultured in Ca2+-free medium (C). Concentrations used are as follows: U73122 (2 and 10 µM), 2-APB (20 and 100 µM), BAPTA-AM (10 and 20 µM), KCl (25 and 50 mM), NAC (5 and 25 mM), APDC (10 and 50 µM), Mitotempo (100 and 500 µM), DPI (5 and 25 µM), CA-074-ME (10 and 20 µM), A-804598 (100 µM), A-740003 (100 µM), apyrase (1 U/ml), uricase (1 U/ml), forskolin (25 and 100 µM), ro-20-1724 (100 and 250 µM), zardaverine (100 and 250 µM), MβCD (5 and 15 mM), Filipin III (2.5 and 12.5 µg/ml). ATP (5 mM) in G. (H) IL-1β immunoblotting using LPS-primed (300 ng/ml, 3 h) WT and P2x7r−/− BMDMs stimulated with PAF (25 µM), ATP (5 mM), or nigericin (10 µM) for 3 h. Veh, vehicle control. The image in E is assembled from two sections of the same blot, and the break between these two sections is indicated by a dashed line. Data are representative of three independent experiments. w/o, without. Protein marker size, kilodaltons.
Figure 8.
Figure 8.
PAF induces NLRP3 inflammasome activation in vivo independently of PAFR. (A) Schematic representation of the in vivo experimental design. (B–E) Serum IL-1β by ELISA (B), serum IL-18 (C), peritoneal neutrophil influx (D), and serum TNF (E) from WT mice treated as depicted in A. (F–I) Serum IL-1β (F), IL-18 (G), peritoneal neutrophil influx (H), and serum TNF (I) from mice of indicated genotype challenged as depicted in A, but only with LPS followed by lysoPAF. (J) Neutrophil influx from WT and Il1r1−/− mice challenged as in A, but only with LPS followed by lysoPAF. (K–N) Serum IL-1β (K), IL-18 (L), peritoneal neutrophil influx (M), and serum TNF (N) from Pafr−/− mice treated as in A, but with lysoPAF replaced with PAF. (O and P) IL-1β (O) and IL-18 ELISA (P) of peritoneal lavage in WT and Pafr−/− mice after 3-h LPS treatment followed by 30-min PAF treatment. Veh, vehicle control. Data are presented as mean ± SEM. Data in B–I are one representative experiment of three independent experiments. Data in J–N are pooled from three independent experiments. Data in O and P are pooled from two independent experiments. **, P < 0.01; ***, P < 0.001. ns, not significant. One-way ANOVA (B–I and K-N); unpaired Student’s t test (J, O, and P).

References

    1. Agostini L., Martinon F., Burns K., McDermott M.F., Hawkins P.N., and Tschopp J.. 2004. NALP3 forms an IL-1β-processing inflammasome with increased activity in Muckle-Wells autoinflammatory disorder. Immunity. 20:319–325. 10.1016/S1074-7613(04)00046-9 - DOI - PubMed
    1. Bazan N.G. 2003. Synaptic lipid signaling: significance of polyunsaturated fatty acids and platelet-activating factor. J. Lipid Res. 44:2221–2233. 10.1194/jlr.R300013-JLR200 - DOI - PubMed
    1. Benveniste J., Henson P.M., and Cochrane C.G.. 1972. Leukocyte-dependent histamine release from rabbit platelets. The role of IgE, basophils, and a platelet-activating factor. J. Exp. Med. 136:1356–1377. 10.1084/jem.136.6.1356 - DOI - PMC - PubMed
    1. Bürckstümmer T., Baumann C., Blüml S., Dixit E., Dürnberger G., Jahn H., Planyavsky M., Bilban M., Colinge J., Bennett K.L., and Superti-Furga G.. 2009. An orthogonal proteomic-genomic screen identifies AIM2 as a cytoplasmic DNA sensor for the inflammasome. Nat. Immunol. 10:266–272. 10.1038/ni.1702 - DOI - PubMed
    1. Callea L., Arese M., Orlandini A., Bargnani C., Priori A., and Bussolino F.. 1999. Platelet activating factor is elevated in cerebral spinal fluid and plasma of patients with relapsing-remitting multiple sclerosis. J. Neuroimmunol. 94:212–221. 10.1016/S0165-5728(98)00246-X - DOI - PubMed

Publication types

MeSH terms

Substances