. 2019 Sep 26;10(1):4383.
doi: 10.1038/s41467-019-12185-7.

The hidden structure of human enamel

Affiliations

The hidden structure of human enamel

Elia Beniash et al. Nat Commun. .

Abstract

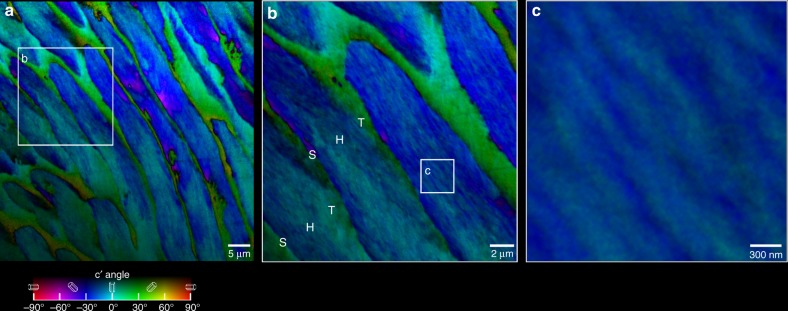
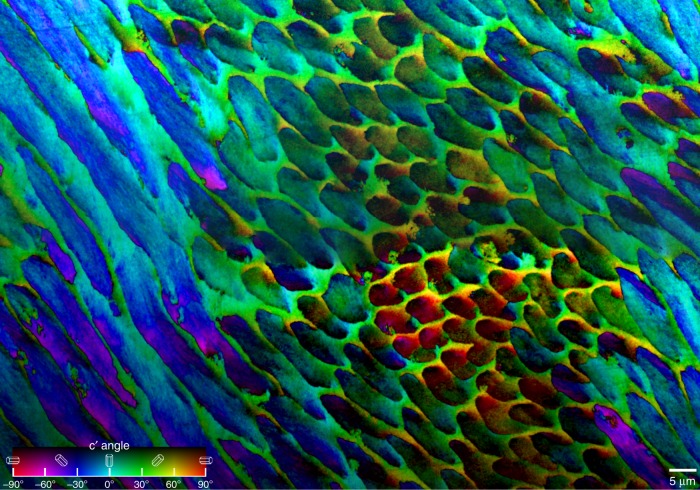
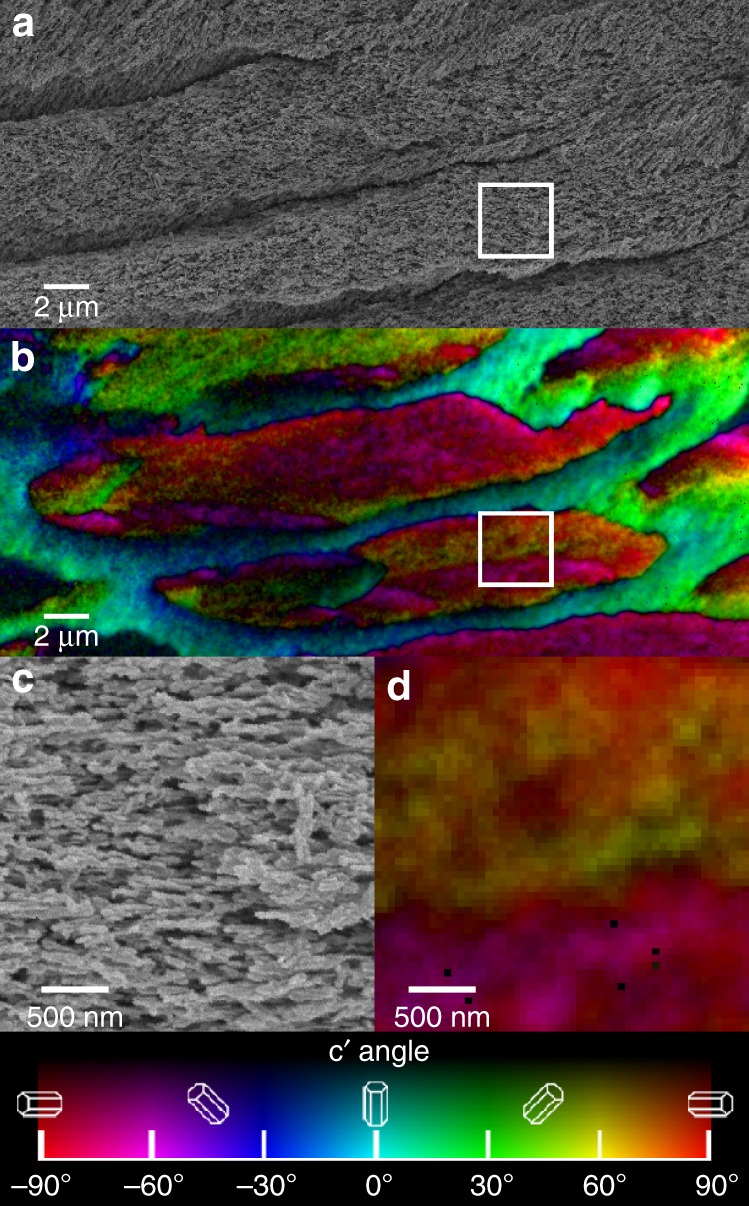
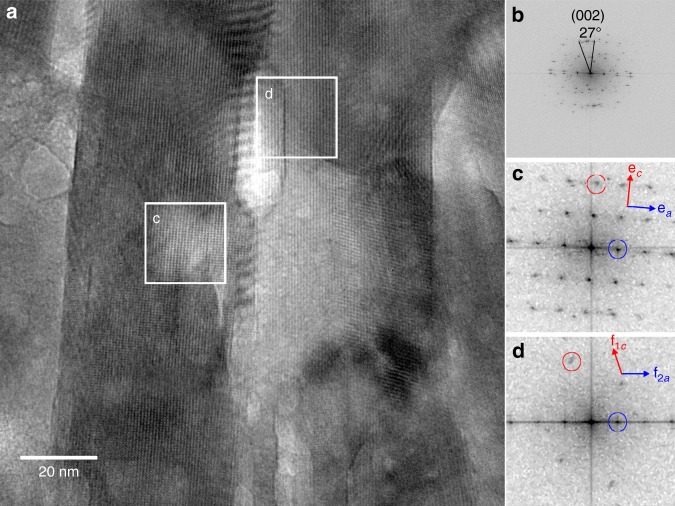
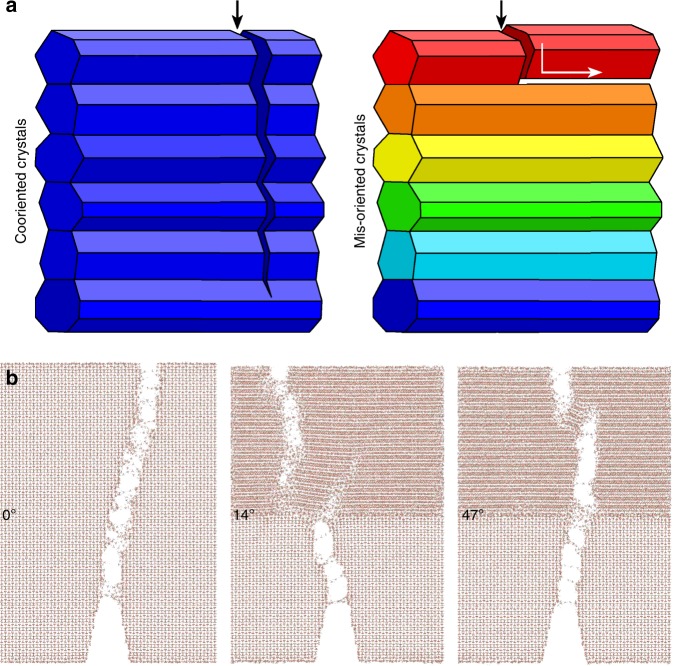
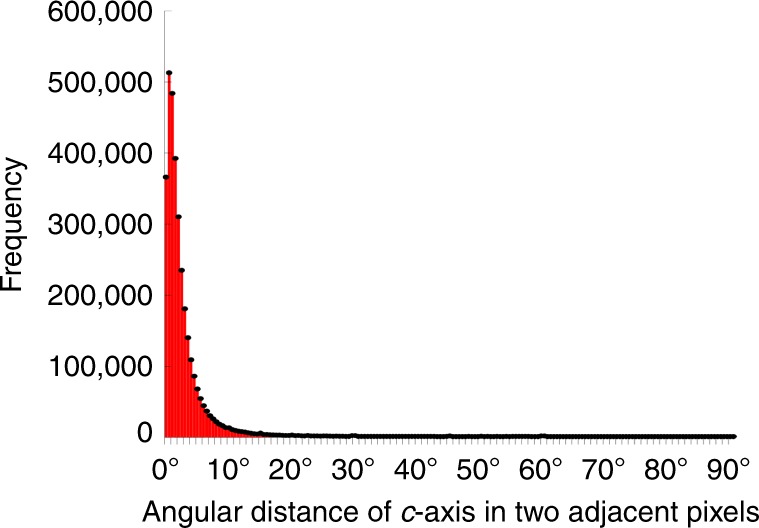
Enamel is the hardest and most resilient tissue in the human body. Enamel includes morphologically aligned, parallel, ∼50 nm wide, microns-long nanocrystals, bundled either into 5-μm-wide rods or their space-filling interrod. The orientation of enamel crystals, however, is poorly understood. Here we show that the crystalline c-axes are homogenously oriented in interrod crystals across most of the enamel layer thickness. Within each rod crystals are not co-oriented with one another or with the long axis of the rod, as previously assumed: the c-axes of adjacent nanocrystals are most frequently mis-oriented by 1°-30°, and this orientation within each rod gradually changes, with an overall angle spread that is never zero, but varies between 30°-90° within one rod. Molecular dynamics simulations demonstrate that the observed mis-orientations of adjacent crystals induce crack deflection. This toughening mechanism contributes to the unique resilience of enamel, which lasts a lifetime under extreme physical and chemical challenges.


Conflict of interest statement

The authors declare no competing interests.

Figures

Fig. 1
Fig. 1
PIC maps revealing the hidden crystal orientation structure of inner enamel. a Low magnification map of polished cross-section of human enamel (see Supplementary Fig. 3 for the position of this area in the enamel polished cross-section). Notice the ~5 µm wide rods with a significant number of crystal c-axes oriented along the rod axis (blue). However, many other crystals are oriented ±30° off the rod axis (cyan and magenta). The c-axes of interrod crystals are highly co-oriented, as evident from the homogeneously green hue (+30° from the vertical in the lab and in this image) almost everywhere, with just a few orange pixels (+60°). b Zoomed-in PIC map acquired in the correspondingly labeled box in a, showing the fine details of the rod and interrod crystal orientation and arrangement. Notice in b that the transitions in crystallographic orientations between a rod head (H) and its interrod tail (T) is gradual, whereas the transition from the interrod to the next rod’s head is abrupt and these are separated by an organic sheath (S). c Zoomed-in region in b, where individual crystals inside the rod are parallel to each other but their c-axes are not co-oriented, thus single or multiple co-oriented crystals stand out as different colors, e.g. blue surrounded by cyan or vice versa. Typical crystal width is ~50 nm, resolution and pixel size are both 22 nm in b and c, and 60 nm in a
Fig. 2
Fig. 2
PIC mapping reveals the hidden crystal orientation structure in a large area of inner enamel. The map shows Hunter–Schreger bands, or decussation pattern, in inner enamel, with three groups of rods exposed on this polished surface: in longitudinal (left), transverse (right of center), and oblique (center, right) cross-sections. See Supplementary Fig. 3 for the exact position of this area in the tooth
Fig. 3
Fig. 3
Comparison of SEM image and PIC map of the same region of human enamel. a The SEM image, acquired after etching, reveals two well-distinct rods, separated by interrod and deeper groves, and surrounded by other partial rods. b The PIC map shows that the same two well-distinct rods have multiple orientations within them, as all other rods imaged in this work. Since the bottom has more diverse orientations, we chose this rod to zoom-in further in (c) and (d), where the white boxes are located in (a) and (b) respectively. c Zoomed-in SEM image showing that all crystals are approximately horizontal and parallel to one another. d Zoomed-in PIC map showing that crystals from top to bottom of the box vary from red, to orange, to green in the top half, which is a 60° angle spread, and from red to magenta in the bottom half, which is a 30° angle spread. See Supplementary Figs. 4 and 5 for the exact position of this area in the tooth, and for the SEM image warping necessary to overlap precisely the bottom rod in the PIC map. This warping makes the top rod imprecisely correspond to the top rod in the PIC map
Fig. 4
Fig. 4
Crystal orientations of a thin section within a human outer enamel rod showing c-axis misorientation by 23°, 27°, and >18°. a HR-TEM micrograph taken from a 130 nm × 130 nm × 100 nm volume within an outer enamel rod, with crystals elongated in plane from top to bottom in (a) (termed vertical hereafter). b Fast Fourier transform (FFT) analysis of the entire image in (a), showing that two of the crystals within this entire volume have their c-axes mis-oriented by 27°. e, f FFT power spectra extracted from (c) and (d) in (a), which include crystals with their (100) planes almost parallel and vertical. In e and f red circles and arrows identify (002) spacings and c-axis directions, respectively; blue circles and blue arrows identify (100) spacings and directions of a-axes, respectively. The (e) FFT indicates the presence of a single crystal of carbonated apatite with its c-axis oriented 5° clockwise from the vertical and its a-axis at 90° from the c-axis as expected for apatite. The (f) FFT indicates the presence of two overlapping crystals, f1 and f2. The a-axis of crystal f1 is horizontal (blue circle). No (001) lattice fringes were detected for f1, thus its c-axis is out of the image plane in (a). The c-axis of crystal f2 is oriented at 18° counterclockwise from the vertical (red circle). No (100) lattice fringes were detected for f2, thus its a-axis is out of the image plane in (a). Crystal f2 is oriented with its c-axis 18° counterclockwise from the vertical, thus the angle between the c-axes of crystals f1 and f2 is at least 18°, but it could be as large as 90°. The c-axes of crystals e and f2 are 18° + 5° = 23° apart. Since enamel crystals are on average 26 nm × 63 nm in cross-section, the 30-nm wide crystals at the center of the image in (a) must be oriented nearly edge-on. Since this section is 100 nm thick, all three crystals identified in the FFTs are either in close proximity to or directly abutting one another. Thus, the c-axes of crystals in close proximity are 23°, 27° and somewhere between 18° and 90° apart. Supplementary Fig. 5 shows where the tooth sample was FIBed to extract this thin section
Fig. 5
Fig. 5
Crystal mis-orientation provides a toughening mechanism. a Schematic of the mechanisms: co-oriented crystals (blue) enable crack propagation across different crystals, precisely because they are co-oriented. When crystals are mis-oriented (colors), instead, cracks deflect at crystal interfaces, thus they cannot propagate or grow over long distances, and the material is tougher. b Molecular dynamics simulations of grain boundaries, where hydroxyapatite crystals are mis-oriented by 0°, 14°, or 47°. Notice that the crack starting from the bottom propagates straight through the 0° interface, is deflected at the 14°, and again not deflected at the 47° interface. See Supplementary Movies 1, 2, 3
Fig. 6
Fig. 6
Histograms of angular distances of crystalline c-axes. The angular distances, in three-dimensional space, between the c-axes in each two adjacent 60-nm pixels, measured across all the pixels in Fig. 2. Almost all angular distances are below 30° and the peak is at 1°. Supplementary Fig. 11 shows additional histograms acquired every 2, 4, 8, 16, 32, 64, 128, or 256 pixels, demonstrating that orientations change gradually from pixel to pixel, thus from crystal to crystal within all enamel components. Small spikes around 30°, 40°, 45°, 50°, and 60° corresponds to rod–interrod interfaces without organic sheath
Fig. 7
Fig. 7
Aprismatic enamel at the tooth cusp surface. Notice that the aprismatic enamel is indistinguishable from the interrod, it just does not have any rods (previously termed prisms, whence the name of this aprismatic layer). See Supplementary Fig. 3 for the precise position of this region in the tooth. a PIC map of aprismatic enamel, showing that nearly all crystals are green, thus their c-axis is oriented at +30°. bf SEM images of the same region after etching. b SEM image at precisely the same magnification as the PIC map in a, with magenta arrows indicating a hole in the tooth surface, infiltrated with epoxy, which resisted etching, and two rods. Arrows in a point to the same features before etching. c SEM image of the same region at lower magnification. The arrows were scaled down with the image, and indicate precisely the same features. df Increasingly magnified images of etched aprismatic enamel. The blue arrow in panels bf indicate a feature visible in all SEM images and well resolved in df. Panels e and f clearly show that all crystals are aligned parallel to one another and perpendicular to the tooth surface. Panel e shows this as the elongation direction, which is −36° from the vertical. Their green color in b indicates a c-axis orientation of +30° from the vertical (also shown in e), thus the c-axes are 66° apart from the elongation direction, or 24° apart from the tooth surface. Thus, the crystalline c-axes are approximately parallel—not perpendicular—to the tooth surface. Supplementary Fig. 12 shows more PIC maps of the aprismatic layer in another tooth, confirming that crystalline c-axes are oriented randomly with respect to the tooth surface

Similar articles

Cited by

References

    1. Varga S, et al. Maximum voluntary molar bite force in subjects with normal occlusion. Eur. J. Orthodon. 2010;33:427–433. doi: 10.1093/ejo/cjq097. - DOI - PubMed
    1. Wegst UG, Bai H, Saiz E, Tomsia AP, Ritchie RO. Bioinspired structural materials. Nat. Mater. 2015;14:23–36. doi: 10.1038/nmat4089. - DOI - PubMed
    1. Lawn BR, Lee JJ-W, Chai H. Teeth: among nature’s most durable biocomposites. Ann. Rev. Mater. Res. 2010;40:55–75. doi: 10.1146/annurev-matsci-070909-104537. - DOI
    1. Chai H, Lee JJW, Constantino PJ, Lucas PW, Lawn BR. Remarkable resilience of teeth. Proc. Natl Acad. Sci. USA. 2009;106:7289–7293. doi: 10.1073/pnas.0902466106. - DOI - PMC - PubMed
    1. Lewin R. Tooth enamel tells a complex story. Science. 1985;228:707–707. doi: 10.1126/science.3992241. - DOI - PubMed

Publication types