. 2019 Sep 26;10(1):4388.
doi: 10.1038/s41467-019-12376-2.

A 'parameiosis' drives depolyploidization and homologous recombination in Candida albicans

Affiliations

A 'parameiosis' drives depolyploidization and homologous recombination in Candida albicans

Matthew Z Anderson et al. Nat Commun. .

Abstract

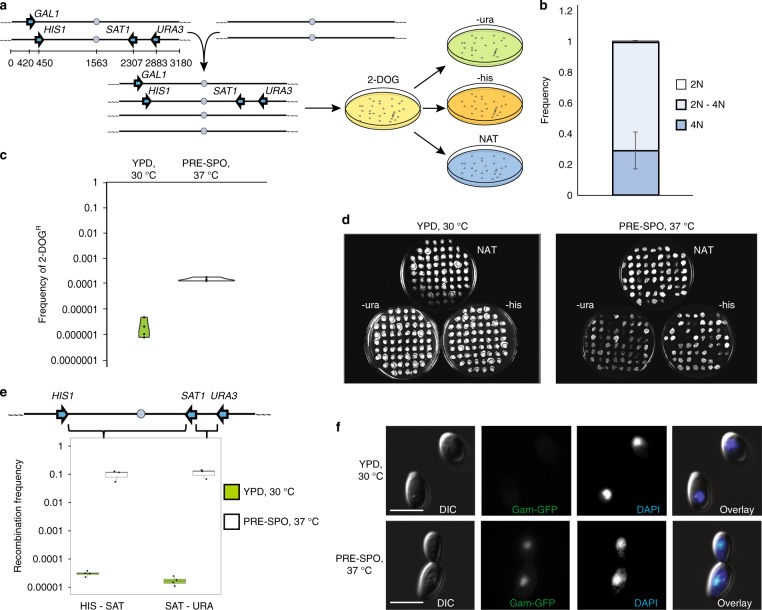
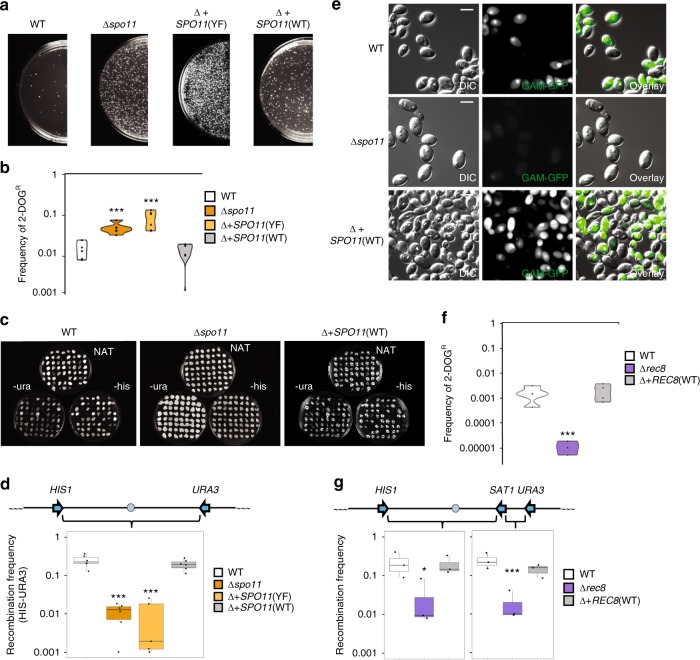
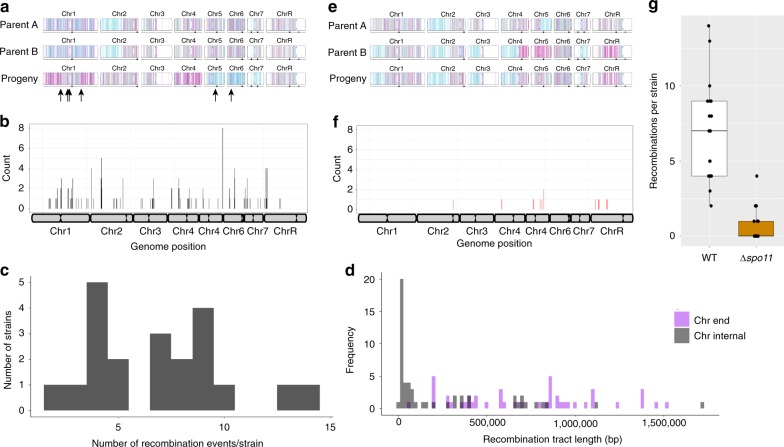
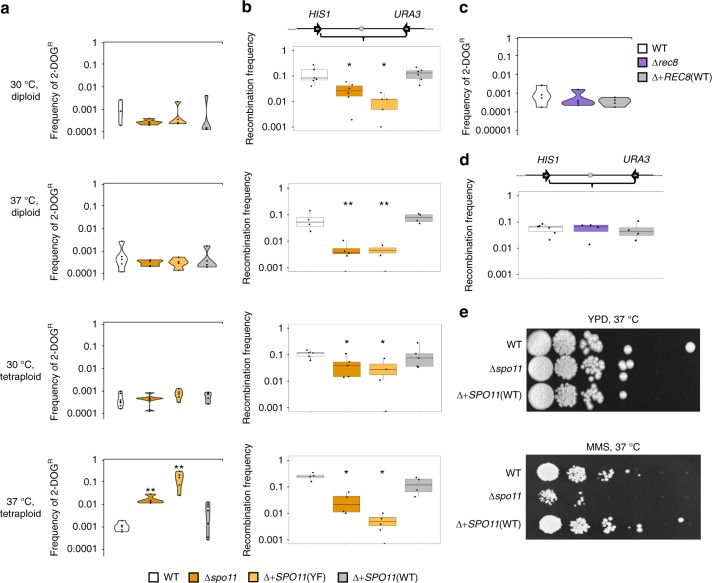
Meiosis is a conserved tenet of sexual reproduction in eukaryotes, yet this program is seemingly absent from many extant species. In the human fungal pathogen Candida albicans, mating of diploid cells generates tetraploid products that return to the diploid state via a non-meiotic process of depolyploidization known as concerted chromosome loss (CCL). Here, we report that recombination rates are more than three orders of magnitude higher during CCL than during normal mitotic growth. Furthermore, two conserved 'meiosis-specific' factors play central roles in CCL as SPO11 mediates DNA double-strand break formation while both SPO11 and REC8 regulate chromosome stability and promote inter-homolog recombination. Unexpectedly, SPO11 also promotes DNA repair and recombination during normal mitotic divisions. These results indicate that C. albicans CCL represents a 'parameiosis' that blurs the conventional boundaries between mitosis and meiosis. They also reveal parallels with depolyploidization in mammalian cells and provide potential insights into the evolution of meiosis.


Conflict of interest statement

The authors declare no competing interests.

Figures

Fig. 1
Fig. 1
High rates of inter-homolog recombination during concerted chromosome loss (CCL). a Schematic showing the construction and screening of a genetically marked tetraploid strain for monitoring chromosome loss and recombination. b Frequency of different ploidy states in 2-DOGR (gal1) progeny derived from tetraploid cells by CCL. Error bars signify standard deviation. n = 3 biologically independent experiments. c Frequency of 2-DOGR colonies following growth of the genetically marked tetraploid strain on solid agar under standard conditions (green; YPD, 30 °C) or under conditions that promote CCL (white; PRE-SPO medium, 37 °C) for 7 days. n = 4 biologically independent experiments. d Example images of selection plates indicating growth of progeny on selective media for different markers. e Recombination frequencies in HIS1-SAT1 and SAT1-URA3 intervals following growth on standard medium (green) or CCL-inducing medium (white) for 7 days. SAT1 encodes resistance to nourseothricin (NATR). Boxplots are presented as the 75th to 25th percentile with the thick line denoting the median. Whiskers indicate the largest and smallest values within 1.5 × of the interquartile range. f C. albicans tetraploid cells expressing the Gam-GFP construct following 24 h growth on PRE-SPO or YPD medium (CCL-inducing or standard growth conditions, respectively). Scale bar, 5 μm. Error bars indicate standard deviation
Fig. 2
Fig. 2
Homologous recombination during CCL requires the ‘meiosis’ factors Spo11 and Rec8. a Images of plates illustrating 2-DOGR colonies produced by CCL in C. albicans wildtype and Δspo11 tetraploid strains, as well as in Δspo11 strains complemented with wildtype SPO11, SPO11(WT), or an active site mutant, SPO11(YF). b Quantification of the frequency of 2-DOGR colonies in different strain backgrounds following CCL. n = 6 biologically independent experiments. c Images of plates examining CCL progeny grown on different selective media. d Frequency of recombination in CCL progeny from different strain backgrounds. n = 6 biologically independent experiments. e Analysis of Gam-GFP signal in tetraploid strains with different SPO11 genotypes undergoing CCL. Images shown after 24 h on PRE-SPO medium with 50 μg/mL doxycycline at 37 °C. Scale bars = 5 μm. f Quantification of the frequency of 2-DOGR colonies in different REC8 strain backgrounds following CCL. n = 4 biologically independent experiments. g Frequency of recombination in CCL progeny derived from different REC8 strain backgrounds in HIS1-SAT1 and SAT1-URA3 intervals. n = 3 biologically independent experiments. * denotes p < 0.05. *** denotes p < 0.001 as calculated by two-sample t b, f or Wilcoxon d, g tests. Boxplots are presented as the 25th to 75th percentile with the thick line denoting the median. Whiskers indicate the largest and smallest values within 1.5 × of the interquartile range. White, orange, light orange, and gray denote WT, Δspo11, Δ+SPO11(YF), and Δ+SPO11(WT), respectively. White, purple, and gray denote WT, Δrec8, and Δ+REC8(WT), respectively
Fig. 3
Fig. 3
Genomic analysis of C. albicans CCL progeny. Parental and progeny genotypes are shown for three representative strains in WT a and Δspo11 e backgrounds. The parental genotypes are indicated on the top two lines with a representative progeny underneath. Arrows indicate recombination breakpoints. Homozygous alleles for homolog A or B are represented by cyan and magenta lines, respectively, with heterozygous positions denoted as gray. The recombination breakpoints were mapped to the genome across all 21 genotyped WT b and Δspo11 f progeny. c The number of recombination events within each WT progeny following CCL. d The length of each recombination tract in WT progeny was determined for chromosome internal tracts (gray) and tracts extending to the chromosome end (purple). n = 46 biologically independent data points. g The number of recombination breakpoints was compared for WT (white) and Δspo11 (orange) progeny. Boxplots are presented as the 25th to 75th percentile with the thick line denoting the median. Whiskers indicate the largest and smallest values within 1.5 × of the interquartile range. n = 20 biologically independent samples
Fig. 4
Fig. 4
Spo11, but not Rec8, promotes recombination in mitotically dividing C. albicans cells. ad Genetically marked diploid and tetraploid C. albicans strains were serially passaged in YPD medium at 30 °C or 37 °C (cells diluted 1:100 every 24 h), and evaluated for loss of the GAL1 marker (2-DOGR frequency) and for the frequency of recombination in the HIS1-URA3 interval. a Frequency of 2-DOGR colonies in diploid/tetraploid wildtype and SPO11 mutant strains. n = 4, 5, 6, and 6 biologically independent experiments for 30 oC diploid, 37 oC diploid, 30 oC tetraploid, and 37 oC tetraploid, respectively. b Frequency of recombination between HIS1 and URA3 on Chr1 in diploid/tetraploid wildtype and SPO11 mutant strains. n = 4, 4, 5, and 5 biologically independent experiments for 30 oC diploid, 37 oC diploid, 30 oC tetraploid, and 37 oC tetraploid, respectively. c Frequency of 2-DOGR colonies in wildtype or REC8 mutant tetraploid strains passaged at 30 oC. n = 4 biologically independent experiments. d Analysis of recombination in the HIS1-URA3 interval for wildtype or REC8 mutant tetraploid strains passaged at 30 oC. n = 4 biologically independent experiments. e Tenfold spot dilution assays performed for wildtype, Δspo11, and SPO11-complemented tetraploid cells grown on YPD medium in the presence or absence of 0.01% methyl methanesulfonate (MMS) and imaged after 2 days at 37 oC. * denotes p < 0.05. ** denotes p < 0.01 as calculated by two-sample t (chromosome loss) or Wilcoxon (recombination frequency) tests. Boxplots are presented as the 25th to 75th percentile with the thick line denoting the median. Whiskers indicate the largest and smallest values within 1.5 × of the interquartile range. White, orange, light orange, and gray denote WT, Δspo11, Δ+SPO11(YF), and Δ+SPO11(WT), respectively. White, purple, and gray denote WT, Δrec8, and Δ+REC8(WT), respectively

References

    1. Schurko AM, Logsdon JM., Jr Using a meiosis detection toolkit to investigate ancient asexual “scandals” and the evolution of sex. Bioessays. 2008;30:579–589. doi: 10.1002/bies.20764. - DOI - PubMed
    1. Speijer D, Lukes J, Elias M. Sex is a ubiquitous, ancient, and inherent attribute of eukaryotic life. Proc. Natl Acad. Sci. USA. 2015;112:8827–8834. doi: 10.1073/pnas.1501725112. - DOI - PMC - PubMed
    1. Goddard MR. Molecular evolution: sex accelerates adaptation. Nature. 2016;531:176–177. doi: 10.1038/nature17304. - DOI - PubMed
    1. Goddard MR, Godfray HC, Burt A. Sex increases the efficacy of natural selection in experimental yeast populations. Nature. 2005;434:636–640. doi: 10.1038/nature03405. - DOI - PubMed
    1. McDonald MJ, Rice DP, Desai MM. Sex speeds adaptation by altering the dynamics of molecular evolution. Nature. 2016;531:233–236. doi: 10.1038/nature17143. - DOI - PMC - PubMed

Publication types