. 2019 Sep 26;9(1):13940.
doi: 10.1038/s41598-019-50371-1.

How to copy and paste DNA microarrays

Affiliations

How to copy and paste DNA microarrays

Stefan D Krämer et al. Sci Rep. .

Abstract

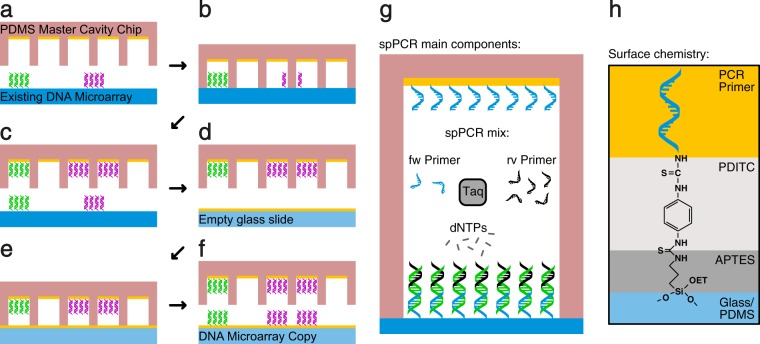
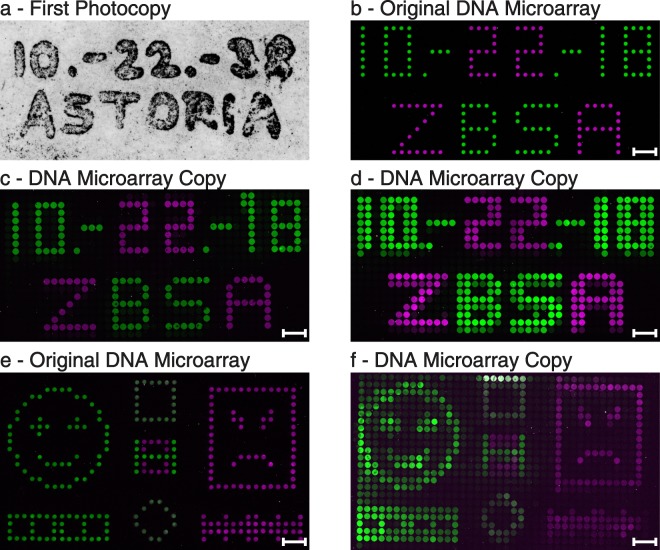
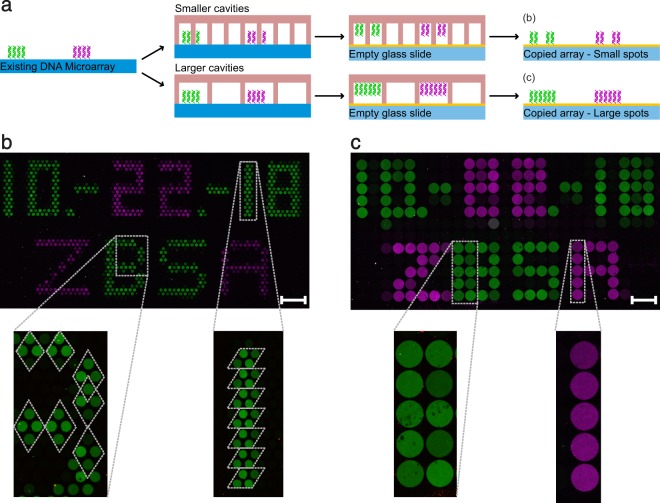
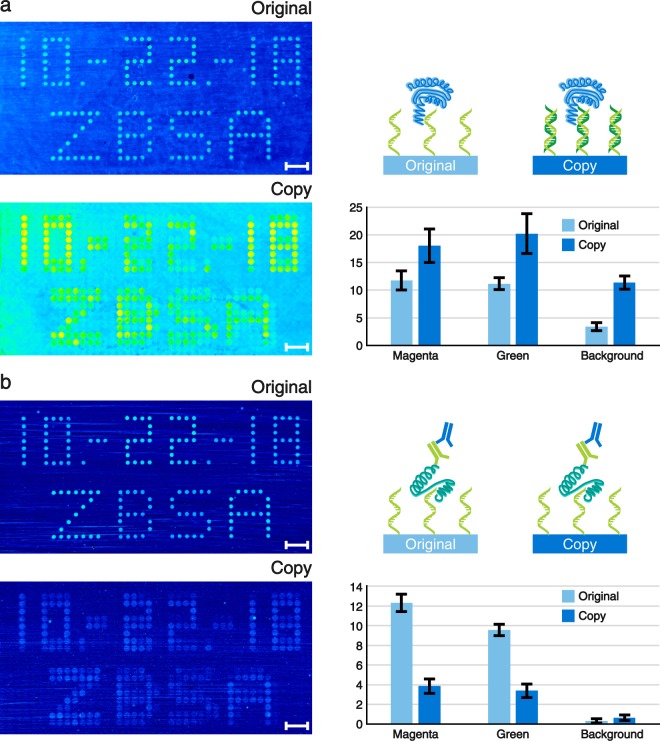
Analogous to a photocopier, we developed a DNA microarray copy technique and were able to copy patterned original DNA microarrays. With this process the appearance of the copied DNA microarray can also be altered compared to the original by producing copies of different resolutions. As a homage to the very first photocopy made by Chester Charlson and Otto Kornei, we performed a lookalike DNA microarray copy exactly 80 years later. Those copies were also used for label-free real-time kinetic binding assays of apo-dCas9 to double stranded DNA and of thrombin to single stranded DNA. Since each DNA microarray copy was made with only 5 µl of spPCR mix, the whole process is cost-efficient. Hence, our DNA microarray copier has a great potential for becoming a standard lab tool.


Conflict of interest statement

SDK, JW and GR are inventors of the presented method which is filed as pending patent (PCT/EP2019/062502).

Figures

Figure 1
Figure 1
The principle of DNA microarray copying. (a) A PDMS master cavity chip coated with primer is filled with spPCR mix and placed on top of an original DNA microarray consisting of two different DNA species (magenta and green). (b) After closing, a first spPCR is performed to amplify the DNA and (c) to attach it to the inside of the cavities. (d) The cavity chip is washed, blocked, and refilled with fresh spPCR mix. (e) The cavity chip is placed on top of an empty glass slide coated with primer and a second spPCR is performed. (f) After the spPCR, the cavity chip is opened, revealing a copy of the original DNA microarray. The position, size and number of the cavities limits the spatial resolution of the copy. In this example, the green DNA spot is enclosed by one cavity resulting in one dot in the copy. The magenta DNA spot is enclosed by two cavities, hence creating two magenta DNA dots. (g) Illustration of the spPCR components. One PCR primer species is attached to the surface. After an initial amplification in liquid phase, the PCR reaction is forced to the surface. (h) Illustration of the chemical composition of the surface. The individual layers are indicated using different colors.
Figure 2
Figure 2
Examples of DNA microarray copies. (a) The very first photocopy made by Chester Charlson (Courtesy of Xerox Corporation). (b) Our lookalike spotted original DNA microarray containing date and institute name. (c) A DNA microarray copy of the original DNA microarray with a perfect alignment of DNA spots and cavities. (d) Another DNA microarray copy, but with a misalignment of DNA spots and cavities, generating a blurred copy. (e) A spotted original DNA copy comprised of a happy and an angry smiley with additional structures. (f) The corresponding copy of the original smiley array. (c,d,f) Image contrasts were enhanced by a factor of 4 in the green channel and by a factor of 7 in the magenta channel for better visualization. The scale bars show a length of 1 mm. All illustrated copies were produced using cavity chip 2 (Supplementary Table S1), with cavity diameters of 300 µm and a cavity distance of 50 µm. Spotted original spots have a diameter of 180 µm and a spot distance of 170 µm.
Figure 3
Figure 3
DNA microarray copies can also be performed with altered resolutions. (a) Schematic representation of the performed microarray copy approach. The principles are similar to the method shown in Fig. 1a–f. However, this time cavity chips were used with smaller (b) or larger (c) cavity diameters compared to the original spot sizes. (b) Hybridised fluorescent image of the small cavity (150 µm) copy with enlarged sections. (c) Hybridised fluorescent image of the large cavity (500 µm) copy with enlarged sections. Dotted lines in the enlarged pictures illustrate the Moiré pattern. The scale bars show a length of 1 mm. Cavity chip type 1 was used for the high resolution copy (b) and cavity chip type 3 was used for the lower resolution copy (c).
Figure 4
Figure 4
Two examples of spot merging (a,b). The original DNA microarrays (left) were produced by digital solid phase PCR using our PDMS master cavity chips. Thereafter, copies of lower resolution were performed (right). In each case, the middle dots (red dashed circle) of the copies show a pink to white colour, indicating that they are mixtures of both, the magenta and green DNA species. Scale bars show a length of 100 µm.
Figure 5
Figure 5
Label-free SCORE measurement pictures of (a) apo-dCas9 and (b) thrombin binding to the original and copied DNA microarrays are shown on the left. The more yellow to red the spots and dots appear, the stronger is the binding signal. Corresponding schematic representations and bar plots illustrating the average binding signals of the spots are shown to the right of each assay. The units of the bar plots are given in milliSCORE. The apo-dCas9 assay was performed using the protein only, whereas for the thrombin measurement a three step assay with thrombin followed by a primary and a secondary antibody was used. The binding signals of the spots were averaged according to their fluorescent colours (see Fig. 2). Background signals were assessed by measuring four large background areas around the array region. The values of the bar plots represent the means and the error bars show their standard deviations. N-values for (a): original-magenta = 244; original-green = 98; copy-magenta = 122; copy-green = 159. N-values for (b): original-magenta = 71; original-green = 98; copy-magenta = 59; copy-green = 183. N-values of all backgrounds equal 4. Scale bars show the length of 1 mm.

References

    1. Heller MJ. DNA microarray technology: devices, systems, and applications. Annu. Rev. Biomed. Eng. 2002;4:129–153. doi: 10.1146/annurev.bioeng.4.020702.153438. - DOI - PubMed
    1. Bumgarner, R. Overview of DNA Microarrays: Types, Applications, and Their Future. In Current Protocols in Molecular Biology Chapter 22, Unit 22.1. (John Wiley & Sons, Inc., 2013). - PMC - PubMed
    1. DeRisi J, et al. Use of a cDNA microarray to analyse gene expression. Nat. Genet. 1996;14:457–460. doi: 10.1038/ng1296-457. - DOI - PubMed
    1. Fodor SP, et al. Light-directed, spatially addressable parallel chemical synthesis. Science (80-.). 1991;251:767–773. doi: 10.1126/science.1990438. - DOI - PubMed
    1. Tindall KR, Kunkel TA. Fidelity of DNA synthesis by the Thermus aquaticus DNA polymerase. Biochemistry. 1988;27:6008–6013. doi: 10.1021/bi00416a027. - DOI - PubMed

Publication types

MeSH terms