. 2019 Jul 31;6(18):1901441.
doi: 10.1002/advs.201901441. eCollection 2019 Sep 18.

Perturbed Microbial Ecology in Myasthenia Gravis: Evidence from the Gut Microbiome and Fecal Metabolome

Affiliations

Perturbed Microbial Ecology in Myasthenia Gravis: Evidence from the Gut Microbiome and Fecal Metabolome

Peng Zheng et al. Adv Sci (Weinh). .

Erratum in

Abstract

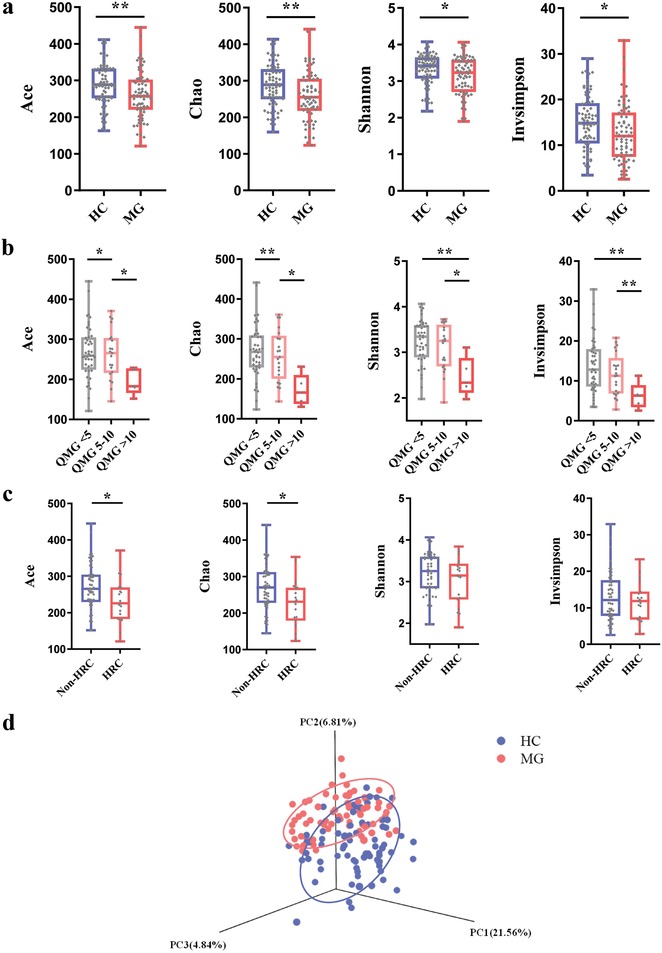
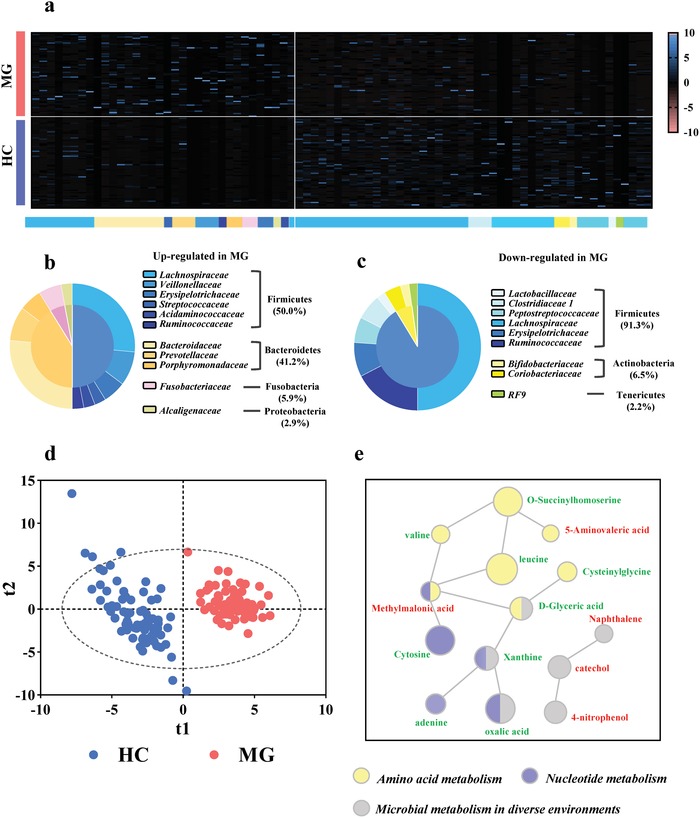
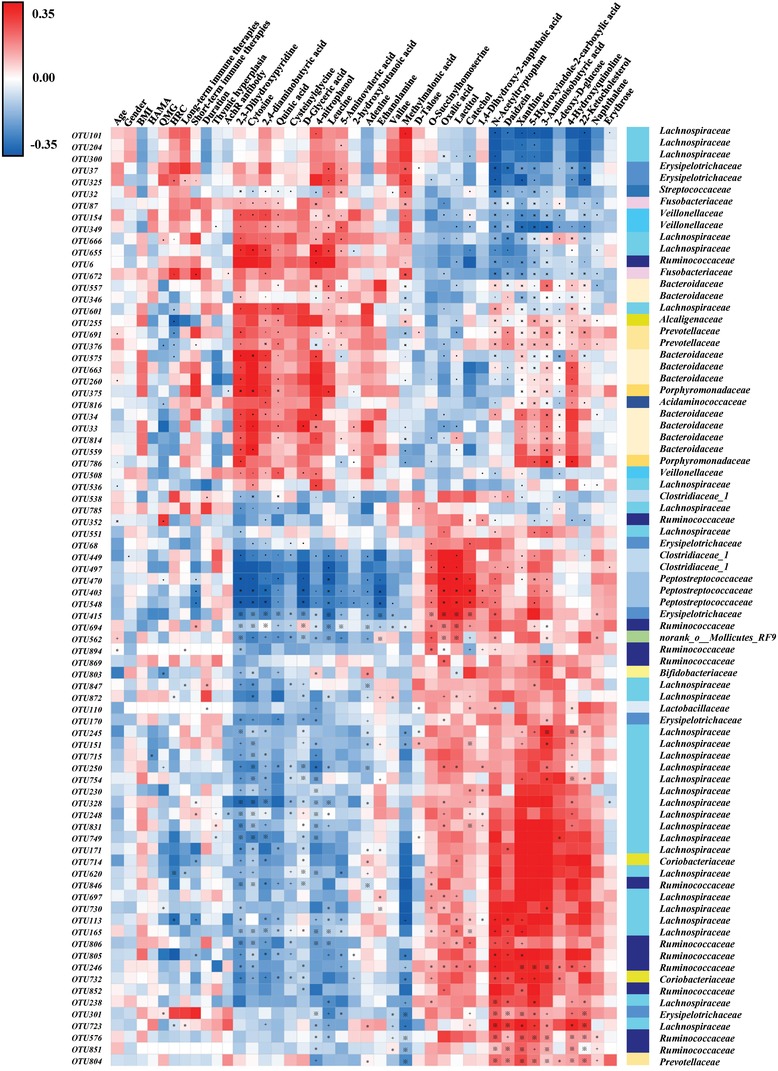
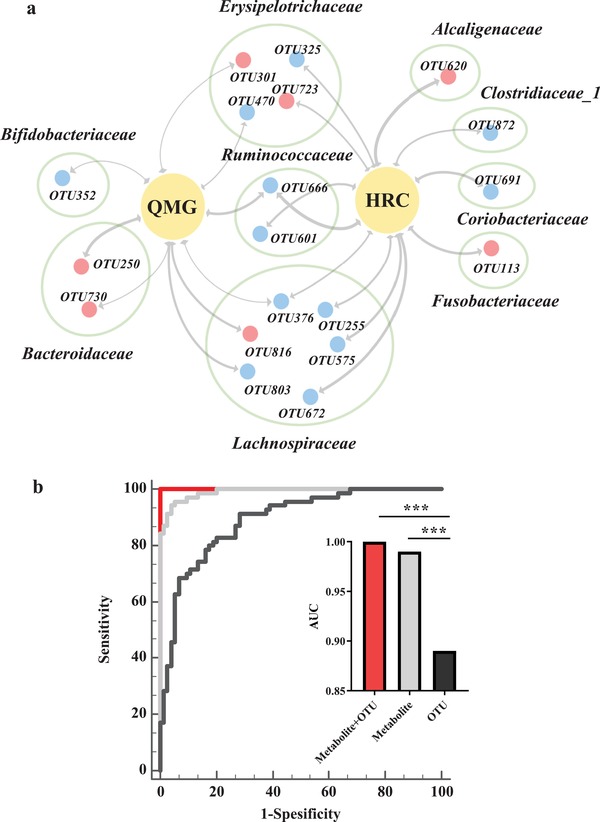
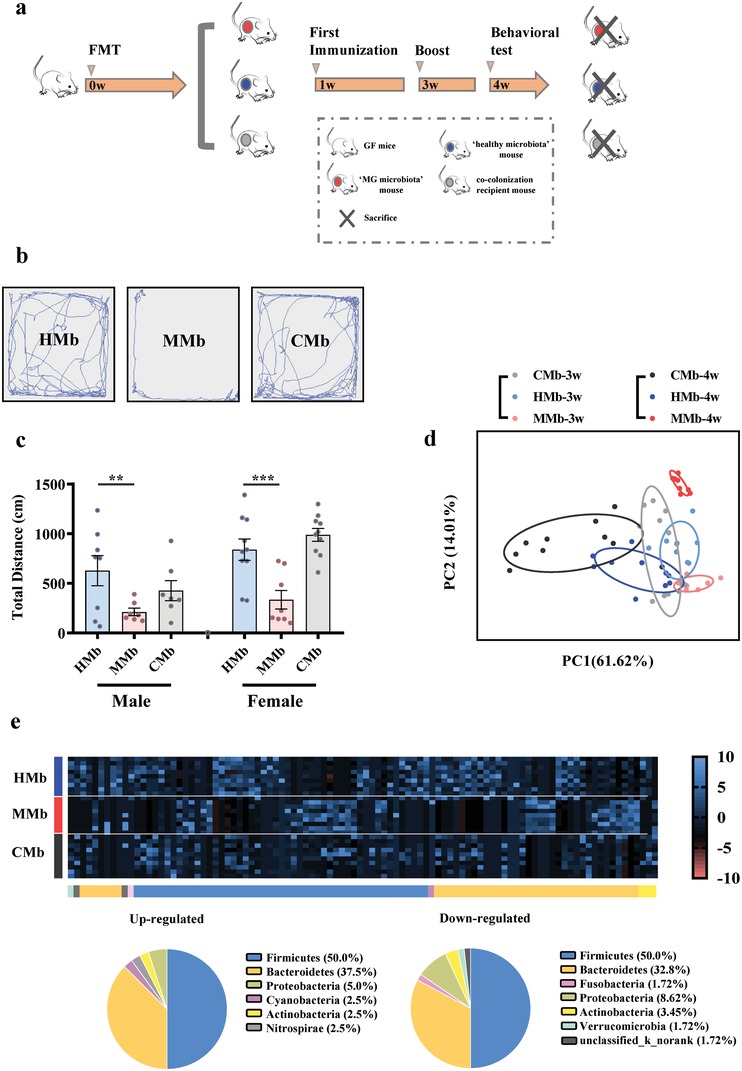
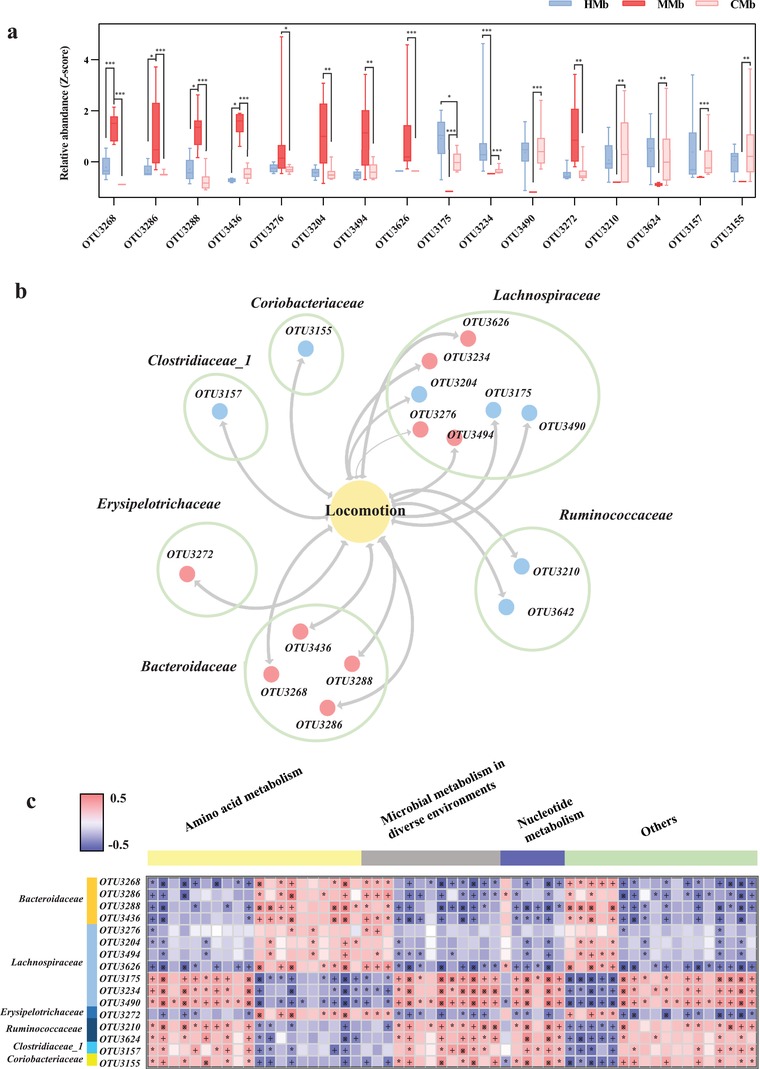
Myasthenia gravis (MG) is a devastating acquired autoimmune disease. Emerging evidence indicates that the gut microbiome plays a key role in maintaining immune system homeostasis. This work reports that MG is characterized by decreased α-phylogenetic diversity, and significantly disturbed gut microbiome and fecal metabolome. The altered gut microbial composition is associated with fecal metabolome changes, with 38.75% of altered bacterial operational taxonomic units showing significant correlations with a range of metabolite biomarkers. Some microbes are particularly linked with MG severity. Moreover, a combination of microbial makers and their correlated metabolites enable discriminating MG from healthy controls (HCs) with 100% accuracy. To investigate whether disturbed gut mcirobiome might contribute to the onset of MG, germ-free (GF) mice are initially colonized with MG microbiota (MMb) or healthy microbiota (HMb), and then immunized in a classic mouse model of MG. The MMb mice demonstrate substantially impaired locomotion ability compared with the HMb mice. This effect could be reversed by cocolonizing GF mice with both MMb and HMb. The MMb mice also exhibit similar disturbances of fecal metabolic pathways as found in MG. Together these data demonstrate disturbances in microbiome composition and activity that are likely to be relevant to the pathogenesis of MG.

Keywords: fecal microbiota transplantation; germ‐free mice; gut microbiome; metabolome; myasthenia gravis.


Conflict of interest statement

The authors declare no conflict of interest.

Figures

Figure 1
Figure 1
Gut microbial characteristics of myasthenia gravis (MG). a) α‐phylogenetic diversity analysis showing that MG subjects were characterized by lower microbial richness in four indexes (Ace, Chao, Shannon, and Invsimpson) relative to healthy controls (n = 74, HC; n = 70, MG). b) The MG subjects with different QMG scores showing different α‐phylogenetic diversity indexes (n = 70, MG). The four α‐ diversity indexes consistently decreased with the increases of QMG scores, highlighting a robust association between lower some α‐ diversity indexes and MG severity.(QMG < 5, n = 44; QMG = 5–10, n = 21; QMG > 10, n = 5). c) The MG subjects with history of respiratory crisis (HRC, n = 19) showing lower ACE and Chao indexes compared to the non‐history of respiratory crisis subjects (Non‐ HRC, n = 51). As the HRC is a hallmark of MG severity, this finding also confirms the association between α‐ diversity indexes and MG severity. d) At the operational taxonomic units (OTU) level, 3D principal co‐ordinates analysis showed that gut microbial composition of patients with MG was significantly different from that in healthy controls (n = 74, HC; n = 70, MG).
Figure 2
Figure 2
Gut microbial characteristics of MG. a) Using linear discriminant analysis (LEfSe), 80 differential OTUs responsible for discriminating the gut microbiota in MG and HCs subjects were identified. Heatmap of the 80 discriminative OTUs abundances between MG subjects and healthy controls; b,c) 34 upregulated OTUs in MG are arranged on the left, while 46 decreased OTUs are arranged on the right. The taxonomic assignment of each OTU is provided on the above of Heatmap. Most of the upregulated OTUs belongs to Firmicutes (50.0%), Bacteroidetes (41.2%) and Fusobacteria (5.9%), while downregulated OTUs mainly belongs to Firmicutes (91.3%) and Actinobacteria (6.5%). d) The Partial least‐squares discriminant analysis (PLS‐DA) scores plot showing a clear discrimination between MG subjects and HCs. e) The key disturbed metabolic pathways in MG. The red label indicates the increased metabolites, while the green label indicates the decreased metabolites in MG subjects relative to HCs. The p‐value of each metabolite is represented by the circle area. IPA software analysis showed that MG was mainly associated with disturbances of amino acid metabolism, nucleotide metabolism and microbial metabolism in diverse environments. (n = 74, HC; n = 70, MG).
Figure 3
Figure 3
Associations of gut microbial species with fecal metabolites and clinical indexes. Heat map of the Spearman's rank correlation coefficient of 80 gut microbial OTUs and 30 metabolites as well as 11 clinical indexes. Red squares indicate positive associations between these microbial species and metabolites or clinical indexes; blue squares indicate negative associations. The statistical significance was denoted on the squares (*p < 0.05; +p < 0.01; ※p < 0.001). 31 of 80 differential microbial variances (38.75%) were significantly associated with differential metabolites (p value < 0.001 and correlation coefficient were ≥0.35 or ≤−0.35, tested by Spearman correlation). Moreover, some gut microbial OTUs were slightly associated with some clinical parameters such as gender, HAMA, long‐term immune therapies, duration, thymic hyperplasia and well‐established acetylcholine receptor (AchR) antibody, but highly linked with indicators of MG severity (QMG score, HRC, and short‐term immune therapies). Abbreviation: BMI, body mass index; HAMA, Hamilton anxiety scale; QMG, quantitative myasthenia gravis; HRC, history of respiratory crisis.
Figure 4
Figure 4
Microbial and metabolite markers for MG. a) the association between MG severity and microbial OTUs. 21 OTUs were significantly linked with MG severity (QMG score and HRC). Majority of these OTUs mainly belonged to Lachnospiraceae (6 OTUs), Erysipelotrichaceae (4 OTUs), and Bacteroidaceae (2 OTUs) at family level. Red dots indicate the upregulated microbial OTUs, while blue dots indicate the downregulated OTUs in MG related to HCs. The thickness of the line represents the size of the p‐value (p < 0.05). b) diagnostic markers for MG: Combination of 4 microbial marker (Clostridiaceae 1, Lachnospiraceae, Erysipelotrichaceae, and Bacteroidaceae) and 6 metabolites (leucine, cytosine, oxalicacid, N‐Acetyltryptophan, d‐Glyceric acid, and xanthine) can distinguish the MG from HCs with an area under the curve (AUC) of 1 (accuracy of 100%), which was significantly higher than that of separate microbial or metabolic markers.
Figure 5
Figure 5
a) The workflow of fecal microbiota transplant (FMT) experiment. Briefly, adult male a germfree (GF) Kunming mice were colonized with fecal samples derived from MG patients or healthy controls, thus generating the “MG microbiota” recipient mice(MMb) and “healthy microbiota” recipient mice (HMb). Moreover, to further verify the effect of gut microbiome on behavior, an independent GF mice group was simultaneously colonized with fecal samples from both MG and HC to generate the cocolonization recipient mice. Three groups were immunized twice at second and fourth weeks. The Openfield test (OFT) was performed at fifth weeks. To verify the generality of the results, we conducted two separate experiments using both female and male GF mice. b,c) Representative motion tracks for a “MG microbiota” mouse (MMb), a “healthy microbiota” mouse (HMb) and a cocolonization recipient mouse (CMb). The total motion distance of “MG microbiota” was substantially decreased compared to of that in “healthy microbiota” recipient mice, and showed no significant differences with that in cocolonization recipient mice. The consistent results were observed while using the male and female GF mice in the two independent experiments (n = 8/HMb male group, n = 7/MMb male group, n = 7/CMb male group; n = 10/HMb female group, n = 8/MMb female group, n = 10/CMb female group). Data presented as means ± standard error of mean. * p < 0.05, **p < 0.01, ***p < 0.001 by one‐way ANOVA. d) At the operational taxonomic units (OTU) level, principal component analysis showed that gut microbiota composition of “MG microbiome” recipient mice was significantly different from that in healthy controls. e) Using linear discriminant analysis (LEfSe), 98 differential OTUs responsible for discriminating the gut microbiota in MMb and HMb mice were identified. Heatmap of the 98 discriminative OTUs abundances between MG subjects and healthy controls; 40 upregulated OTUs in MMb mice are arranged on the left part of the image, and 58 decreased OTUs are arranged on the right part. The taxonomic assignment of each OTU is provided on the above of Heatmap. (n = 10, HMb; n = 8, MMb; n = 10, CMb).
Figure 6
Figure 6
Gut microbial characteristics of MMb mice. a,b) 16 of 54 reversed OTUs mainly belonging to Lachnospiraceae (7 OTUs), Bacteroidaceae (4 OTUs), and Ruminococcaceae (2 OTUs) were linked with the total motion distance in the OFT (n = 10, HMb; n = 8, MMb; n = 10, CMb). This finding was highly similar with what had been observed in analysis of correlation between altered microbes and MG severity. Red dots indicate the upregulated microbial OTUs, while blue dots indicate the downregulated OTUs in MMb mice related to HMb mice, the thickness of the line represents the size of the p‐value (p < 0.05). c) Associations of gut microbial OTUs with fecal metabolites. Heat map of the Spearman's rank correlation coefficient of 16 gut microbial OTUs and 57 metabolites. The MMb mice was characterized by changes of amino acid metabolism, nucleotide metabolism and microbial metabolism in diverse environments. Red squares indicate positive associations between these microbial OTUs and metabolites; blue squares indicate negative associations (n = 9, HMb; n = 8, MMb). The statistical significance was denoted on the squares (*p < 0.05; +p < 0.01; ※p < 0.001).

References

    1. Gilhus N. E., N. Engl. J. Med. 2016, 375, 2570. - PubMed
    1. Gilhus N. E., Skeie G. O., Romi F., Lazaridis K., Zisimopoulou P., Tzartos S. Nat. Rev. Neurol. 2016, 12, 259. - PubMed
    1. Evoli A., Curr. Opin. Neurol. 2017, 30, 464. - PubMed
    1. Crisp S. J., Kullmann D. M., Vincent A., Nat. Rev. Neurosci. 2016, 17, 103. - PubMed
    1. Guptill J. T., Soni M., Meriggioli M. N., Neurotherapeutics 2016, 13, 118. - PMC - PubMed

LinkOut - more resources