Review
. 2019 Aug;9(Suppl 1):S37-S58.
doi: 10.21037/cdt.2018.08.05.

Pulmonary arteries: imaging of pulmonary embolism and beyond

Affiliations
Review

Pulmonary arteries: imaging of pulmonary embolism and beyond

Ellen M Leitman et al. Cardiovasc Diagn Ther. 2019 Aug.

Abstract

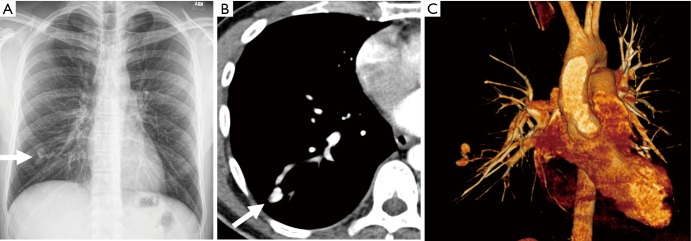
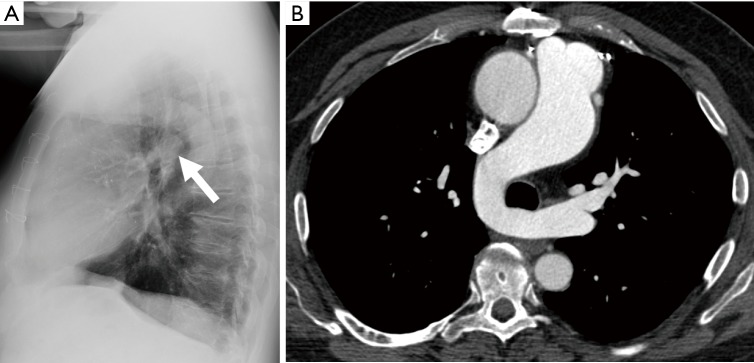
The pulmonary arteries are not just affected by thrombus. Various acquired and congenital conditions can also affect the pulmonary arteries. In this review we discuss cross sectional imaging modalities utilized for the imaging of the pulmonary arteries. Acquired pulmonary artery entities, including pulmonary artery sarcoma (PAS), vasculitis, aneurysm, and arteriovenous malformations, and congenital anomalies in adults, including proximal interruption of the pulmonary artery, pulmonary sling, pulmonary artery stenosis, and idiopathic dilatation of the pulmonary trunk, are also discussed. An awareness of these entities and their imaging findings is important for radiologists interpreting chest imaging.

Keywords: Computed tomography (CT); congenital anomalies; pulmonary arteriovenous malformation; pulmonary artery aneurysm; pulmonary artery sarcoma (PAS); pulmonary embolus (PE).


Conflict of interest statement

Conflicts of Interest: The authors have no conflicts of interest to declare.

Figures

Figure 1
Figure 1
Pulmonary infarct and Hampton’s hump. (A) Frontal chest radiograph demonstrating a wedge-shaped opacity in the left lower lung near the costophrenic sulcus (arrow), abutting the pleura (Hampton’s hump). (B) Coronal CT image on mediastinal windows demonstrates a filling defect in the left lower lobe pulmonary artery (arrow). (C) Coronal CT image on lung windows shows a wedge-shaped area of consolidation abutting the pleura (star) consistent with an infarct.
Figure 2
Figure 2
Acute pulmonary embolus on ventilation/perfusion scintigraphy. (A) Perfusion scan demonstrating bilateral moderate and large perfusion defects. (B) Ventilation scan demonstrating normal ventilation. Findings are consistent with high probability of PE. PE, pulmonary embolus.
Figure 3
Figure 3
CT findings of acute pulmonary embolus. (A) There is a central filling defect surrounded by contrast within a left upper lobe segmental pulmonary artery (arrow) (railway track sign). (B) There are central fillings defects surrounded by contrast (polo mint sign) in right middle lobe segmental arteries (arrows). (C) There is a filling defect in a left lower lobe subsegmental artery (arrow), which is distended compared to adjacent arteries. (D) There is an eccentric filling defect in the left main pulmonary artery (arrow) which forms an acute angle with the pulmonary arterial wall.
Figure 4
Figure 4
Dual-energy CT. (A) Axial blended CT image in which the attenuation of the main pulmonary artery measures 128 HU. (B) Corresponding axial virtual monochromatic CT image at 40 keV in which the attenuation of the main pulmonary artery measures 400 HU.
Figure 5
Figure 5
Dual-energy CT using reduced volume of iodinated contrast. (A) Axial virtual monochromatic CT image at 40 keV shows optimal opacification of the pulmonary arteries (main pulmonary artery measures 711 HU). (B) There is a filling defect in a right lower lobe segmental artery (arrow).
Figure 6
Figure 6
Pulmonary embolism on dual-energy CT. (A) Axial CT image on mediastinal windows demonstrates complete occlusion of segmental right middle lobe pulmonary arteries (arrows) and an eccentric filling defect in the right lower lobe pulmonary artery (arrowhead). (B) Pulmonary blood volume image demonstrates decreased perfusion of the right middle lobe (star) and right lower lobe (arrow) compared to the remainder of the lungs. (C) There is no corresponding abnormality of the lung parenchyma on lung windows.
Figure 7
Figure 7
Pulmonary embolism and infarct on dual-energy CT. (A) Coronal CT shows complete occlusion of a right lower lobe segmental artery (arrow). (B) Axial CT image on lung windows demonstrates a mixed-attenuation opacity in the right lower lobe (star). (C) Pulmonary blood volume image demonstrates decreased perfusion in the right lower lobe (star).
Figure 8
Figure 8
Saddle embolus and right heart strain. (A) Axial image depicts a saddle embolus. (B) Axial image through the heart shows a right ventricle/left ventricle ratio greater than 1, which is consistent with right heart strain.
Figure 9
Figure 9
CT findings of chronic pulmonary embolus. (A) There is a peripheral filling defect in a left lower lobe pulmonary artery which forms an obtuse angle with the pulmonary artery wall (arrow). (B) There is a web within a contrast filled right lower lobe pulmonary artery (arrow). (C) There is a peripheral filling defect in the right main pulmonary artery which is calcified (arrow).
Figure 10
Figure 10
CT features allowing differentiation of chronic pulmonary embolus from other obstructive disorders of the pulmonary artery.
Figure 11
Figure 11
Chronic pulmonary embolus on CTPA and MRA. (A) Axial contrast-enhanced CT demonstrates a web within a contrast filled right lower lobe segmental pulmonary artery (arrow). (B) Coronal contrast-enhanced MRA in the same patient depicts the web in a right lower lobe segmental pulmonary artery (arrow). CTPA, CT pulmonary angiography; MRA, MR angiography.
Figure 12
Figure 12
Pulmonary artery sarcoma. (A) Axial contrast-enhanced CT demonstrates a complete filling defect occluding the left main pulmonary artery (arrow) and a cavitary nodule in the left upper lobe (arrowhead). (B) Both the filling defect and the cavitary nodule demonstrate intense uptake on F18 FDG-PET. This was confirmed to be a pulmonary artery angiosarcoma on biopsy. The cavitary nodule represented a lung metastasis.
Figure 13
Figure 13
Takayasu arteritis. (A) Axial CT demonstrates thickening and narrowing of the right pulmonary artery (arrow). (B) Axial CT demonstrates thickening of the aorta and a focal aneurysm of the aortic arch (arrow).
Figure 14
Figure 14
Pulmonary artery pseudoaneurysm due to tumor. Axial CT demonstrates bilateral pulmonary nodules and masses. Within one of the masses in the right lower lobe there is a nodular area of enhancement consistent with a pseudoaneurysm (arrow).
Figure 15
Figure 15
Hughes-Stovin syndrome. (A) Axial CT demonstrates complete occlusion of the right main pulmonary artery (arrow). (B) Axial CT shows a fusiform aneurysm with peripheral thrombus in the left lower lobe pulmonary artery (arrow).
Figure 16
Figure 16
Iatrogenic pulmonary artery pseudoaneurysm. (A) Frontal chest radiograph demonstrates a Swan-Ganz catheter, the tip of which is inserted too far. There is an opacity adjacent to the tip (arrow). (B) Axial CT shows a pseudoaneurysm of a right middle lobe segmental artery (arrow). (C) The pseudoaneurysm was confirmed on conventional angiography. (D) This was successfully coiled.
Figure 17
Figure 17
Pulmonary arteriovenous malformation. (A) Frontal chest radiograph demonstrates a well-defined, lobulated nodule in the right lower lung (arrow). (B) Axial contrast-enhanced CT confirms a PAVM in the right lower lobe (arrow). (C) 3D reconstruction delineates the anatomy of the PAVM. PAVM, pulmonary arteriovenous malformations.
Figure 18
Figure 18
Pulmonary sling. (A) Lateral chest radiograph demonstrates a rounded opacity between the trachea and esophagus (arrow). (B) Axial CT shows the abnormal origin of the left pulmonary artery from the posterior aspect of the right pulmonary artery, which then passes between the trachea and the esophagus.

References

    1. Remy-Jardin M, Remy J, Wattinne L, et al. Central pulmonary thromboembolism: diagnosis with spiral volumetric CT with the single-breath-hold technique--comparison with pulmonary angiography. Radiology 1992;185:381-7. 10.1148/radiology.185.2.1410342 - DOI - PubMed
    1. Bae KT, Tao C, Gurel S, et al. Effect of patient weight and scanning duration on contrast enhancement during pulmonary multidetector CT angiography. Radiology 2007;242:582-9. 10.1148/radiol.2422052132 - DOI - PubMed
    1. Ramos-Duran LR, Kalafut JF, Hanley M, et al. Current contrast media delivery strategies for cardiac and pulmonary multidetector-row computed tomography angiography. J Thorac Imaging 2010;25:270-7. 10.1097/RTI.0b013e3181efe8b0 - DOI - PubMed
    1. Khadir MM, Chaturvedi A, Nguyen MS, et al. Looking beyond the thrombus: essentials of pulmonary artery imaging on CT. Insights Imaging 2014;5:493-506. 10.1007/s13244-014-0340-6 - DOI - PMC - PubMed
    1. Otrakji A, Digumarthy SR, Lo Gullo R, et al. Dual-Energy CT: Spectrum of Thoracic Abnormalities. Radiographics 2016;36:38-52. 10.1148/rg.2016150081 - DOI - PubMed