Review
. 2019 Sep;8(Suppl 3):S223-S232.
doi: 10.21037/gs.2019.06.02.

Magnetic resonance imaging of adrenal gland: state of the art

Affiliations
Review

Magnetic resonance imaging of adrenal gland: state of the art

Fabiano Vito d'Amuri et al. Gland Surg. 2019 Sep.

Abstract

Detection of adrenal lesions, because of the widespread use of imaging and especially high-resolution imaging procedures, is increased. Because of the importance to characterize those findings, magnetic resonance imaging (MRI), in particular chemical shift imaging (CSI), is useful to distinguish whether a lesion is benignant or malignant and to avoid further diagnostic or surgical procedures. It represents the first choice of imaging in patient like children or pregnant women, and a valid complement to other imaging techniques like CT or PET/CT. In this review we analyze the role and characteristic of MRI and the imaging features of most common benignant (adenoma, hyperplasia, pheochromocytoma, hemorrhage, cyst, myelolipoma, teratoma, ganglioneuroma, cystic lymphangioma, hemangioma) and malignant [neuroblastoma, adrenocortical carcinoma (ACC), metastases, lymphoma] adrenal lesions.

Keywords: Imaging; adrenal glands; magnetic resonance imaging (MRI).


Conflict of interest statement

Conflicts of Interest: The authors have no conflicts of interest to declare.

Figures

Figure 1
Figure 1
Right adrenal gland lipid-poor adenoma (arrows) in a 51-year-old woman with recent diagnosis of lung cancer. Axial TSE T2-w fat-sat images (A) demonstrate a moderate hyperintense lesion with some areas of signal hypointensity (arrowhead), consistent with the diagnosis of lipid poor adenoma containing a small macroscopic fat component. In agreement with this diagnosis, in-phase (B) and out-of-phase (C) sequences do not demonstrate significant signal loss. Arterial (D) post-contrast phase demonstrates mild dishomogeneous early enhancement with relative wash-out on venous (E) and late venous (F) phases.
Figure 2
Figure 2
Left adrenal gland macronodular hyperplasia (arrows) in a 46-year-old woman. The lesion appears hypointense on both TSE T2-w sequence (A) and in-phase sequence (B), with a significant signal loss on the out-of-phase sequence (C), coherent with the presence of intracellular fat.
Figure 3
Figure 3
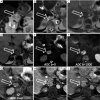
Right adrenal gland pheochromocytoma in a 90-year-old woman. The MRI shows a 32×21 mm solid tissue (arrows), with an irregular shape, directly in contact with the inferior vena cava and the right diaphragmatic crus. The lesion appears hyperintense on coronal (A) and axial (B) plane TSE T2-w sequences, with no significant signal loss between in-phase (C) and out-of-phase (D) sequences. DWI sequences (E,F) and ADC map (G) show restricted diffusion on b=1,000 and ADC map images. After contrast medium injection inhomogeneous enhancement is visible both on arterial (H) and venous (I) phases. DWI, diffusion weighted imaging; ADC, apparent diffusion coefficient.
Figure 4
Figure 4
A 70-year-old man with uncontrolled hypertension despite medical therapy with left adrenal gland pheochromocytoma confirmed by circulating catecholamines dosage. The lesion (arrows) presents moderate signal intensity on axial TSE T2-w images (A) and hypointense on in-phase T1 sequence (B) without significant loss of signal in out-of-phase sequence (C) since pheochromocytoma does not contain significant amount of intracellular lipid. The DWI sequences (D,E) in b=1,000 images and the ADC map (F) show significant restricted diffusion. Arterial (G) and venous phase (H) demonstrate inhomogeneous enhancement of the lesion with central area of necrosis after Gadolinium administration. DWI, diffusion weighted imaging.
Figure 5
Figure 5
A newborn boy with a right adrenal neuroblastoma incidentally found during an abdominal sonography for persistent oesophageal reflux. The mass (arrows) appears as an inhomogeneous lesion with moderate signal intensity in axial TSE T2-w image (A) and hypointense in T1-w (B), with mild contrast enhancement in arterial phase (C). On DWI sequences (D,E) and ADC map (F), the lesion shows very significant restricted diffusion on b=1,000 images. DWI, diffusion weighted imaging; ADC, apparent diffusion coefficient.
Figure 6
Figure 6
A 70-year-old man with left adrenal metastasis from colon cancer. The lesion (arrows) shows signal hypointensity on the axial TSE T2-w (A) sequence without significant signal difference between the in-phase (B) and out-of-phase (C) sequences. Restricted diffusion is evident on b=1,000 DWI (D,E) sequences and ADC map (F). DWI, diffusion weighted imaging; ADC, apparent diffusion coefficient.
Figure 7
Figure 7
Right adrenal gland metastases in an 81-year-old woman with history of left papillary renal cell carcinoma. The lesion (arrows) shows mild signal intensity on TSE T2w images (A), in-phase (B) and out-of-phase (C) sequences. The lesion enhances significantly after contrast medium injection (D), without significant wash-out in venous phase (E).
Figure 8
Figure 8
A 32-year-old woman with left adrenal cortex carcinoma (arrows). TSE T2-w sequences on the coronal (A) and axial (B) plane demonstrates an oval shaped lesion with moderate signal intensity of the left adrenal gland. DWI sequences (C,D) show significant restricted diffusion on b=1,000 images. On arterial (E) and venous (F) phases the mass shows inhomogeneous peripheral enhancement, related to the presence of central foci of necrotic tissue. DWI, diffusion weighted imaging.

References

    1. Elsayes KM, Mukundan G, Narra VR, et al. Adrenal masses: MR imaging features with pathologic correlation. RadioGraphics 2004;24:S73-86. 10.1148/rg.24si045514 - DOI - PubMed
    1. Adam SZ, Nikolaidis P, Horowitz JM, et al. Chemical Shift MR Imaging of the Adrenal Gland: Principles, Pitfalls, and Applications. RadioGraphics 2016;36:414-32. 10.1148/rg.2016150139 - DOI - PubMed
    1. Hood MN, Ho VB, Smirniotopoulos JG, et al. Chemical shift: the artifact and clinical tool revisited. RadioGraphics 1999;19:357-71. 10.1148/radiographics.19.2.g99mr07357 - DOI - PubMed
    1. Tsushima Y, Takahashi-Taketomi A, Endo K. Diagnostic utility of diffusion-weighted MR imaging and apparent diffusion coefficient value for the diagnosis of adrenal tumors. J Magn Reson Imaging 2009;29:112-7. 10.1002/jmri.21616 - DOI - PubMed
    1. Sandrasegaran K, Patel AA, Ramaswamy R, et al. Characterization of adrenal masses with diffusion-weighted imaging. AJR Am J Roentgenol 2011;197:132-8. 10.2214/AJR.10.4583 - DOI - PubMed