. 2020 Jan;60(1):90-100.
doi: 10.1111/head.13651. Epub 2019 Sep 26.

Migraine Genetic Variants Influence Cerebral Blood Flow

Affiliations

Migraine Genetic Variants Influence Cerebral Blood Flow

Maria J Knol et al. Headache. 2020 Jan.

Abstract

Objective: To investigate the association of migraine genetic variants with cerebral blood flow (CBF).

Background: Migraine is a common disorder with many genetic and non-genetic factors affecting its occurrence. The exact pathophysiological mechanisms underlying the disease remain unclear, but are known to involve hemodynamic and vascular disruptions. Recent genome-wide association studies have identified 44 genetic variants in 38 genetic loci that affect the risk of migraine, which provide the opportunity to further disentangle these mechanisms.

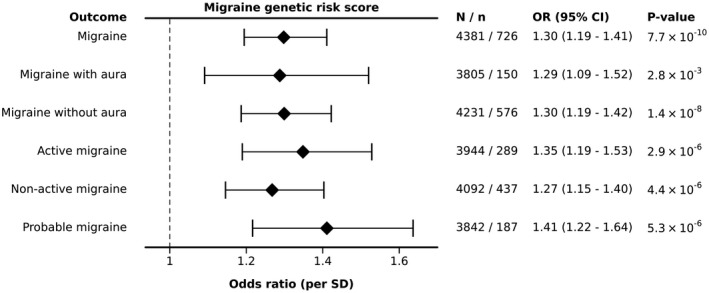
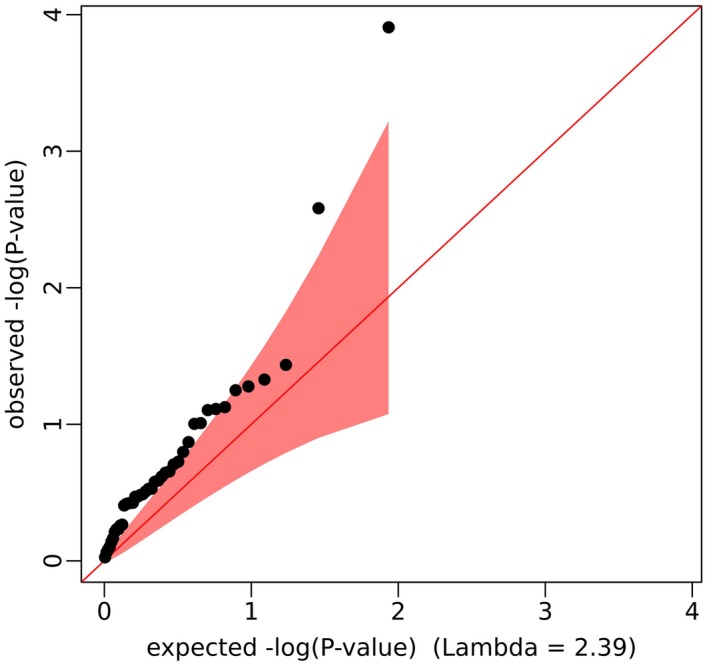
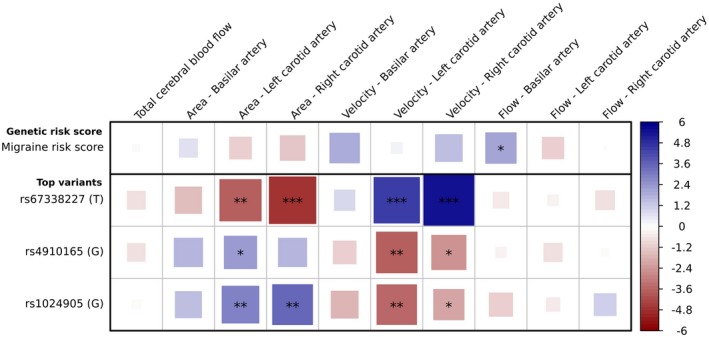
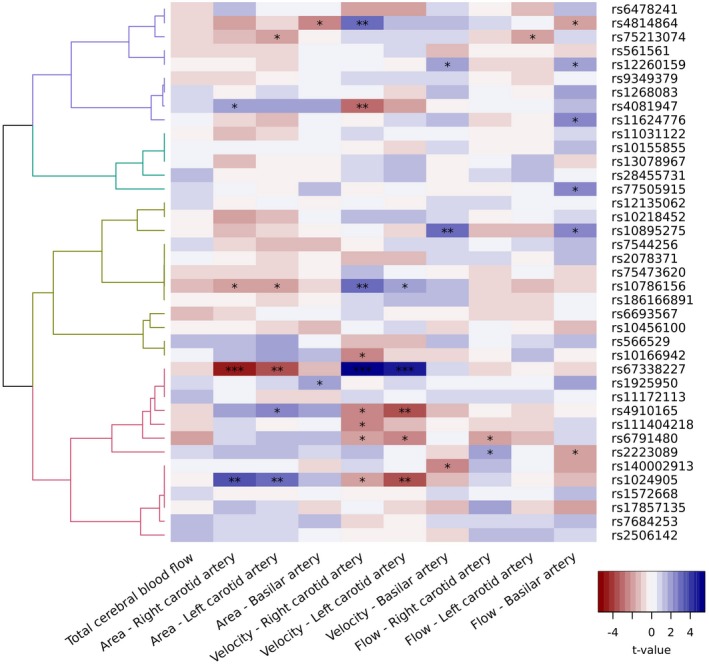
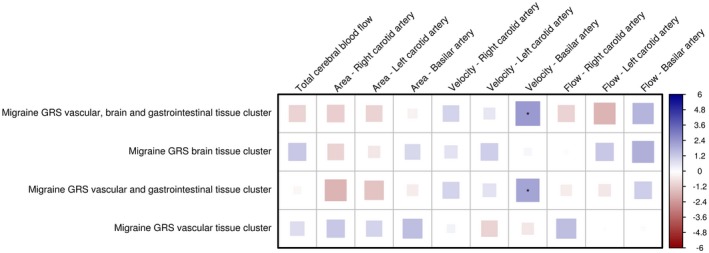
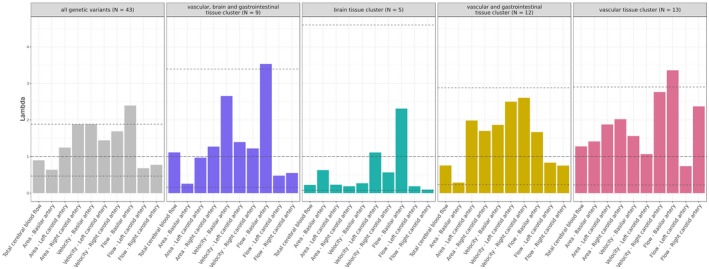
Methods: We included 4665 participants of the population-based Rotterdam Study (mean age 65.0 ± 10.9 years, 55.6% women). Cross-sectional area (mm2 ), flow velocity (mm/s), and blood flow (mL/min) were measured in both carotids and the basilar artery using 2-dimensional phase-contrast magnetic resonance imaging. We analyzed 43 previously identified migraine variants separately and calculated a genetic risk score (GRS). To assess the association with CBF, we used linear regression models adjusted for age, sex, and total brain volume. Hierarchical clustering was performed based on the associations with CBF measures and tissue enrichment.

Results: The rs67338227 risk allele was associated with higher flow velocity and smaller cross-sectional area in the carotids (Pminimum = 3.7 × 10⁻⁸ ). Other variants were related to CBF with opposite directions of effect, but not significantly after multiple testing adjustments (P < 1.4 × 10⁻⁴ ). The migraine GRS was not associated with CBF after multiple testing corrections. Migraine risk variants were found to be enriched for flow in the basilar artery (λ = 2.39).

Conclusions: These findings show that genetic migraine risk is complexly associated with alterations in cerebral hemodynamics.

Keywords: brain imaging; cerebrovascular circulation; genetics; migraine disorders; perfusion imaging; regional blood flow.


Figures

Figure 1
Figure 1
Associations between the migraine GRS and migraine diagnoses. Forest plot showing association results between the migraine GRS and different migraine subtypes. Confidence interval (CI); sample size (N);  number of cases (n); odds ratio (OR); standard deviation (SD).
Figure 2
Figure 2
Quantile‐quantile plot of the migraine genetic variants and prevalence of migraine.
Figure 3
Figure 3
Associations between genetic risk variants for migraine and CBF. Plot showing association results between the migraine GRS and the 3 top genetic variants. Colors and sizes of the blocks correspond to t values, with blue and red indicating positive and negative associations, respectively. Larger blocks indicate stronger associations, and significance levels are noted by asterisks: * for P value <.05, ** for P value <.05/8.2 = 6.1 × 10−3, and *** for P value <.05/(43 × 8.2) = 1.4 × 10−4.
Figure 4
Figure 4
Associations between genetic risk variants for migraine and CBF, hierarchically clustered based on the enrichment of their associated genes in brain, vascular, and gastrointestinal tissues. Plot showing association results between 39 autosomal migraine genetic risk variants and measures of CBF, including a dendrogram based on the tissue enrichment in brain, vascular, and gastrointestinal tissues of their associated genes. The genetic variants in each cluster are linked to genes that are differentially enriched in tissues: vascular, brain, and gastrointestinal tissues (purple branches); brain tissue (green branches); vascular and gastrointestinal tissues (yellow branches); vascular tissue (pink branches). Colors and sizes of the blocks correspond to t values, with blue and red indicating positive and negative associations, respectively. Significance levels are noted by asterisks: * for P value <.05, ** for P value <.05/8.2 = 6.1 × 10−3, and *** for P value <.05/(43 × 8.2) = 1.4 × 10−4.
Figure 5
Figure 5
Associations between 4 migraine GRS, containing genetic variants based on tissue enrichment patterns, and CBF. Plot showing association results between migraine GRS and measures of CBF. Clusters of 39 genome‐wide significant genetic variants for migraine were created based on the tissue enrichment in brain, vascular, and gastrointestinal tissues of their associated genes, as presented in Figure 4. Weighted GRS of the genetic variants in each cluster were calculated to estimate the combined effect of the variants in each cluster. Colors and sizes of the blocks correspond to t values, with blue and red indicating positive and negative associations, respectively. Larger blocks indicate stronger associations, and significance levels are noted by asterisks: * for P value <.05, ** for P value <.05/8.2 = 6.1 × 10−3. Genetic risk score (GRS).
Figure 6
Figure 6
Enrichment of the migraine genetic variants for measures of CBF, overall and stratified by tissue enrichment cluster. Plot showing enrichment results of migraine genetic risk variants for measures of CBF. The overall λ for all 43 genetic variants is represented, as well as for clusters of variants linked to genes that are differentially enriched in tissues: vascular, brain, and gastrointestinal tissues (cluster 1, purple bars, N = 9); brain tissue (cluster 2, green bars, N = 5); vascular and gastrointestinal tissues (cluster 3, yellow bars, N = 12); vascular tissue (cluster 4, red bars, N = 13), as shown in Figure 4. Confidence intervals around the null, ie, λ = 1 (long‐dashed gray lines), are shown in gray dashed lines.

References

    1. Global Burden of Disease Study C . Global, regional, and national incidence, prevalence, and years lived with disability for 301 acute and chronic diseases and injuries in 188 countries, 1990‐2013: A systematic analysis for the Global Burden of Disease Study 2013. Lancet. 2015;386:743‐800. - PMC - PubMed
    1. Gormley P, Anttila V, Winsvold BS, et al. Meta‐analysis of 375,000 individuals identifies 38 susceptibility loci for migraine. Nat Genet. 2016;48:856‐866. - PMC - PubMed
    1. Pietrobon D, Striessnig J. Neurobiology of migraine. Nat Rev Neurosci. 2003;4:386‐398. - PubMed
    1. Parsons AA, Strijbos PJ. The neuronal versus vascular hypothesis of migraine and cortical spreading depression. Curr Opin Pharmacol. 2003;3:73‐77. - PubMed
    1. Loehrer E, Vernooij MW, van der Lugt A, Hofman A, Ikram MA. Migraine and cerebral blood flow in the general population. Cephalalgia. 2015;35:190‐198. - PubMed

MeSH terms