

Age-based differences in the disability of extremity injuries in pediatric and adult occupants
- PMID: 31560215
- PMCID: PMC7035195
- DOI: 10.1080/15389588.2019.1658873
Age-based differences in the disability of extremity injuries in pediatric and adult occupants
Abstract
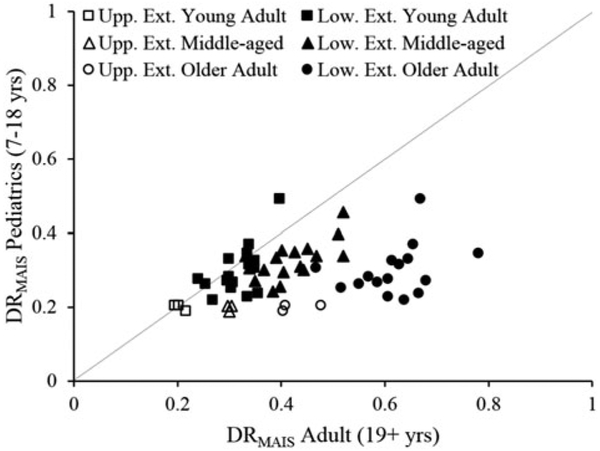
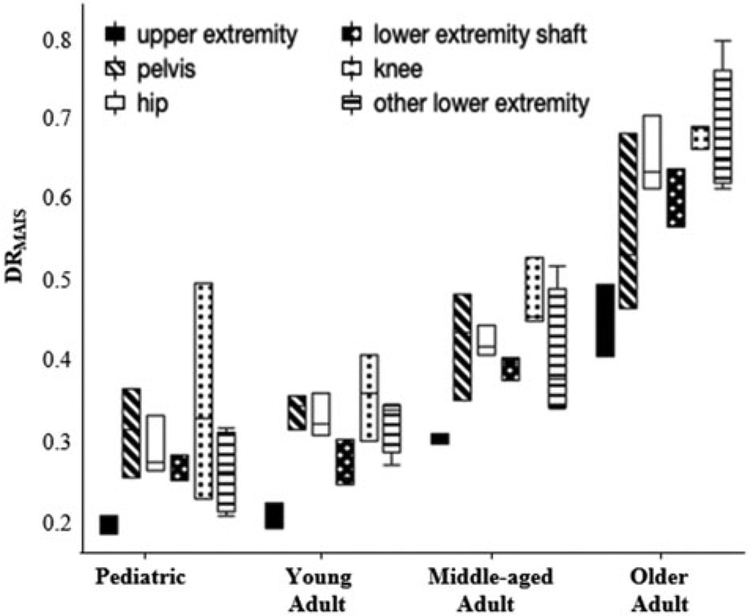
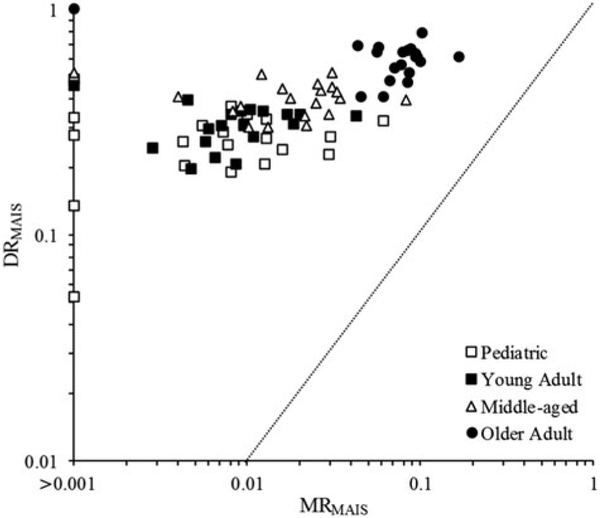
Objective: The objective was to develop a disability-based metric for motor vehicle crash (MVC) upper and lower extremity injuries and compare functional outcomes between children and adults.Methods: Disability risk (DR) was quantified using Functional Independence Measure (FIM) scores within the National Trauma Data Bank-Research Data System for the top 95% most frequently occurring Abbreviated Injury Scale (AIS) 3 extremity injuries (22 unique injuries). Pediatric (7-18 years), young adult (19-45 years), middle-aged (46-65 years), and older adult (66+ years) MVC occupants with an FIM score and at least one of the 22 extremity injuries were included. DR was calculated for each injury as the proportion of occupants who were disabled of those sustaining the injury. A maximum AIS-adjusted disability risk (DRMAIS) was also calculated for each injury, excluding occupants with AIS 4+ co-injuries.Results: Locomotion impairment was the most frequent disability type across all ages. DR and DRMAIS of the extremity injuries ranged from 0.06 to 1.00 (6%-100% disability risk). Disability risk increased with age, with DRMAIS increasing from 25.9% ± 8.6% (mean ± SD) in pediatric subjects to 30.4% ± 6.3% in young adults, 39.5% ± 6.6% in middle-aged adults, and 60.5 ± 13.3% in older adults. DRMAIS for upper extremity fractures differed significantly between age groups, with higher disability in older adults, followed by middle-aged adults. DRMAIS for pelvis, hip, shaft, knee, and other lower extremity fractures differed significantly between age groups, with older adult DRMAIS being significantly higher for each fracture type. DRMAIS for hip and lower extremity shaft fractures was also significantly higher in middle-aged occupants compared to pediatric and young adult occupants. The maximum AIS-adjusted mortality risk (MRMAIS, proportion of fatalities among occupants sustaining an MAIS 3 injury) was not correlated with DRMAIS for extremity injuries in pediatric, young adult, middle-aged, and older adult occupants (all R2 < 0.01). Disability associated with each extremity injury was higher than mortality risk.Conclusions: Older adults had significantly greater disability for MVC extremity injuries. Lower disability rates in children may stem from their increased physiological capacity for bone healing and relative lack of bone disease. The disability metrics developed can supplement AIS and other severity-based metrics by accounting for the age-specific functional implications of MVC extremity injuries.
Keywords: Upper extremity; children; disability; fracture; lower extremity; older adults.
Figures
Similar articles
-
Functional outcomes of motor vehicle crash head injuries in pediatric and adult occupants.Traffic Inj Prev. 2016 Sep;17 Suppl 1(Suppl 1):27-33. doi: 10.1080/15389588.2016.1201203. Traffic Inj Prev. 2016. PMID: 27586099 Free PMC article.
-
Functional outcomes of motor vehicle crash thoracic injuries in pediatric and adult occupants.Traffic Inj Prev. 2018 Apr 3;19(3):280-286. doi: 10.1080/15389588.2017.1409894. Epub 2018 Mar 7. Traffic Inj Prev. 2018. PMID: 29185785 Free PMC article.
-
Functional outcomes of thoracic injuries in pediatric and adult occupants.Traffic Inj Prev. 2018 Feb 28;19(sup1):S195-S198. doi: 10.1080/15389588.2018.1426927. Traffic Inj Prev. 2018. PMID: 29584488 Free PMC article.
-
Increased morbidity and mortality in elderly patients with lower extremity trauma and associated injuries: A review of 420,066 patients from the national trauma database.Injury. 2021 Apr;52(4):757-766. doi: 10.1016/j.injury.2020.10.037. Epub 2020 Oct 8. Injury. 2021. PMID: 33069394 Review.
-
A Review of Pediatric Lower Extremity Data for Pedestrian Numerical Modeling: Injury Epidemiology, Anatomy, Anthropometry, Structural, and Mechanical Properties.Appl Bionics Biomech. 2018 Sep 4;2018:6271898. doi: 10.1155/2018/6271898. eCollection 2018. Appl Bionics Biomech. 2018. PMID: 30254693 Free PMC article. Review.
Cited by
-
Mortality of trauma patients treated at trauma centers compared to non-trauma centers in Sweden: a retrospective study.Eur J Trauma Emerg Surg. 2022 Feb;48(1):525-536. doi: 10.1007/s00068-020-01446-6. Epub 2020 Jul 27. Eur J Trauma Emerg Surg. 2022. PMID: 32719897 Free PMC article. Review.
-
Feasibility of anterior pelvic ring fixation alone for treating lateral compression type 1 pelvic fractures with nondisplaced complete sacral fractures: a retrospective study.PeerJ. 2020 Mar 16;8:e8743. doi: 10.7717/peerj.8743. eCollection 2020. PeerJ. 2020. PMID: 32211233 Free PMC article.
-
Are There Any Differences in Road Traffic Injury Outcomes between Older and Younger Adults? Setting the Grounds for Posttraumatic Senior Personal Injury Assessment Guidelines.J Clin Med. 2023 Mar 17;12(6):2353. doi: 10.3390/jcm12062353. J Clin Med. 2023. PMID: 36983355 Free PMC article.
-
Injuries to the lower limbs and associated injuries in children and adolescents resulting from road traffic incidents.J Family Med Prim Care. 2024 Nov;13(11):4994-5001. doi: 10.4103/jfmpc.jfmpc_486_24. Epub 2024 Nov 18. J Family Med Prim Care. 2024. PMID: 39723007 Free PMC article.
-
Age-Specific Differences in Laryngotracheal Trauma Characteristics: A Retrospective Study of Clinical Profiles, Outcomes, and Mortality Risk.J Clin Med. 2024 Jun 15;13(12):3508. doi: 10.3390/jcm13123508. J Clin Med. 2024. PMID: 38930037 Free PMC article.
References
-
- Barnard RT, Loftis KL, Martin RS, Stitzel JD. 2013. Development of a robust mapping between AIS 2+ and ICD-9 injury codes. Accid Anal Prev. 52:133–143. - PubMed
-
- Doud AN, Schoell SL, Weaver AA, Talton JW, Barnard RT, Petty JK, Stitzel JD. 2017. Disability risk in pediatric motor vehicle crash occupants. J Trauma Acute Care Surg. 82(5):933–938. May - PubMed
-
- Doud AN, Weaver AA, Talton JW, Barnard RT, Schoell SL, Petty JK, Stitzel JD. 2015. Mortality risk in pediatric motor vehicle crash occupants: accounting for developmental stage and challenging abbreviated injury scale metrics. Traffic Inj Prev. 16(Sup2): S201–S208. - PubMed
-
- Herron J, Hutchinson R, Lecky F, Bouamra O, Edwards A, Woodford M, Eardley WGP. 2017. The impact of age on major orthopaedic trauma: an analysis of the United Kingdom Trauma Audit Research Network database. Bone Joint J. 99-B(12): 1677–1680. December - PubMed
Publication types
MeSH terms
Grants and funding
LinkOut - more resources
Full Text Sources
Other Literature Sources
Medical