. 2020 May;30(3):446-464.
doi: 10.1111/bpa.12787. Epub 2019 Oct 10.

Astrocyte-microglial association and matrix composition are common events in the natural history of primary familial brain calcification

Affiliations

Astrocyte-microglial association and matrix composition are common events in the natural history of primary familial brain calcification

Khayrun Nahar et al. Brain Pathol. 2020 May.

Abstract

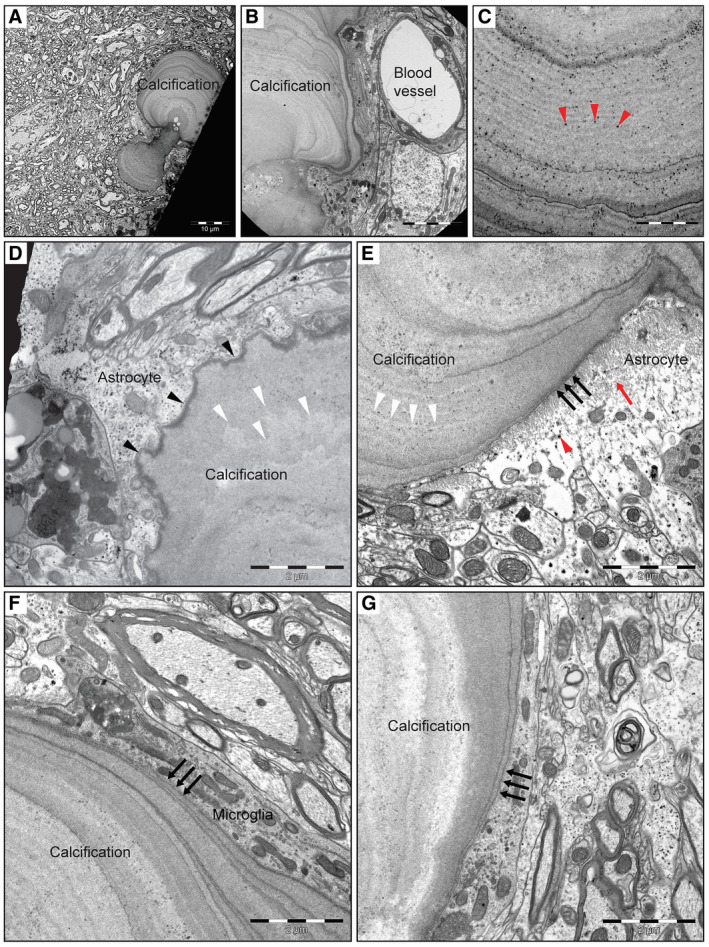
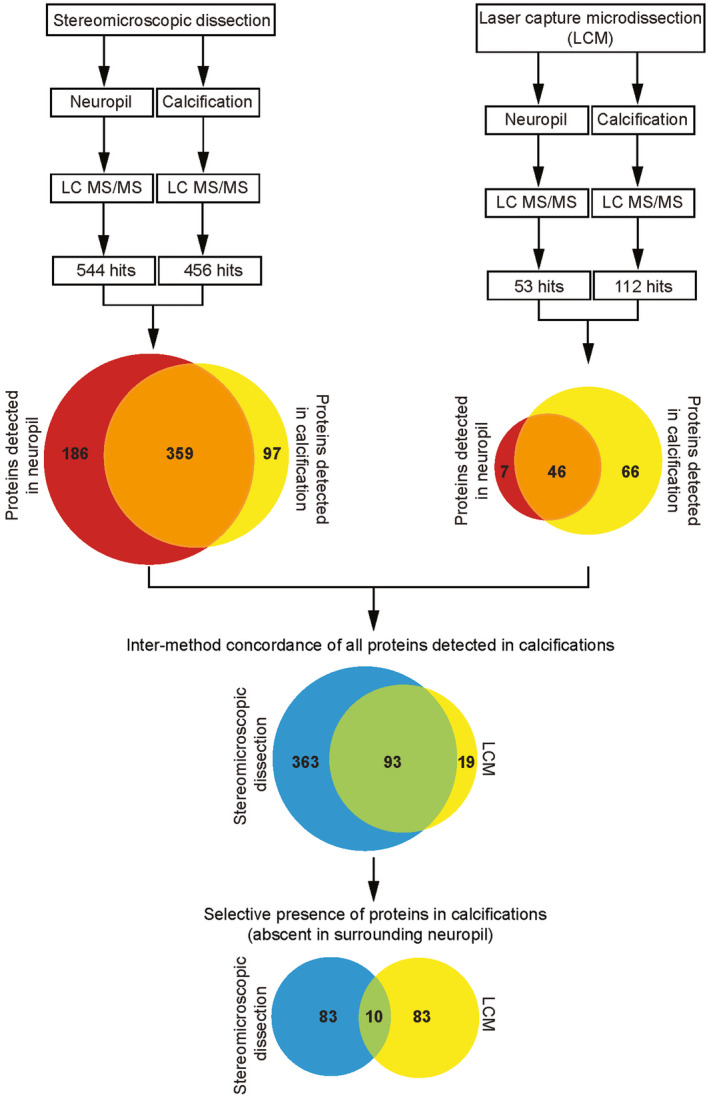
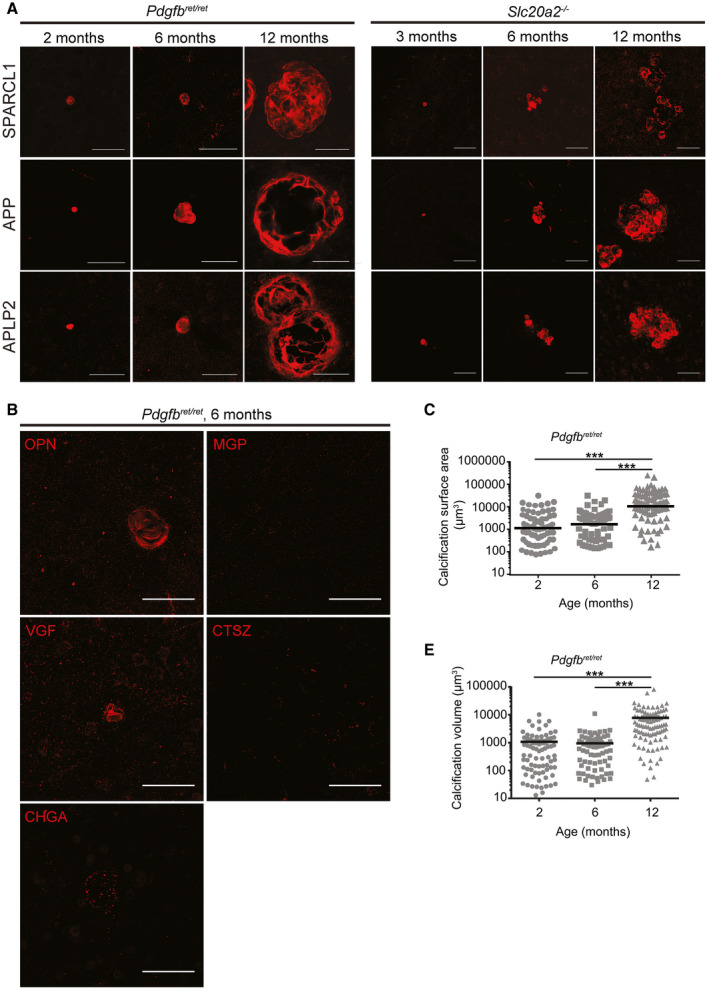
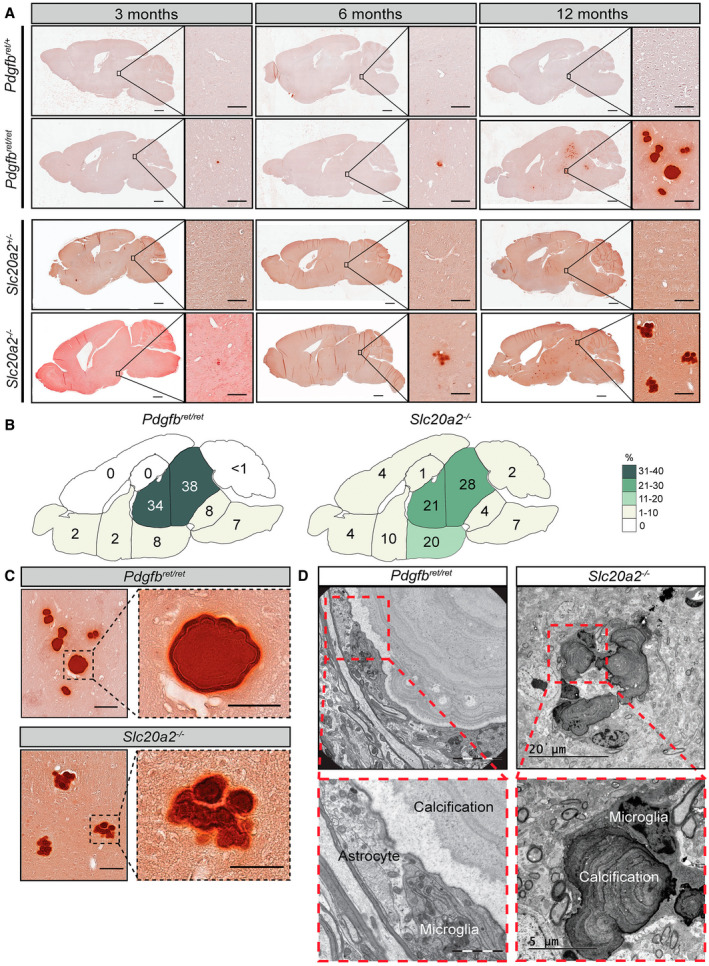
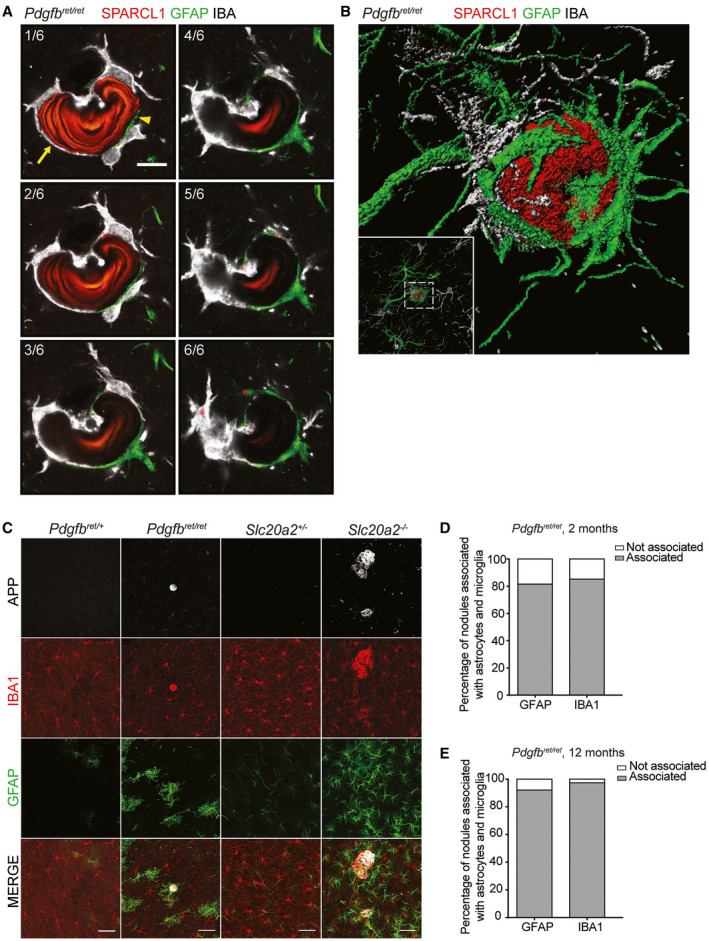
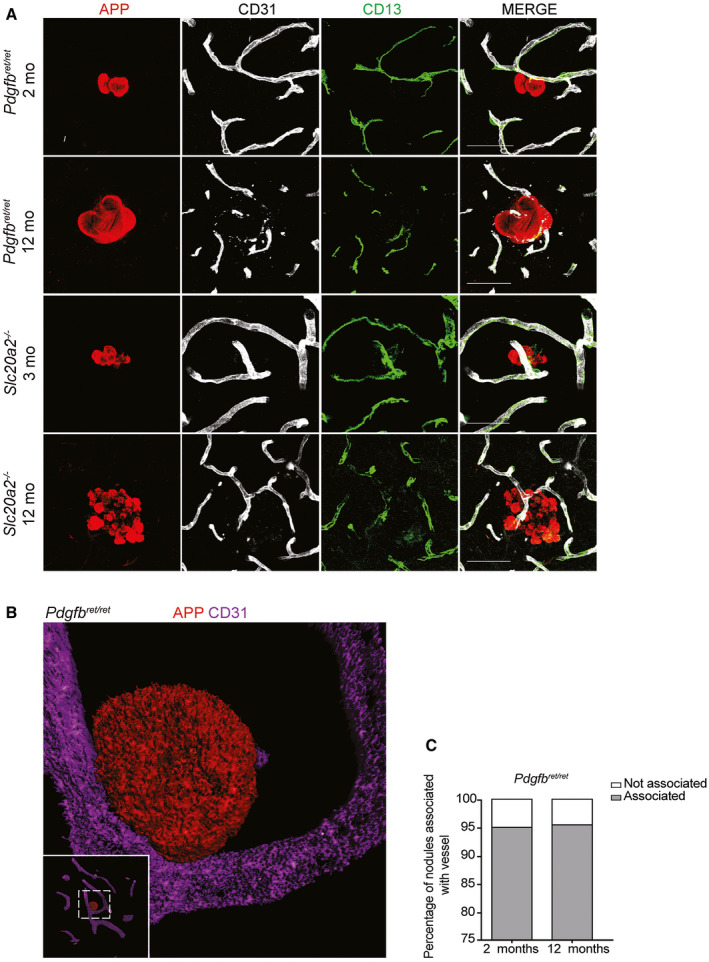
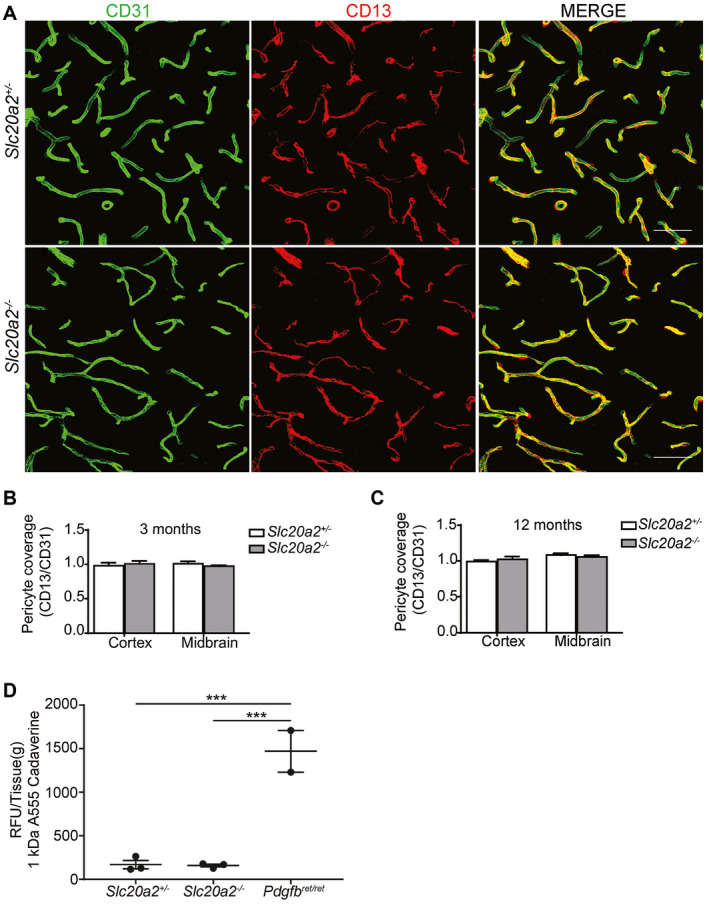
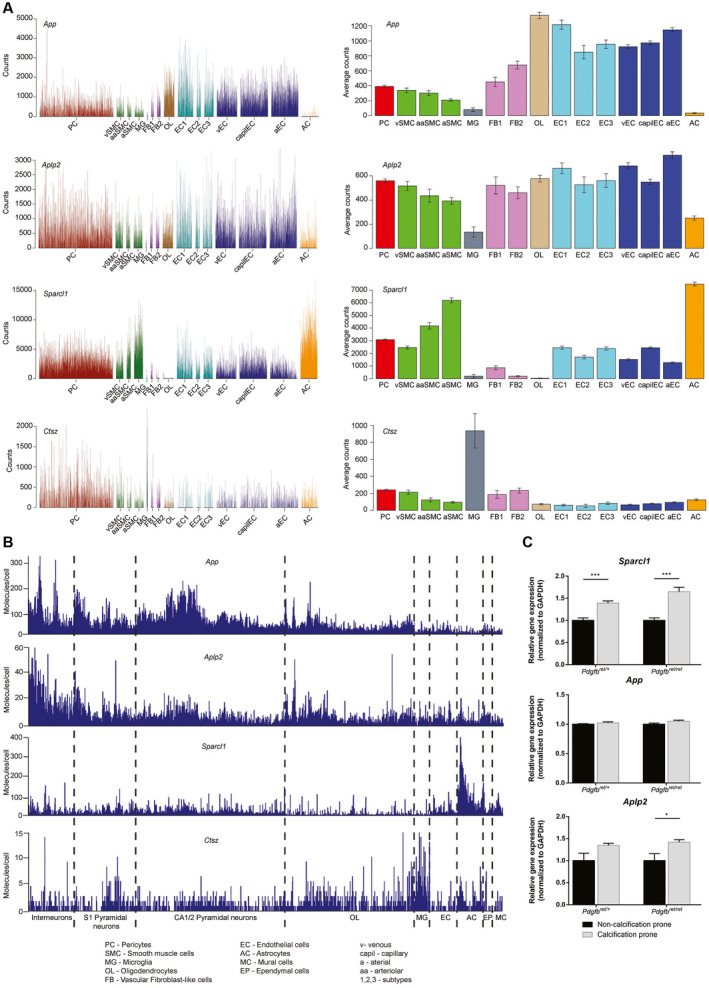
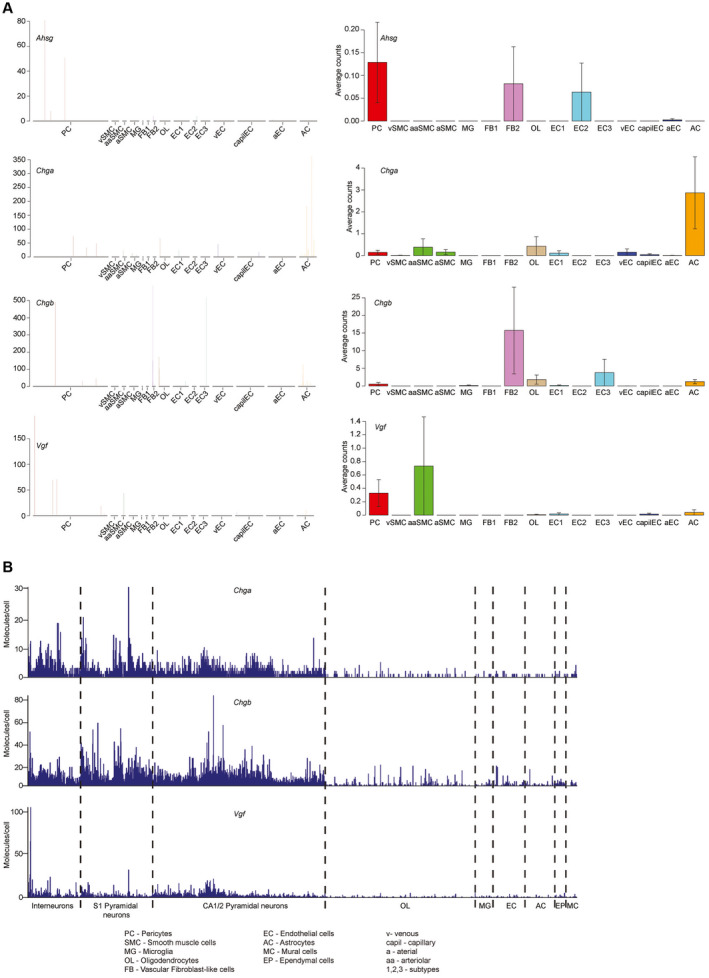
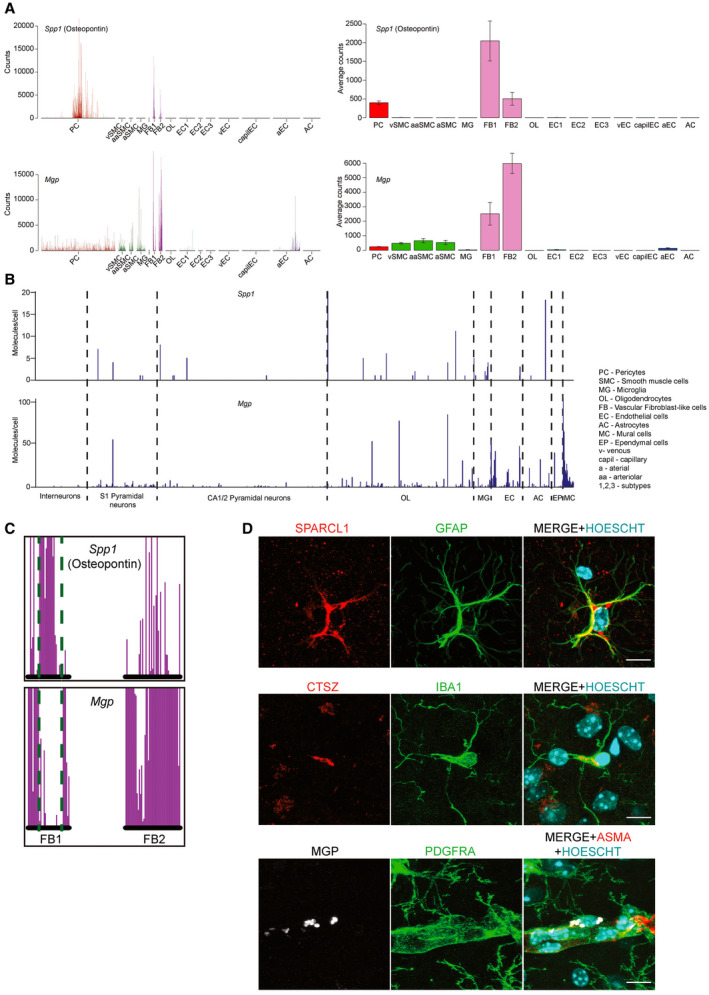
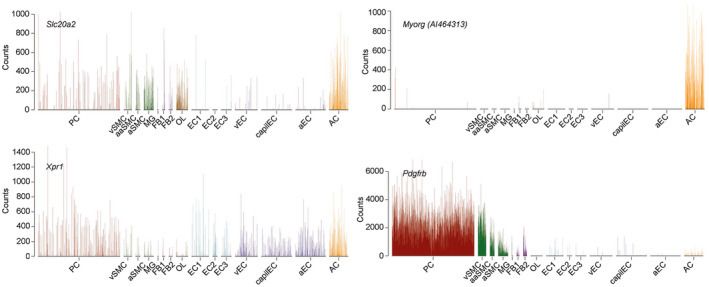
Primary familial brain calcification (PFBC) is an age-dependent and rare neurodegenerative disorder characterized by microvascular calcium phosphate deposits in the deep brain regions. Known genetic causes of PFBC include loss-of-function mutations in genes involved in either of three processes-platelet-derived growth factor (PDGF) signaling, phosphate homeostasis or protein glycosylation-with unclear molecular links. To provide insight into the pathogenesis of PFBC, we analyzed murine models of PFBC for the first two of these processes in Pdgfbret/ret and Slc20a2-/- mice with regard to the structure, molecular composition, development and distribution of perivascular calcified nodules. Analyses by transmission electron microscopy and immunofluorescence revealed that calcified nodules in both of these models have a multilayered ultrastructure and occur in direct contact with reactive astrocytes and microglia. However, whereas nodules in Pdgfbret/ret mice were large, solitary and smooth surfaced, the nodules in Slc20a2-/- mice were multi-lobulated and occurred in clusters. The regional distribution of nodules also differed between the two models. Proteomic analysis and immunofluorescence stainings revealed a common molecular composition of the nodules in the two models, involving proteins implicated in bone homeostasis, but also proteins not previously linked to tissue mineralization. While the brain vasculature of Pdgfbret/ret mice has been reported to display reduced pericyte coverage and abnormal permeability, we found that Slc20a2-/- mice have a normal pericyte coverage and no overtly increased permeability. Thus, lack of pericytes and increase in permeability of the blood-brain barrier are likely not the causal triggers for PFBC pathogenesis. Instead, gene expression and spatial correlations suggest that astrocytes are intimately linked to the calcification process in PFBC.

Keywords: PDGFB retention motive knockout; PFBC; Slc20a2 knockout; brain calcification; mass spectrometry.


Conflict of interest statement

Michael Vanlandewijck and Christer Betsholtz are employed at the Integrated Cardio Metabolic Centre (KI), which is funded by AstraZeneca Ab. Christer Betsholtz is an advisor for AstraZeneca Ab. These affiliations do not pose any direct or indirect conflict of interest to the work described in this paper. All other authors declare no conflict of interest.

Figures

Figure 1
Figure 1
TEM analysis of Pdgfbret/ret mouse deep brain regions reveals nodules with layered structure and cellular association. A. Representative image of a calcification with two nodules with both a “rugged” and smooth surface area found in the deep brain region of a 5‐month‐old mouse. B. Magnified view of a multilayered calcification with varying electron density in close vicinity to a blood vessel. Red arrowheads in (C) show the presence of calcium phosphate crystals in the nodule. D. An illustration of a nodule with a “rugged” surface area (black arrowheads) in close proximity to an astrocyte. The surface structure (black arrowheads) correlates with the deeper layering (white arrowheads in D and E). E. Representative image of the immediate association of a smooth‐surfaced (black arrows) calcified nodule with an astrocyte. Red arrowhead indicate electron dense glycogen granules and red arrow indicates cytoplasmic intermediate filaments. (F, G) Microglia in direct contact with a nodule with smooth surface area (black arrows).
Figure 2
Figure 2
Flow chart for proteomics analysis. Schematic overview of the isolation of lesions from fresh brain tissue of Pdgfbret/ret mice using fluorescent stereomicroscope microdissection (left side) (n = 1), and from paraffin embedded tissue with laser capture microdissection (LCM), right side (n = 3). The number of detected proteins in neuropil and calcifications is depicted in the upper Venn diagrams (red and yellow respectively). The lower Venn diagram illustrates the high overlap of proteins that were detected in calcifications using both techniques. Of these 93 proteins, 10 were found to be exclusively present in calcifications.
Figure 3
Figure 3
Calcifications in Pdgfbret/ret and Slc20a2−/− mice grow in size and number with age and are composed of both pro‐ and anti‐osteogenic proteins. Representative images of immunohistochemical verification of the proteomic analysis in Pdgfbret/ret and Slc20a2 −/− using antibodies targeting SPARCL1, APP and APLP2 (A). B. Weak (OPN, CHGA, VGF) or negative (CTSZ and MGP) immunostaining in Pdgfbret/ret with antibodies targeting enriched proteins in calcifications with proteomics. Scale bars, 50 µm. C. Measurements of the calcification surface area and volume (D) in 2‐ (n = 4), 6‐ (n = 3) and 12‐month‐old (n = 3) Pdgfbret/ret mice. A one‐way ANOVA with Bonferroni correction for multiple comparisons demonstrates statistically significant difference between 6 and 12 months analyzed mice (***P < 0.001).
Figure 4
Figure 4
Nodules found in Pdgfbret/ret and Slc20a2−/− mice differ in anatomical location and morphology. A. Representative images of Alizarin red stainings performed on sections from 3‐, 6‐ and 12‐month‐old Pdgfbret/ret and Slc20a2 −/− demonstrate the increase in both size and number of the nodules in both models. Calcifications were absent in Pdgfbret/+ and Slc20a2 +/− controls. Scale bars, 1000 µm in overview pictures and 100 µm in higher magnification. B. Distribution of nodules in different brain regions in 3‐, 6‐ and 12‐ ‐month‐old Pdgfbret/ret (n = 9) and Slc20a2 −/− (n = 6). The numbers are displayed as the percentage of nodules found in each area compared to the total number of nodules found for all time points. C. High magnification views from 12‐month‐old Pdgfbret/ret and Slc20a2 −/− showing the difference in morphology. Scale bars, 100 µm in overview pictures and 50 µm in higher magnification. D. Representative images of the close association between astrocytes and microglia to calcified nodules detected in a 5‐month‐old Pdgfbret/ret (n = 1) and 6‐month‐old Slc20a2 −/− mice visualized with EM (n = 2).
Figure 5
Figure 5
Astrocyte and microglia processes encompass most of the nodule circumference. A. Representative confocal images of six optical stacks showing co‐immunolabeling for SPARCL1, GFAP and IBA1. Arrow indicates the surface area of the nodule in contact with IBA‐positive microglia and arrowheads indicate the surface area of the nodule in direct contact with GFAP‐positive reactive astrocyte processes. Scale bar, 10 µm. B. Volumetric 3D rendering of a nodule stained with APP (red) associated with a GFAP‐positive astrocyte (green) and IBA1‐positive microglia (white). C. Co‐immunolabeling with APP, IBA1 and GFAP confirming the association of nodules with astrocytes and microglia in both Pdgfbret/ret and Slc20a2 −/− mice. Scale bars, 50 µm. D, E. Percentage of calcifications associated with astrocytes and microglia in deeper brain regions in (D) 2‐ (n = 4) and (E) 12‐month‐old (n = 3) Pdgfbret/ret mice.
Figure 6
Figure 6
Nodules in Pdgfbret/ret and Slc20a2−/− are confirmed to be vessel associated. A. Small vessel association of calcifications in Pdgfbret/ret and Slc20a2 −/− mice verified by co‐immunolabeling with APP, CD13 and CD31 on vibratome sections. Scale bars, 50 µm. B. Volumetric 3D rendering of a calcification in Pdgfbret/ret (red) attached to a CD31‐positive vessel (purple). C. Percentage of calcifications associated with vessels in deeper brain regions in 2‐ (n = 4) and 12‐month‐old (n = 3) Pdgfbret/ret mice.
Figure 7
Figure 7
Assessment of pericyte coverage and blood–brain barrier integrity in Slc20a2−/− . A. Representative images from hypothalamus of 3‐month‐old Slc20a2 +/− and Slc20a2 −/− mice. Co‐immunolabeling with CD31 and CD13 was performed on 50 µm thick sagittal vibratome sections. Scale bars, 50 µm. B, C. The capillary surface coverage ratio in 3‐ and 12‐month‐old Slc20a2 +/− mice compared to Slc20a2 −/− (n = 4). Two‐tailed Student’s t‐test demonstrates no statistically significant difference between the different genotypes or different regions within the same genotype. D. 1 kDa Alexa Flour 555 conjugated cadaverine (25 µg/g body weight) was injected into the tail vein to assess for blood–brain barrier integrity. The relative fluorescence unit per gram of tissue (RFU/Tissue [g]) was measured in brain homogenate of 3‐month‐old Slc20a2 +/−, Pdgfbret/ret and Slc20a2 −/− (n = 3). A one‐way ANOVA with Bonferroni correction for multiple comparisons indicates statistical significance (***P < 0.001).
Figure 8
Figure 8
App, Aplp2, Sparcl1 and Ctsz are common components of the brain extracellular matrix. Broad expression of App, Aplp2, Sparcl1 and Ctsz can be detected in different cells of (A) the blood–brain barrier (http://betsholtzlab.org/VascularSingleCells/database.html) and (B) the whole brain (http://linnarssonlab.org/cortex/). Every spike represents the expression level in an individual cell. C. qPCR for the expression of App, Aplp2 and Sparcl1 in microvascular fragments of calcification prone and non‐calcification prone regions of Pdgfbret/+ and Pdgfbret/ret mice. A two‐tailed Student’s t‐test indicates significant differences (*P < 0.05, ***P < 0.001).
Figure 9
Figure 9
Ahsg, Chga, Chgb and Vgf are not expressed by blood–brain barrier cells. A. Single cell expression of Ahsg, Chga, Chgb and Vgf in the cells of the blood–brain barrier. Except for an occasional expression of Chga in astrocytes, no expression of the four aforementioned genes could be detected. B. In the whole‐brain single‐cell dataset, expression of Chga, Chgb and Vgf was mostly restricted to the neurons. Expression of Ahsg could not be detected.
Figure 10
Figure 10
Spp1 and Mgp are selectively expressed in specific cell types of the blood–brain barrier. A. Spp1 is only expressed in a subpopulation of pericytes, as well as the fibroblast‐like cells. Mgp displays low expression in all mural cells and the largest arterial endothelial cells, but high expression in the fibroblast‐like cells. B. No selective Spp1 expression can be detected in the whole‐brain dataset, but Mgp is highest in the mural cell group and a subset of endothelial cells. C. Detailed close‐up of the two fibroblast‐like cell types indicate an inverse correlation between expression of Spp1 and Mgp. Green dotted lines are a visual aid to appreciate the location of the cells on the X‐axis. Note that the postion of all cells in the single‐cell database are fixed on the X‐axis, allowing comparison of gene expression on a cell‐to‐cell basis. D. Confocal images confirming the expression of SPARCL1 in GFAP‐positive astrocytes, MGP in PDGFRA‐positive perivascular fibroblast and CTSZ in IBA1‐positive microglia in 12‐month‐old Pdgfbret/+ animal. Staining for ASMA was used to pinpoint the perivascular localization of the PDGFRA‐positive cells to arteries. HOECHST was used to visualize the individual nuclei of the cells. Scale bars, 10 µm.
Figure 11
Figure 11
Astrocytes are the common expression site for cell autonomously acting PFBC genes. Single‐cell expression of Slc20a2, Myorg (also called AI464313), Xpr1 and Pdgfrb. Note that Pdgfrb is also expressed in astrocytes, yet to a lower level as compared to its expression in pericytes.

References

    1. Abramsson A, Kurup S, Busse M, Yamada S, Lindblom P, Schallmeiner E et al (2007) Defective N‐sulfation of heparan sulfate proteoglycans limits PDGF‐BB binding and pericyte recruitment in vascular development. Genes Dev 21:316–331. - PMC - PubMed
    1. Alder J, Thakker‐Varia S, Bangasser DA, Kuroiwa M, Plummer MR, Shors TJ, Black IB (2003) Brain‐derived neurotrophic factor‐induced gene expression reveals novel actions of VGF in hippocampal synaptic plasticity. J Neurosci 23:10800–10808. - PMC - PubMed
    1. Andersen JS, Lam YW, Leung AKL, Ong S‐E, Lyon CE, Lamond AI, Mann M (2005) Nucleolar proteome dynamics. Nature 433:77–83. - PubMed
    1. Armulik A, Genové G, Mäe M, Nisancioglu MH, Wallgard E, Niaudet C et al (2010) Pericytes regulate the blood‐brain barrier. Nature 468:557–561. - PubMed
    1. Blakely PK, Hussain S, Carlin LE, Irani DN (2015) Astrocyte matricellular proteins that control excitatory synaptogenesis are regulated by inflammatory cytokines and correlate with paralysis severity during experimental autoimmune encephalomyelitis. Front Neurosci 9:344. - PMC - PubMed

Publication types

MeSH terms

Substances