. 2019 Dec;9(12):2016-2024.
doi: 10.1002/2211-5463.12734. Epub 2019 Nov 1.

Inhibition of sodium-glucose cotransporter 2 ameliorates renal injury in a novel medaka model of nonalcoholic steatohepatitis-related kidney disease

Affiliations

Inhibition of sodium-glucose cotransporter 2 ameliorates renal injury in a novel medaka model of nonalcoholic steatohepatitis-related kidney disease

Takuro Nagoya et al. FEBS Open Bio. 2019 Dec.

Abstract

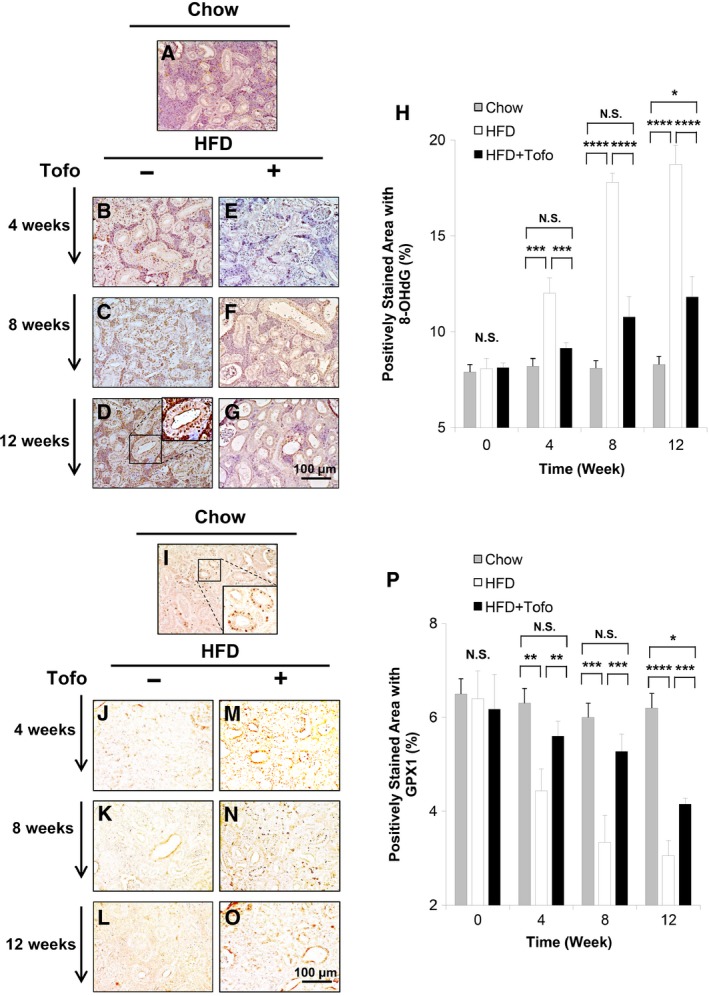
The effect of sodium-glucose cotransporter 2 inhibitor (SGLT2I) on nonalcoholic steatohepatitis (NASH) has been reported, but there are few studies on its effect on NASH-related renal injury. In this study, we examined the effect of SGLT2I using a novel medaka fish model of NASH-related kidney disease, which was developed by feeding the d-rR/Tokyo strain a high-fat diet. SGLT2I was administered by dissolving it in water of the feeding tank. SGLT2I ameliorates macrophage accumulation and oxidative stress and maintained mitochondrial function in the kidney. The results demonstrate the effect of SGLT2I on NASH-related renal injury and the usefulness of this novel animal model for research into NASH-related complications.

Keywords: Oryzias latipes; NASH; SGLT2 inhibitor; kidney; medaka disease model; renal disease.


Conflict of interest statement

The authors declare no conflict of interest.

Figures

Figure 1
Figure 1
Effects of Tofo on blood glucose, renal size, histological changes, and the glomerular size in the kidney of the medaka model of NASH. (A) The time‐dependent changes in the blood glucose serum biochemical markers. The values represent mean ± SD values (n = 15 for each group). Two‐way ANOVA followed by Bonferroni’s multiple comparison test. *P < 0.05. Representative microscopic findings of medaka liver tissues stained with hematoxylin and eosin staining from medaka fed with HFD (B) and HFD + Tofo (C) for 12 weeks. Scale bar represents 100 µm. (D) The time‐dependent changes in the renal size in each group. The values represent mean ± SD values (n = 15 for each group). *P < 0.05, **P < 0.01, ***P < 0.001, and NS, no statistical significance. One‐way ANOVA followed by Bonferroni's multiple comparison test. Representative microscopic findings of medaka kidney tissues stained with the periodic acid/Schiff method. (E) Chow‐fed medaka. (F–K) Medaka fed with HFD and HFD + Tofo for 4, 8, and 12 weeks. Scale bar represents 50 µm. (L) Quantitative analysis of glomerular size in the medaka kidneys. The values represent mean ± SD values (n = 15 for each group). *P < 0.05, **P < 0.01, ***P < 0.001, ****P < 0.0001, and NS, no statistical significance. One‐way ANOVA followed by Bonferroni’s multiple comparison test.
Figure 2
Figure 2
Effects of Tofo on the level of 8‐OHdG and GPX1 in the kidney of the medaka model of NASH. Representative microscopic findings of medaka kidney tissues stained with anti‐8‐OHdG antibody. (A) Chow‐fed medaka. (B–G) Medaka fed with HFD and HFD + Tofo for 4, 8, and 12 week. Scale bar represents 100 µm. (H) Quantitative analysis of positively stained area with anti‐8‐OHdG antibody in the medaka kidneys. The values represent mean ± SD values (n = 15 for each group). *P < 0.05, ***P < 0.001, ****P < 0.0001, and NS, no statistical significance. One‐way ANOVA followed by Bonferroni’s multiple comparison test. Representative microscopic findings of medaka kidney tissues stained with anti‐GPX1 antibody. (I) Chow‐fed medaka. (J–O) Medaka fed with HFD and HFD + Tofo for 4, 8, and 12 weeks. Scale bar represents 100 µm. (P) Quantitative analysis of positively stained area with anti‐GPX1 antibody in the medaka kidneys. The values represent mean ± SD values (n = 15 for each group). *P < 0.05, **P < 0.01, ***P < 0.001, and NS, no statistical significance. One‐way ANOVA followed by Bonferroni’s multiple comparison test.
Figure 3
Figure 3
Effects of Tofo on the accumulation of macrophages in the kidney of the medaka model of NASH. Representative microscopic findings of medaka kidney tissues stained with anti‐F4/80 antibody. (A) Chow‐fed medaka. (B–G) Medaka fed with HFD and HFD + Tofo for 4, 8, and 12 weeks. Scale bar represents 100 µm. (H) Quantitative analysis of the number of positively stained cells per high‐power field with anti‐F4/80 antibody in the medaka kidneys. The values represent mean ± SD values (n = 15 for each group). **P < 0.01, ***P < 0.001, ****P < 0.0001, and NS, no statistical significance. One‐way ANOVA followed by Bonferroni's multiple comparison test.
Figure 4
Figure 4
Effects of Tofo on the expression of OPA1 in the renal tubules in the kidney of the medaka model of NASH. Representative microscopic findings of medaka kidney tissues stained with anti‐OPA1 antibody. (A) Chow‐fed medaka. (B–G) Medaka fed with HFD and HFD + Tofo for 4, 8, and 12 weeks. Scale bar represents 100 µm. (H) Quantitative analysis of the number of positively stained cells with anti‐OPA1 antibody in the renal tubules in the medaka kidneys. The values represent mean ± SD values (n = 15 for each group). *P < 0.05, ***P < 0.001, ****P < 0.0001, and NS, no statistical significance. One‐way ANOVA followed by Bonferroni's multiple comparison test.

Similar articles

Cited by

References

    1. NCD Risk Factor Collaboration (2016) Trends in adult body‐mass index in 200 countries from 1975 to 2014: a pooled analysis of 1698 population‐based measurement studies with 19.2 million participants. Lancet 387, 1377–1396. - PMC - PubMed
    1. Younossi ZM, Koenig AB, Abdelatif D, Fazel Y, Henry L and Wymer M (2016) Global epidemiology of nonalcoholic fatty liver disease‐Meta‐analytic assessment of prevalence, incidence, and outcomes. Hepatology 64, 73–84. - PubMed
    1. Neuschwander‐Tetri BA (2017) Non‐alcoholic fatty liver disease. BMC Med 15, 45. - PMC - PubMed
    1. Lallukka S and Yki‐Jarvinen H (2016) Non‐alcoholic fatty liver disease and risk of type 2 diabetes. Best Pract Res Clin Endocrinol Metab 30, 385–395. - PubMed
    1. Gastaldelli A, Cusi K, Pettiti M, Hardies J, Miyazaki Y, Berria R, Buzzigoli E, Sironi AM, Cersosimo E, Ferrannini E et al (2007) Relationship between hepatic/visceral fat and hepatic insulin resistance in nondiabetic and type 2 diabetic subjects. Gastroenterology 133, 496–506. - PubMed

Publication types

MeSH terms

Substances