. 2019 Sep 26;10(10):755.
doi: 10.3390/genes10100755.

Genome-Wide Identification, Characterization and Expression Patterns of the Pectin Methylesterase Inhibitor Genes in Sorghum bicolor

Affiliations

Genome-Wide Identification, Characterization and Expression Patterns of the Pectin Methylesterase Inhibitor Genes in Sorghum bicolor

Angyan Ren et al. Genes (Basel). .

Abstract

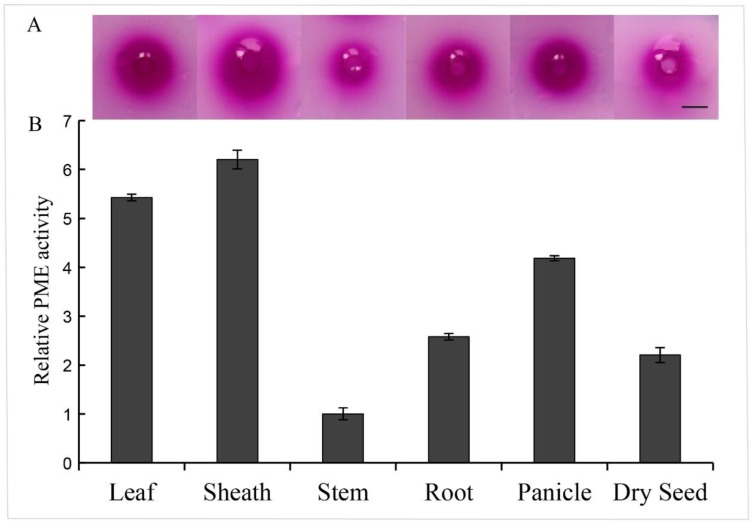
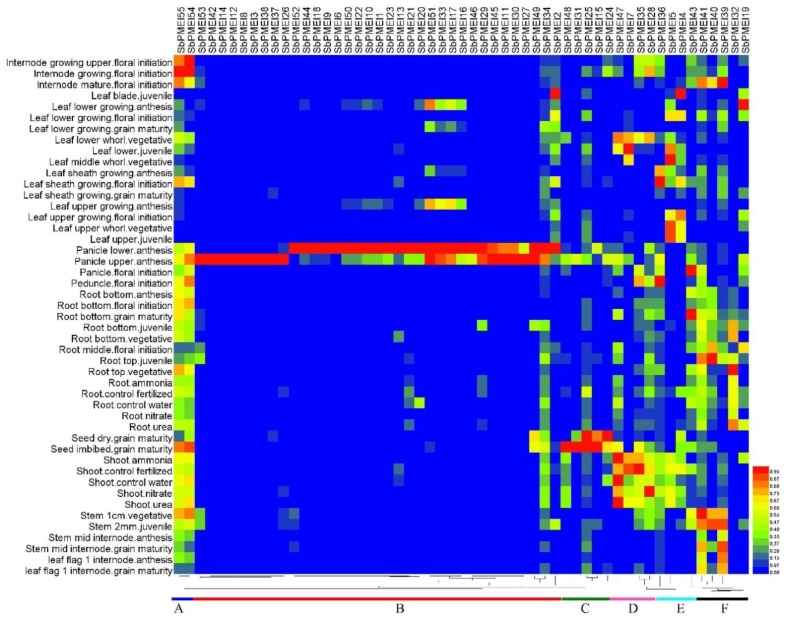
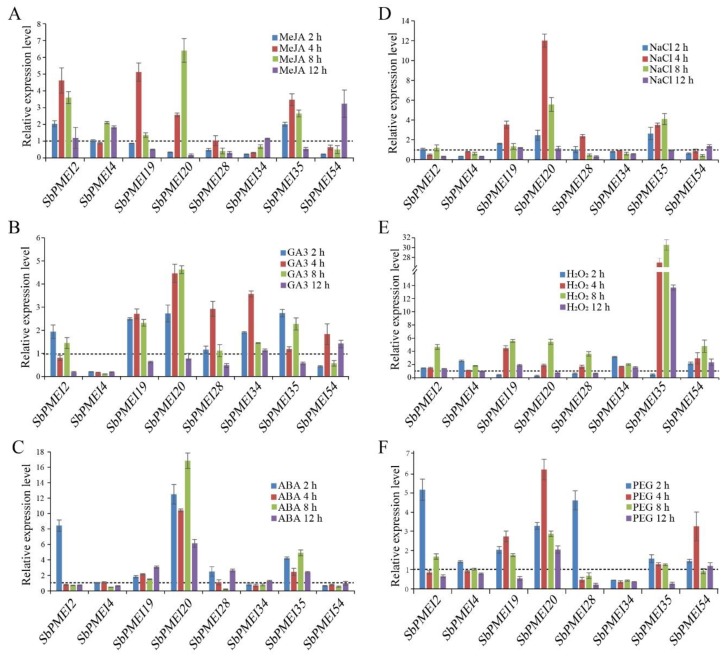
Cell walls are basically complex with dynamic structures that are being involved in several growth and developmental processes, as well as responses to environmental stresses and the defense mechanism. Pectin is secreted into the cell wall in a highly methylesterified form. It is able to perform function after the de-methylesterification by pectin methylesterase (PME). Whereas, the pectin methylesterase inhibitor (PMEI) plays a key role in plant cell wall modification through inhibiting the PME activity. It provides pectin with different levels of degree of methylesterification to affect the cell wall structures and properties. The PME activity was analyzed in six tissues of Sorghum bicolor, and found a high level in the leaf and leaf sheath. PMEI families have been identified in many plant species. Here, a total of 55 pectin methylesterase inhibitor genes (PMEIs) were identified from S. bicolor whole genome, a more detailed annotation of this crop plant as compared to the previous study. Chromosomal localization, gene structures and sequence characterization of the PMEI family were analyzed. Moreover, cis-acting elements analysis revealed that each PMEI gene was regulated by both internal and environmental factors. The expression patterns of each PMEI gene were also clustered according to expression pattern analyzed in 47 tissues under different developmental stages. Furthermore, some SbPMEIs were induced when treated with hormonal and abiotic stress. Taken together, these results laid a strong foundation for further study of the functions of SbPMEIs and pectin modification during plant growth and stress responses of cereal.

Keywords: PMEI; Sorghum bicolor; cell wall; cis-acting element; expression patterns; gene expression; gene structure; qRT-PCR.


Conflict of interest statement

The authors declare no conflict of interest.

Figures

Figure 1
Figure 1
Relative pectin methylesterase (PME) activity analysis of six sorghum tissues. Total protein was extracted from six tissues of sorghum to analyze the PME activity. (A) Stained gels of the PME reaction using ruthenium red, the red halo means the de-methylesterificated pectin by PME. Scale bar = 0.5 cm. (B) The relative PME activity with the tissue stem area set to one, based on the halo area of stained gel.
Figure 2
Figure 2
PMEI genes’ distribution on sorghum chromosomes. Red rectangles represent the gene clusters, with the distance of SbPMEIs in a 100 kb region within an individual chromosome. The tandem gene duplications are indicated by blue colored names. Chr: Chromosome.
Figure 3
Figure 3
The phylogenetic tree analysis. (A) and (B) Maximum likelihood (ML) tree of PMEI proteins of Sorghum bicolor (blue triangle), Arabidopsis thaliana (green circle), and Oryza sativa (yellow square) fell into five clades. (C) Three subfamilies were evolved based on the neighbor-joining (NJ) tree of 55 S. bicolor PMEI proteins.
Figure 4
Figure 4
The NJ tree, the conserved domain in 55 SbPMEI proteins and the gene structures of sorghum 55 PMEI genes. (A) NJ phylogenetic tree by aligning the PMEI protein sequences of sorghum. (B) PMEI conserved domains (green rectangle) are presented in each PMEI proteins and transmembrane regions (red rectangle) are presented in 22 PMEI proteins of sorghum. (C) Gene structure of each SbPMEI. Exons and untranslated regions are presented by yellow and blue boxes, respectively. While, introns are presented by black lines.
Figure 5
Figure 5
Protein–protein interaction networks of SbPMEI18 and SbPMEI21. (A) The interaction network of SbPMEI18. (B) The interaction network of SbPMEI21. The networks were generated from the STRING database. The red balls represented the queried protein while the other balls were the identifier. The annotation of the predicted protein was derived from UniProtKB (https://www.uniprot.org/). Line thickness indicates the strength of data support.
Figure 6
Figure 6
Cis-acting elements in the 1.5 kb promoter region of each PMEI gene of each subfamily in sorghum. 1.5 kb region before translation start codon (ATG) of each SbPMEI gene was analyzed by plant PlantCARE, and four major types of cis-acting elements were drawn above accordingly. The NJ phylogenetic tree was made with the proteins from the same subfamily.
Figure 7
Figure 7
Heat map of 55 PMEIs in 47 tissues at different growth and developmental stages. The heat map shows the relative abundances of expressed genes. It ranges from low abundance (blue) to medium abundances (green) and high abundance (red). According to the expression patterns, six clusters (AF) were classified.
Figure 8
Figure 8
Relative expression levels of eight SbPMEIs involved in three exogenous hormones (AC) and abiotic stresses (EF) using qRT-PCR. Expression patterns treated by: (A) 100 μM MeJA; (B) 100 μM gibberellin A3; (C) 100 μM of abscisic acid; (D) 250 mM NaCl; (E) 100 mM hydrogen peroxide and (F) 25% (w/v) polyethylene glycol. The relative expression level of eleven SbPMEIs were calculated relative to treatment at 0 h.

References

    1. Zhao Y., Man Y., Wen J., Guo Y., Lin J. Advances in Imaging Plant Cell Walls. Trends Plant Sci. 2019;24:867–878. doi: 10.1016/j.tplants.2019.05.009. - DOI - PubMed
    1. Somerville C., Bauer S., Brininstool G.M., Facette M.R., Hamann T., Milne J.S., Osborne E., Paredez A.R., Persson S., Raab T.K., et al. Toward a systems approach to understanding plant-cell walls. Science. 2004;306:2206–2211. doi: 10.1126/science.1102765. - DOI - PubMed
    1. Mohnen D. Pectin structure and biosynthesis. Curr. Opin. Plant Biol. 2008;11:266–277. doi: 10.1016/j.pbi.2008.03.006. - DOI - PubMed
    1. An S.H., Sohn K.H., Choi H.W., Hwang I.S., Lee S.C., Hwang B.K. Pepper pectin methylesterase inhibitor protein CaPMEI1 is required for antifungal activity, basal disease resistance and abiotic stress tolerance. Planta. 2008;228:61–78. doi: 10.1007/s00425-008-0719-z. - DOI - PMC - PubMed
    1. Zhang G., Feng J., Wu J., Wang X. BoPMEI1, a pollen-specific pectin methylesterase inhibitor, has an essential role in pollen tube growth. Planta. 2010;231:1323–1334. doi: 10.1007/s00425-010-1136-7. - DOI - PubMed

Publication types

MeSH terms