. 2019 Sep 26;10(10):759.
doi: 10.3390/genes10100759.

A Portal to Visualize Transcriptome Profiles in Mouse Models of Neurological Disorders

Affiliations

A Portal to Visualize Transcriptome Profiles in Mouse Models of Neurological Disorders

Rami Al-Ouran et al. Genes (Basel). .

Abstract

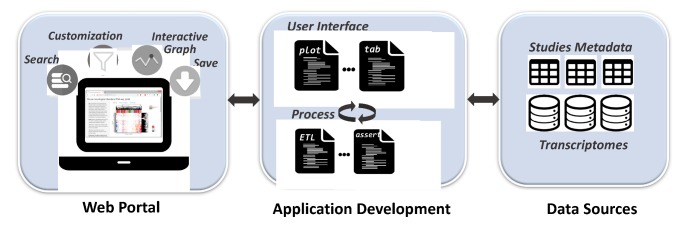
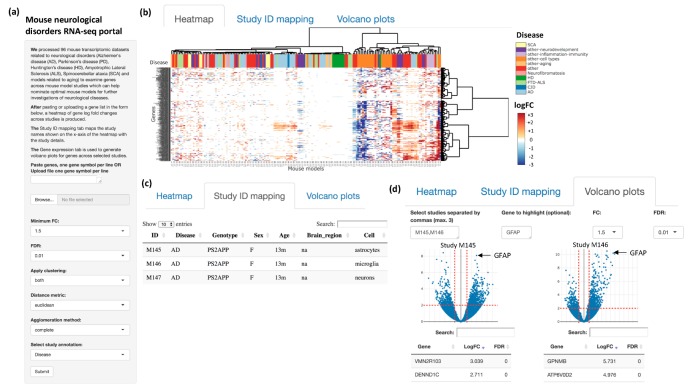
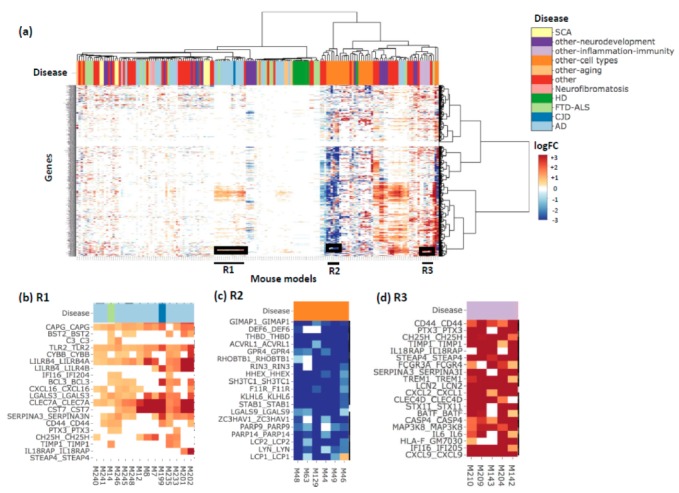
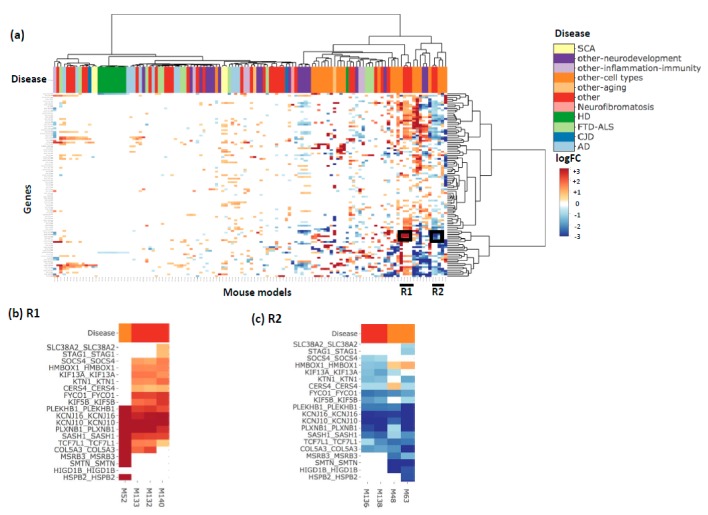
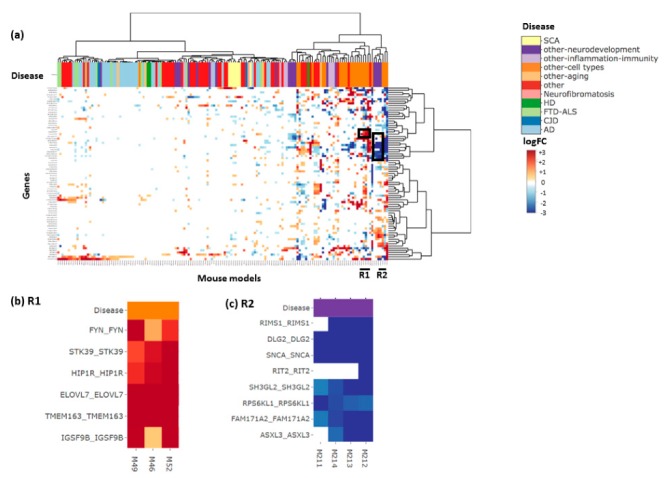
Target nomination for drug development has been a major challenge in the path to finding a cure for several neurological disorders. Comprehensive transcriptome profiles have revealed brain gene expression changes associated with many neurological disorders, and the functional validation of these changes is a critical next step. Model organisms are a proven approach for the elucidation of disease mechanisms, including screening of gene candidates as therapeutic targets. Frequently, multiple models exist for a given disease, creating a challenge to select the optimal model for validation and functional follow-up. To help in nominating the best mouse models for studying neurological diseases, we developed a web portal to visualize mouse transcriptomic data related to neurological disorders: http://mmad.nrihub.org. Users can examine gene expression changes across mouse model studies to help select the optimal mouse model for further investigation. The portal provides access to mouse studies related to Alzheimer's diseases (AD), Parkinson's disease (PD), Huntington's disease (HD), Amyotrophic Lateral Sclerosis (ALS), Spinocerebellar ataxia (SCA), and models related to aging.

Keywords: Neurodegeneration; mouse models; neurological disorders; transcriptomics.


Conflict of interest statement

The authors declare no conflict of interest.

Figures

Figure 1
Figure 1
Infrastructure of the mouse transcriptome portal.
Figure 2
Figure 2
Web interface. (a) Users can input a list of genes into the text box or upload a file with a list of genes to study gene expression changes across mouse studies. (b) The ‘Heatmap’ tab displays an interactive heatmap with annotations at the top (e.g., disease). (c) The ‘Study identifier (ID) mapping’ tab displays a table mapping between the mouse model IDs displayed on the heatmap and the full study annotations. (d) The ‘Volcano plots’ tab displays interactive volcano plots where users could compare three studies at a time and highlight a gene of interest. Below each volcano plot, the complete list of genes per study are displayed with their log fold change (FC) and false discovery rate (FDR) values.
Figure 3
Figure 3
The yellow gene module heatmap. (a) The heatmap of genes from the yellow gene module from Zhang et al. [9] which is highly enriched with immune and microglial functions, annotated by disease. Each gene name is annotated as ‘Human-gene-symbol_Mouse-gene-symbol’. (b) A zoom in into the R1 boxed region from the heatmap where the majority of mouse studies are AD studies. (c) A zoom into the R2 boxed region where the studies were related to studying different cell types in mouse. (d) A zoom in into the R3 boxed region where all the studies are related to inflammation and immunity. Users can use the interactive heatmap available through the portal to zoom in to regions of interest.
Figure 4
Figure 4
Module 109 (m109) heatmap. (a) The heatmap of genes from module m109 from Mostafavi et al. [10] which was significantly associated with cognitive decline, annotated by disease. Each gene name is annotated as ‘Human-gene-symbol_Mouse-gene-symbol’. (b) A zoom in into the R1 boxed region from the heatmap where M132, M133, M140 study the effect of ethanol on synaptic transcriptome and synaptic plasticity. (c) A zoom in into the R2 boxed region from the heatmap where M48 studies the transcriptome in neurons while M63 studies the transcriptome of dopaminergic neurons from the midbrain.
Figure 5
Figure 5
Examining nearest genes to top variants associated with PD. (a) The heatmap for nearest genes to single-nucleotide polymorphisms (SNPs) significantly associated with PD from a large PD genome-wide association study (GWAS) [13]. (b) A zoom-in into the R1 boxed region consisting of three DEGs (M49, M46, M52) studying cell types in the mouse. (c) A zoom-in into the R2 boxed region consisting of four DEGs (M211, M214, M213, M212) related to microglia development.

References

    1. Lonsdale J., Thomas J., Salvatore M., Phillips R., Lo E., Shad S., Hasz R., Walters G., Garcia F., Young N., et al. The Genotype-Tissue Expression (GTEx) project. Nat. Genet. 2013;45:580–585. doi: 10.1038/ng.2653. - DOI - PMC - PubMed
    1. Zhang Y., Chen K., Sloan S.A., Bennett M.L., Scholze A.R., O’Keeffe S., Phatnani H.P., Guarnieri P., Caneda C., Ruderisch N., et al. An RNA-Sequencing Transcriptome and Splicing Database of Glia, Neurons, and Vascular Cells of the Cerebral Cortex. J. Neurosci. 2014;34:11929–11947. doi: 10.1523/JNEUROSCI.1860-14.2014. - DOI - PMC - PubMed
    1. Zhang Y., Sloan S.A., Clarke L.E., Caneda C., Plaza C.A., Blumenthal P.D., Vogel H., Steinberg G.K., Edwards M.S.B., Li G., et al. Purification and Characterization of Progenitor and Mature Human Astrocytes Reveals Transcriptional and Functional Differences with Mouse. Neuron. 2016;89:37–53. doi: 10.1016/j.neuron.2015.11.013. - DOI - PMC - PubMed
    1. Smith C.M., Hayamizu T.F., Finger J.H., Bello S.M., McCright I.J., Xu J., Baldarelli R.M., Beal J.S., Campbell J., Corbani L.E., et al. The mouse Gene Expression Database (GXD): 2019 update. Nucleic Acids Res. 2019;47:D774–D779. doi: 10.1093/nar/gky922. - DOI - PMC - PubMed
    1. Lachmann A., Torre D., Keenan A.B., Jagodnik K.M., Lee H.J., Wang L., Silverstein M.C., Ma’ayan A. Massive mining of publicly available RNA-seq data from human and mouse. Nat. Commun. 2018;9:1366. doi: 10.1038/s41467-018-03751-6. - DOI - PMC - PubMed

Publication types