. 2019 Sep 27;11(18):7416-7441.
doi: 10.18632/aging.102246. Epub 2019 Sep 27.

Hearing consequences in Gjb2 knock-in mice: implications for human p.V37I mutation

Affiliations

Hearing consequences in Gjb2 knock-in mice: implications for human p.V37I mutation

Xin Lin et al. Aging (Albany NY). .

Abstract

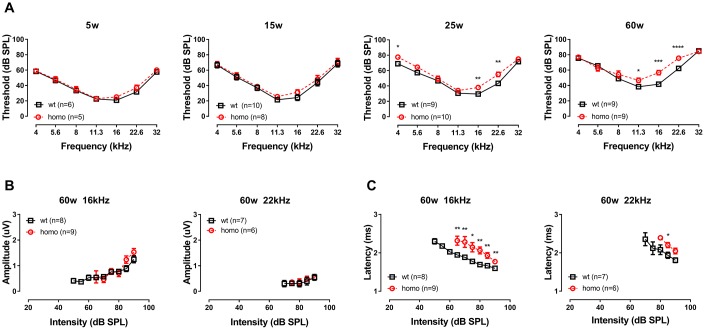
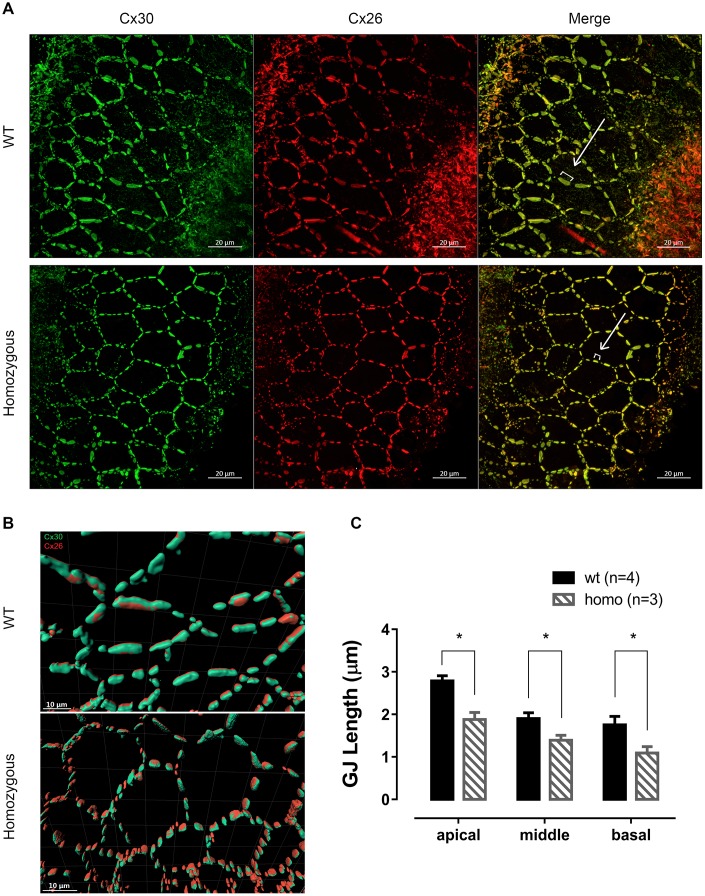
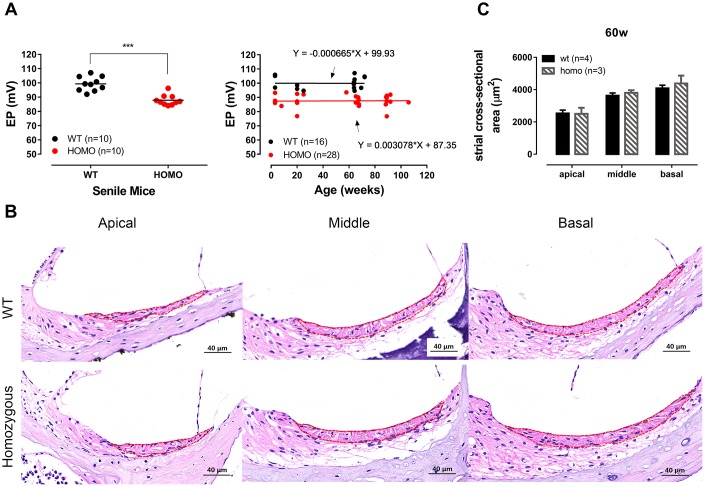
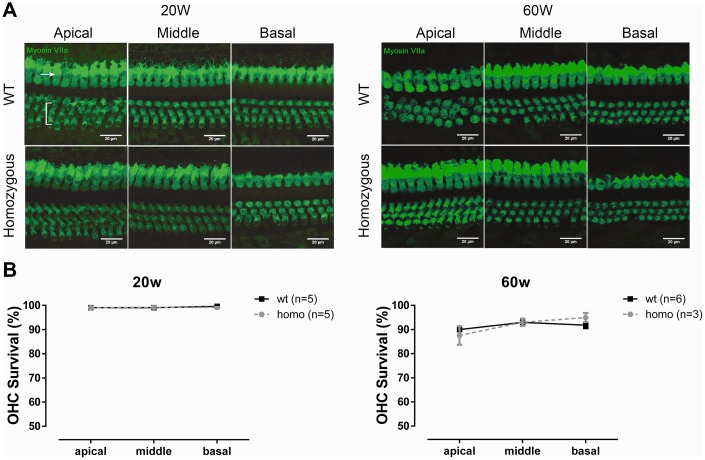
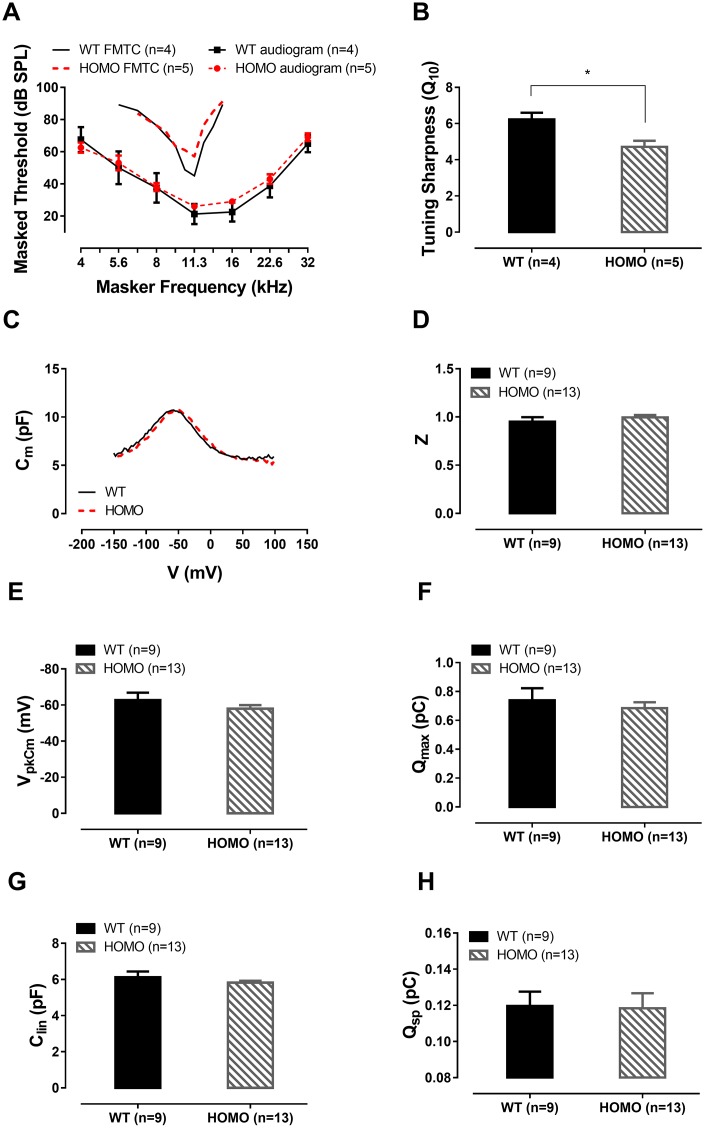
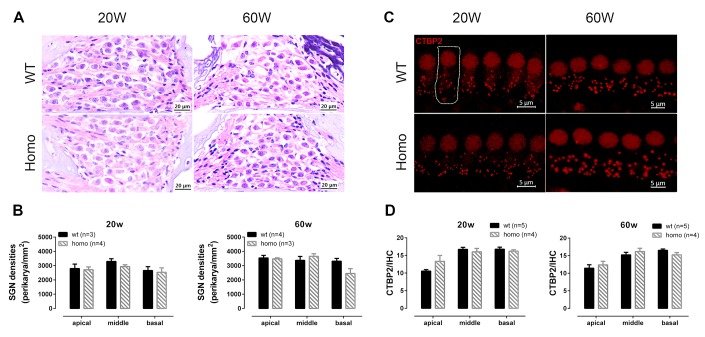
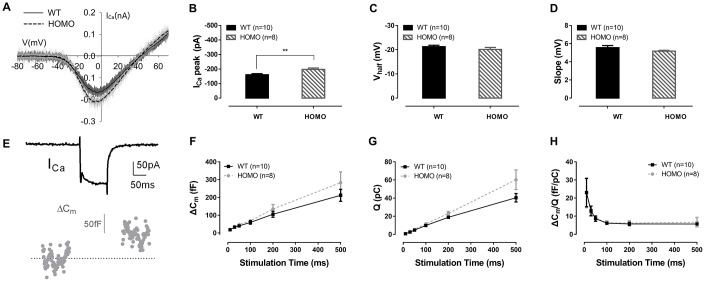
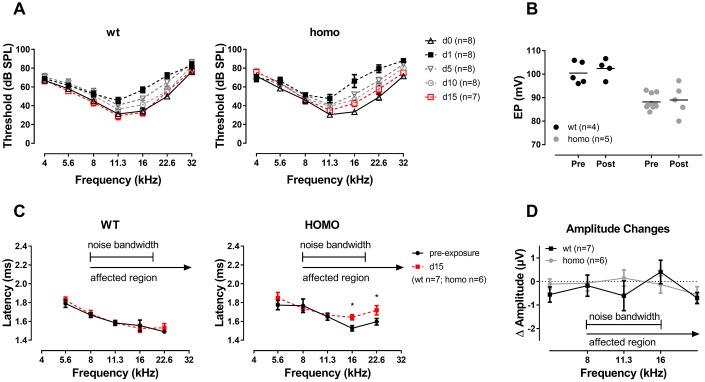
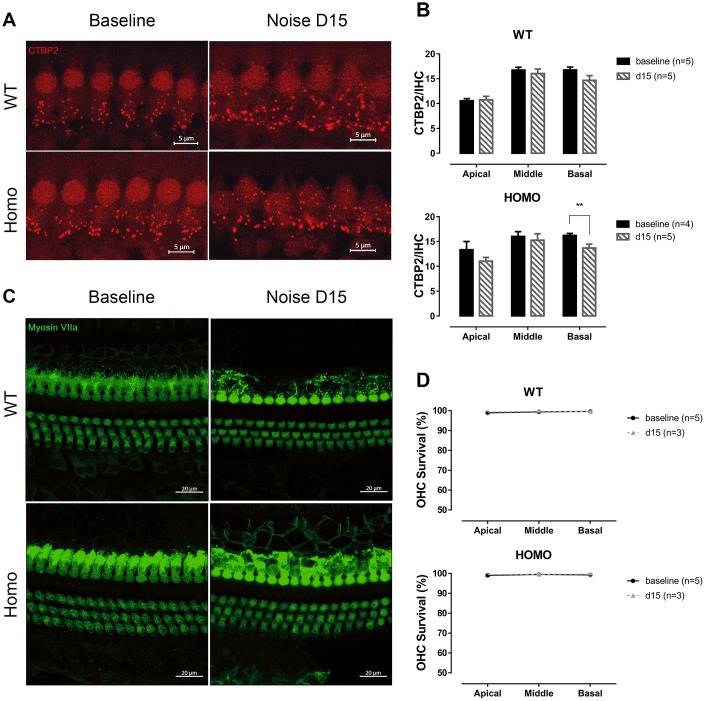
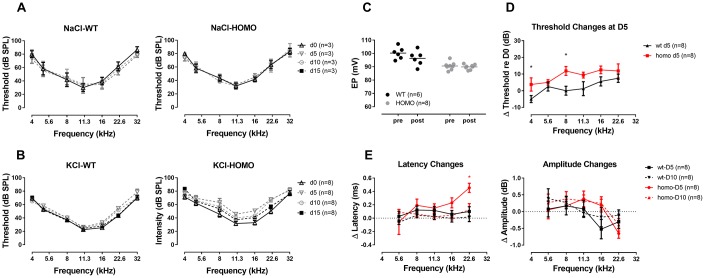
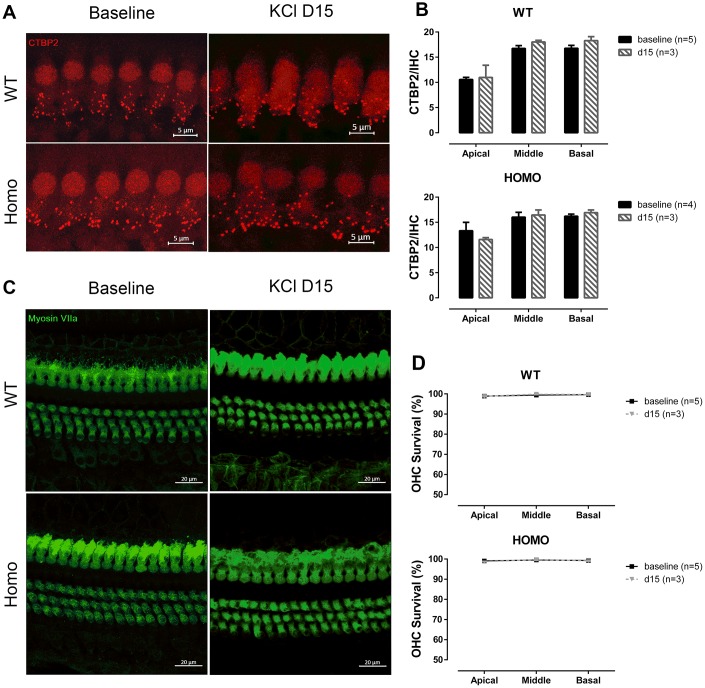
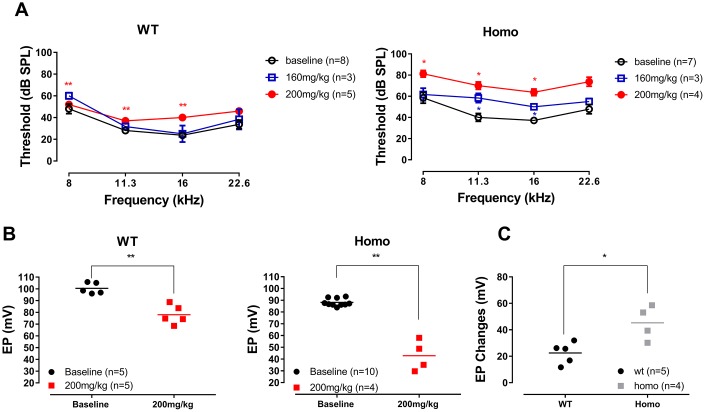
Human p.V37I mutation of GJB2 gene was strongly correlated with late-onset progressive hearing loss, especially among East Asia populations. We generated a knock-in mouse model based on human p.V37I variant (c.109G>A) that recapitulated the human phenotype. Cochlear pathology revealed no significant hair cell loss, stria vascularis atrophy or spiral ganglion neuron loss, but a significant change in the length of gap junction plaques, which may have contributed to the observed mild endocochlear potential (EP) drop in homozygous mice lasting lifetime. The cochlear amplification in homozygous mice was compromised, but outer hair cells' function remained unchanged, indicating that the reduced amplification was EP- rather than prestin-generated. In addition to ABR threshold elevation, ABR wave I latencies were also prolonged in aged homozygous animals. We found in homozygous IHCs a significant increase in ICa but no change in Ca2+ efficiency in triggering exocytosis. Environmental insults such as noise exposure, middle ear injection of KCl solution and systemic application of furosemide all exacerbated the pathological phenotype in homozygous mice. We conclude that this Gjb2 mutation-induced hearing loss results from 1) reduced cochlear amplifier caused by lowered EP, 2) IHCs excitotoxicity associated with potassium accumulation around hair cells, and 3) progression induced by environmental insults.

Keywords: GJB2; age-related hearing loss; environmental stress; hair cells; potassium recycling.


Conflict of interest statement

CONFLICTS OF INTEREST: The authors declared that no conflict of interest exists.

Figures

Figure 1
Figure 1
Auditory Brainstem Response (ABR) threshold and Wave I analysis in KI mice. (A) Auditory Brainstem Responses (ABR) of p.V37I knock-in mice (Homozygous, red dotted line, Mean ± SEM) and age-matched wild-type mice (wt, black line, Mean ± SEM). Significant ABR threshold elevation was not observed until 25 weeks old, which started from 16 kHz (**P=0.005, F(1.8)=14.629 at 25 weeks and *** P=0.000137, F(1,8)=46.286 at 60 weeks, two-way ANOVA followed by Bonferroni post-test) and 22 kHz (**P=0.002, F(1,8)=19.412844 at 25 weeks and **** P=0.000044, F(1,8)=64.000 at 60 weeks, two-way ANOVA followed by Bonferroni post-test) gradually expanded to 11 kHz (*P=0.028, F(1,8)=7.143 at 60 weeks, two-way ANOVA followed by Bonferroni post-test). A significant ABR threshold elevation in 4 kHz was observed at 25 weeks old (*P=0.010333, F(1,8)=11.111, two-way ANOVA followed by Bonferroni post-test) but disappeared at 60 weeks old. ABR Wave I amplitude (B) and latency (C) of 16kHz and 22.6kHz in 60 week-old homozygous (red dotted line, Mean ± SEM) and wild-type (black line, Mean ± SEM) mice plotted as a function of sound levels. Amplitude did not differ between genotypes (both P>0.05, two-way ANOVA followed by Bonferroni post-test), while latency showed significant prolongation in homozygous mice (*P<0.01, **P<0.001, two-way ANOVA followed by Bonferroni post-test). Animals lacked visible Wave I were excluded for amplitude and latency analysis.
Figure 2
Figure 2
Connexin expression patterns in senior KI mice. (A) Representative confocal images of connexin 26 (Cx26, red), connexin 30 (Cx30, green) and merged images at the age of 60 weeks from apical turns of the basilar membrane. Cx26 and Cx30 were well expressed on the supporting cell membrane and mostly overlapped, forming a honeycomb-like labeling pattern. White brackets indicate the length of representative Cx plaques measured. Scale Bar, 20 μm. (B) Graphs of Imaris 3D-reconstructed images plotted at higher magnification. Cx26 (red) were accurately co-localized with Cx30 (green) in an adjacent parallel pattern. Cx plaques appeared shorter in homozygous supporting cells (Scale Bar, 10 μm). (C) Histograms presenting the average length of the CJ plaques, measured as shown in panel A, of both homozygous and wild-type mice (Mean + SEM). GJs were significantly shorter in homozygous mice in every turn (*P<0.05, two-way ANOVA followed by Bonferroni post-test).
Figure 3
Figure 3
Endocochlear potential (EP) measurement and Stria Vascularis morphology in KI mice. (A) Significantly reduced EP in senile homozygous mice (ranging from 60 weeks old to 90 weeks old) (Left panel, ***P <0.0001, t=5.876, df=16.6, Student’s unpaired t-test with Welch’s correction). Symbols represent individual measurement and lines are the means. EP reduction of homozygous mice remained stable within the expanded timeline from 3 postnatal weeks to ~2 years (Right panel). Linear regressions showed that slopes of both groups were virtually zero (fitted functions are shown in the right panel, both P>0.05, linear regression). (B) Representative H&E staining of Stria vascularis for all three turns with cross-sectional areas outlined for quantitative analysis (scale bar, 40 μm). (C) Histogram illustrating the averaged cross-sectional area of Stria Vascularis of 60 weeks old cochleae (Mean + SEM). The cross-sectional area showed no significant difference between wild-type and homozygous mice (P>0.05, two-way ANOVA followed by Bonferroni post-test).
Figure 4
Figure 4
OHC count in KI mice. (A) Representative confocal images of OHCs and IHCs at the age of 20 weeks and 60 weeks. Bracket indicates three rows of OHCs, and arrowhead points to one row of IHCs (Scale Bar, 20 μm). (B) Line graphs illustrating the percentage of OHC survival in every cochlear turn of each group and at each time point. There were fewer losses of OHCs in both homozygous and wild-type mice at 20 weeks old (left panel, P>0.05, two-way ANOVA followed by Bonferroni post-test). Both groups had minor OHC loss at the age of 60 weeks, but no difference between the two groups was found (right panel, P>0.05, two-way ANOVA followed by Bonferroni post-test).
Figure 5
Figure 5
ABR forward masking tuning curves and outer hair cell (OHC) patch clamp recordings in KI mice at 20 weeks. (A) Homozygous mice exhibited no significant ABR threshold elevation (P>0.05, two-way ANOVA followed by Bonferroni post-test). Averaged ABR forward masking tuning curves of 11 kHz probe tone were also presented as a function of masker frequency. The averaged tip threshold of homozygous mice showed no significant difference compared to those of wild-type mice (P>0.05, Student’s unpaired t-test with Welch’s correction). The tail portions of the FMTC overlapped between the two genotype groups. Averaged audiograms from the same tested animals were provided for reference. (B) Significantly lower Q10 values measured in homozygous mice compared with their wild-type counterparts (6.228 ± 0.3705 and 4.712 ± 0.3353, Mean ± SEM for wild-type and homozygotes, respectively, *P=0.0204, Student’s unpaired t-test with Welch’s correction). (C) Representative OHC NLC traces from 20 week-old wild-type and homozygous mice. (DG) No significant difference was found between the Z value, VpkCm, Qmax and Clin of both genotypes (all P>0.05, Student’s unpaired t-test with Welch’s correction). (H) Normalized Prestin’s charge density Qsp, derived from Qmax/Clin, showing no difference between the two groups (P>0.05, Student’s unpaired t-test with Welch’s correction).
Figure 6
Figure 6
Spiral ganglion neuron (SGN) and inner hair cell (IHC) synapse count in KI mice at different ages. (A) Representative H&E staining images of SGNs at 20 and 60 week-old homozygous and wild-type mice (Scale Bar, 20 μm). (B) SGN density (Number of SGNs/area of Rosenthal’s canal) showing no significant difference between wild-type and homozygous mice at both time points (P>0.05 at both time points, two-way ANOVA followed by Bonferroni post-test). (C) Representative confocal images of IHC synapses. Dotted line outlines a single IHC (Scale Bar, 5 μm). (D) The numbers of CTBP2 puncta per IHC at both 20 and 60 weeks old showing no significant difference between two genotype groups (P>0.05 at both age groups, two-way ANOVA followed by Bonferroni post-test).
Figure 7
Figure 7
Inner hair cell (IHC) patch clamp recordings in KI mice. (A) Representative calcium currents (ICa) induced by voltage ramps in IHCs of wild-type and homozygous mice. (B) The ICa peak of homozygous mice was significantly lower than wild-type mice (**P= 0.0091, t=2.978, df=15.49, Student’s unpaired t-test with Welch’s correction). (C) Vhalf, and (D) slope of Ica showed no significant difference between the two genotype groups (P>0.05, Student’s unpaired t-test with Welch’s correction). (E) Representative whole-cell ICa and membrane capacitance (Cm) traces. Exocytosis was triggered by calcium current in response to a single step depolarization. (F) Homozygous mice exhibited no significant membrane capacitance change (ΔCm), (G) calcium charge (Q) or (H) ΔCm/Q, representing Ca2+ efficiency in triggering exocytosis (all P>0.05, two-way ANOVA followed by Bonferroni post-test).
Figure 8
Figure 8
ABR analysis and EP measurement in KI mice after noise exposure. (A) ABR audiograms tracking changes of thresholds after one episode of a two-hour, 100 dB SPL, 8-16 kHz band-pass noise exposure. ABR thresholds of both groups recovered to the baseline level at 15 days after noise exposure (P>0.05 for both genotypes, two-way ANOVA followed by Bonferroni post-test). (B) EPs didn’t change in both wild-type and homozygous mice at day 15 of noise exposure (P>0.05, Student’s unpaired t-test with Welch’s correction). Baseline EPs were obtained by pooling data from young individuals less than 20 weeks old in Figure 3. (C) Comparison of Wave I latencies of day 0 (pre-exposure) and day 15 at 90dB SPL showing that homozygous mice presented a tendency of prolonged latency in frequencies above 11.3 kHz (*P=0.021, F(1,5)=11.003 at 16 kHz and *P=0.016, F(1,5)=12.961 at 22.6 kHz, two-way ANOVA followed by Bonferroni post-test). (D) Summary of ABR Wave I amplitude showing no significant difference between the two genotypes (P>0.05 for all frequencies, two-way ANOVA followed by Bonferroni post-test). ΔAmplitude=day 15 amplitude at 90 dB SPL - day 0 amplitude at 90 dB SPL.
Figure 9
Figure 9
IHC synapse and OHC count in KI mice after noise exposure. (A) Representative confocal images of IHC CTBP2 puncta before and after noise exposure. (Scale Bar, 5μm). (B) Histograms summarizing averaged number of CTBP2 puncta at different turns (Mean + SEM). Reduction of CTBP2 was only observed at the basal turn in homozygous mice 15 days after noise exposure (*P=0.024, F(1,4)=12.423, two-way ANOVA followed by Bonferroni post-test). (C) Representative confocal images of hair cells before and after noise exposure. (Scale Bar, 20μm). (D) OHC survivals at day 0 and 15 were compared. No significant hair cell loss was observed in both genotypes in all three turns (all P>0.05, two-way ANOVA followed by Bonferroni post-test). Baseline images and data were obtained from the same group of 20-week-old animals as in Figure 6.
Figure 10
Figure 10
ABR analysis and EP measurement in KI mice with a one-time trans-tympanic middle ear injection of KCl solution. (A) ABR thresholds remaining unchanged throughout two weeks after the control injection of NaCl solution (all P>0.05 for both genotypes, two-way ANOVA followed by Bonferroni post-test). (B) More substantial ABR threshold shifts were observed in homozygous mice following a one-time, 150 mM KCl injection, and recovered at day 15 (P>0.05, two-way ANOVA followed by Bonferroni post-test). (C) EPs tested after direct round window membrane application of KCl solution for 10 minutes showing no significant change in both wild-type and homozygous mice (P>0.05, Student’s unpaired t-test with Welch’s correction). Baseline EPs were obtained by pooling data from young individuals less than 20 weeks old in Figure 3. (D) ABR threshold changes at day 5 after KCl injection (ΔThreshold=day 5 Threshold–day 0 Threshold) with a trend of larger threshold shift in homozygous mice (*P=0.047, F(1,7)=5.814 and *P=0.012, F(1,7)=11.332, for 4 kHz and 8 kHz, respectively, two-way ANOVA followed by Bonferroni post-test). (E) Summary of ABR Wave I latency changes (left panel, ΔLatency=averaged day 5 or day 10 Latency - averaged day 0 Latency) and Wave I amplitude changes (right panel, ΔAmplitude=day 5 or day 10 Amplitude at 90dB SPL - day 0 Amplitude at 90dB SPL). A frequency dependent increase in ΔLatency was observed in homozygous mice, especially in the frequency of 22.6 kHz at day 5 (*P=0.011, F(1,7)=11.727, two-way ANOVA followed by Bonferroni post-test). At day 10, latencies of wild-type mice almost recovered to the baseline level, while those of homozygous mice still had a residual latency prolongation at higher frequencies (P>0.05, two-way ANOVA followed by Bonferroni post-test). ΔAmplitude did not show any significant difference in all frequencies between two genotypes both at day 5 and day 10 (right panel, P>0.05, two-way ANOVA followed by Bonferroni post-test). Wave I responses for 32 kHz were missing therefore not included in this analysis.
Figure 11
Figure 11
IHC synapse and OHC count in KI mice after middle ear injection of KCl solution. (A) Representative confocal images of IHC CTBP2 puncta before and after KCl middle ear injection. (Scale Bar, 5μm). (B) Histograms summarizing the average number of CTBP2 puncta at different turns (Mean + SEM). Middle ear injection of KCl solution did not affect CTBP2 expression (P>0.05, two-way ANOVA followed by Bonferroni post-test). (C) Representative confocal images of hair cells before and after KCl middle ear injection. (Scale Bar, 20μm). (D) Lack of significant hair cell loss observed in either genotype when compared to baseline data (d0) (P>0.05, two-way ANOVA followed by Bonferroni post-test). Baseline images and data were obtained from the same group of 20-week-old animals as in Figures 6 and 9.
Figure 12
Figure 12
ABR and EP measurement before and after furosemide treatment. (A) ABR thresholds of four representative frequencies (8, 11.3, 16 and 22.6 kHz) monitored 20 to 30 minutes after furosemide injection. No threshold shift was observed in wild-type mice when 160 mg/kg furosemide was administered (all P>0.05, two-way ANOVA followed by Bonferroni post-test), and only a mild threshold elevation occurred when the dose was increased to 200 mg/kg (left panel, **all P<0.01 at 8, 11.3 and 16 kHz, two-way ANOVA followed by Bonferroni post-test). Homozygous mice responded to 160 mg/kg furosemide with moderate threshold elevation (right panel, *P=0.038, F(1,2)=25.00 at 11.3 kHz and P=0.020, F(1,2)=49.00 at 16 kHz, two-way ANOVA followed by Bonferroni post-test), and hearing loss developed when the dose increased to 200 mg/kg (right panel, *all P<0.05 at 8, 11.3, 16 kHz, two-way ANOVA followed by Bonferroni post-test). (B) EP measurements in the same animals 2 hours after the 200mg/kg furosemide injection (**P=0.0014, t=5.376 and df=6.403 for wild-type and P=0.0053, t=6.932 and df=3.149 for homozygous mice, Student’s unpaired t-test with Welch’s correction). Baseline EPs were collected from the age-matched mice from Figure 3. (C) EP changes in both groups compared to the averaged baselines of non-treated controls younger than 20 weeks old. Homozygous mice had a significantly larger EP reduction than wild-type mice (*P= 0.0287, t=3.084, df=4.825, Student’s unpaired t-test with Welch’s correction).

Similar articles

Cited by

References

    1. Marazita ML, Ploughman LM, Rawlings B, Remington E, Arnos KS, Nance WE. Genetic epidemiological studies of early-onset deafness in the U.S. school-age population. Am J Med Genet. 1993; 46:486–91. 10.1002/ajmg.1320460504 - DOI - PubMed
    1. Fortnum HM, Summerfield AQ, Marshall DH, Davis AC, Bamford JM, Davis A, Yoshinaga-Itano C, Hind S. Prevalence of permanent childhood hearing impairment in the United Kingdom and implications for universal neonatal hearing screening: questionnaire based ascertainment study. BMJ. 2001; 323:536–40. 10.1136/bmj.323.7312.536 - DOI - PMC - PubMed
    1. Morton CC, Nance WE. Newborn hearing screening-a silent revolution. N Engl J Med. 2006; 354:2151–64. 10.1056/NEJMra050700 - DOI - PubMed
    1. Kelsell DP, Dunlop J, Stevens HP, Lench NJ, Liang JN, Parry G, Mueller RF, Leigh IM. Connexin 26 mutations in hereditary non-syndromic sensorineural deafness. Nature. 1997; 387:80–83. 10.1038/387080a0 - DOI - PubMed
    1. Zelante L, Gasparini P, Estivill X, Melchionda S, D'Agruma L, Govea N, Mila M, Monica MD, Lutfi J, Shohat M, Mansfield E, Delgrosso K, Rappaport E, et al.. Connexin26 mutations associated with the most common form of non-syndromic neurosensory autosomal recessive deafness (DFNB1) in Mediterraneans. Hum Mol Genet. 1997; 6:1605–09. 10.1093/hmg/6.9.1605 - DOI - PubMed

Publication types

LinkOut - more resources