. 2019 Sep 27;10(1):4407.
doi: 10.1038/s41467-019-12307-1.

Urothelial organoids originating from Cd49fhigh mouse stem cells display Notch-dependent differentiation capacity

Affiliations

Urothelial organoids originating from Cd49fhigh mouse stem cells display Notch-dependent differentiation capacity

Catarina P Santos et al. Nat Commun. .

Abstract

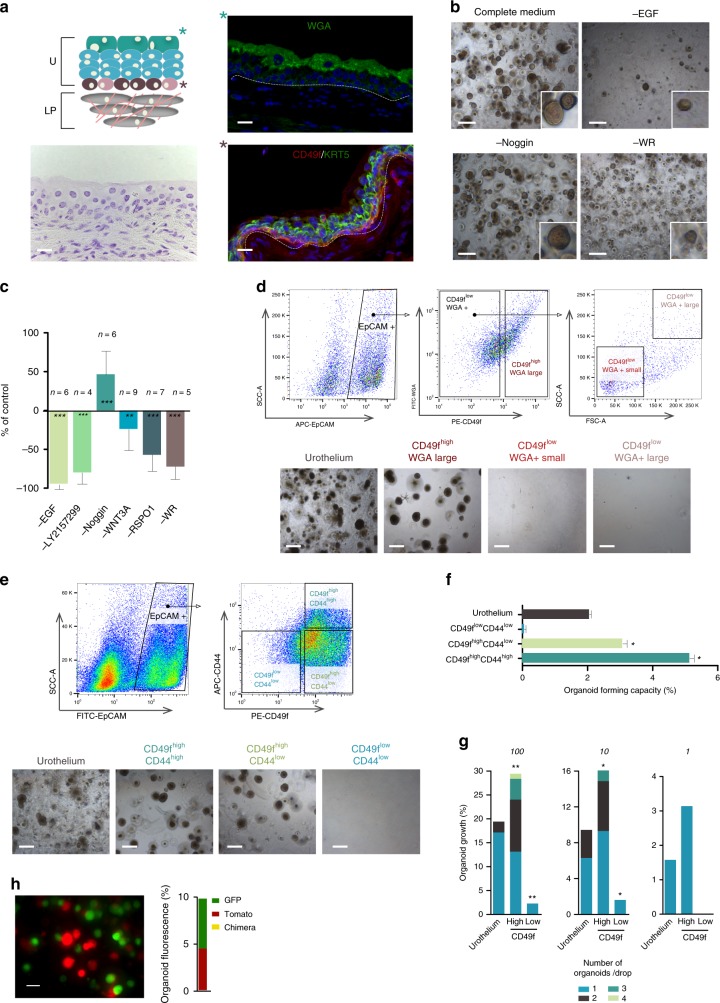
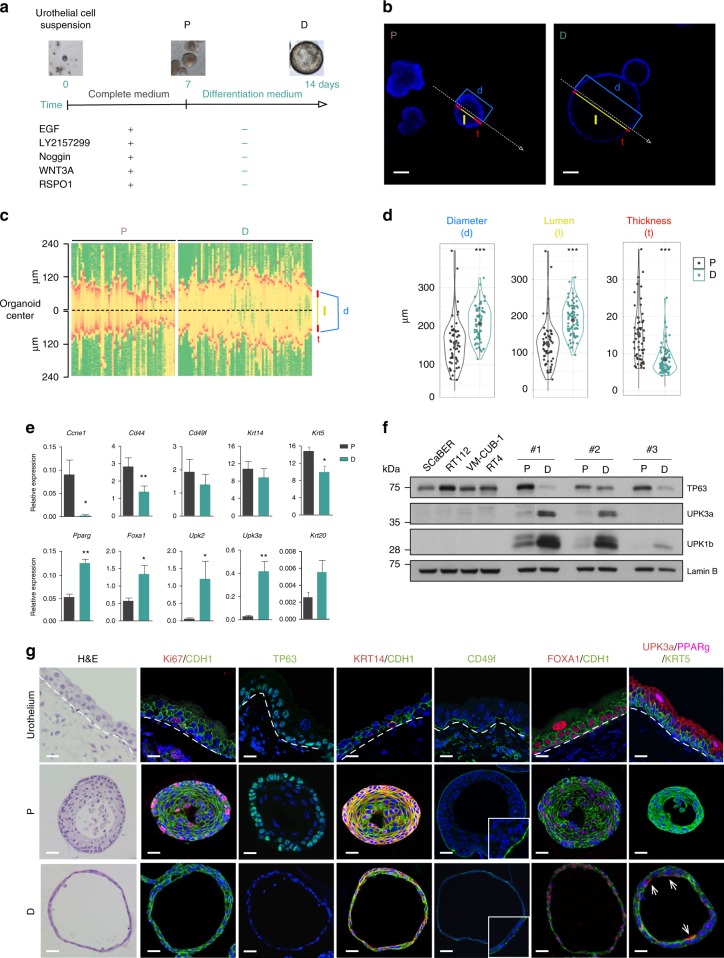
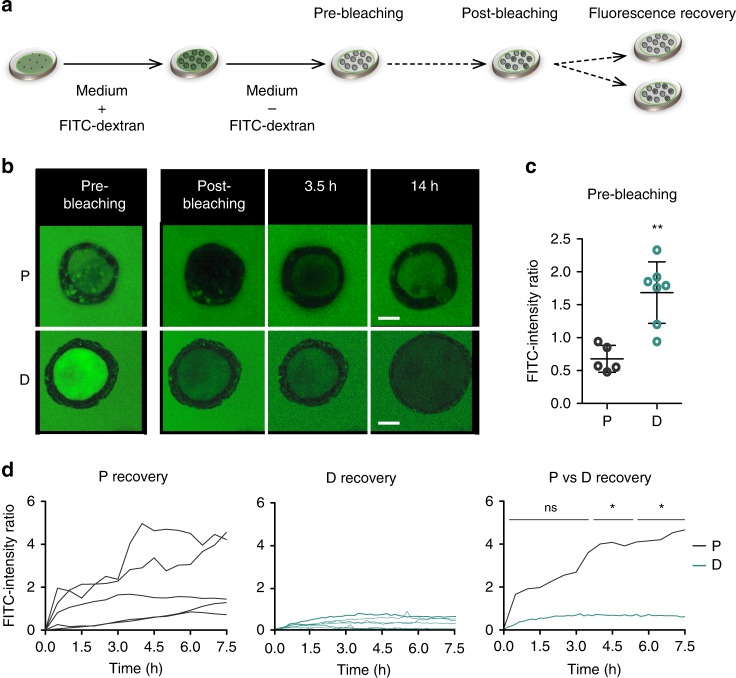
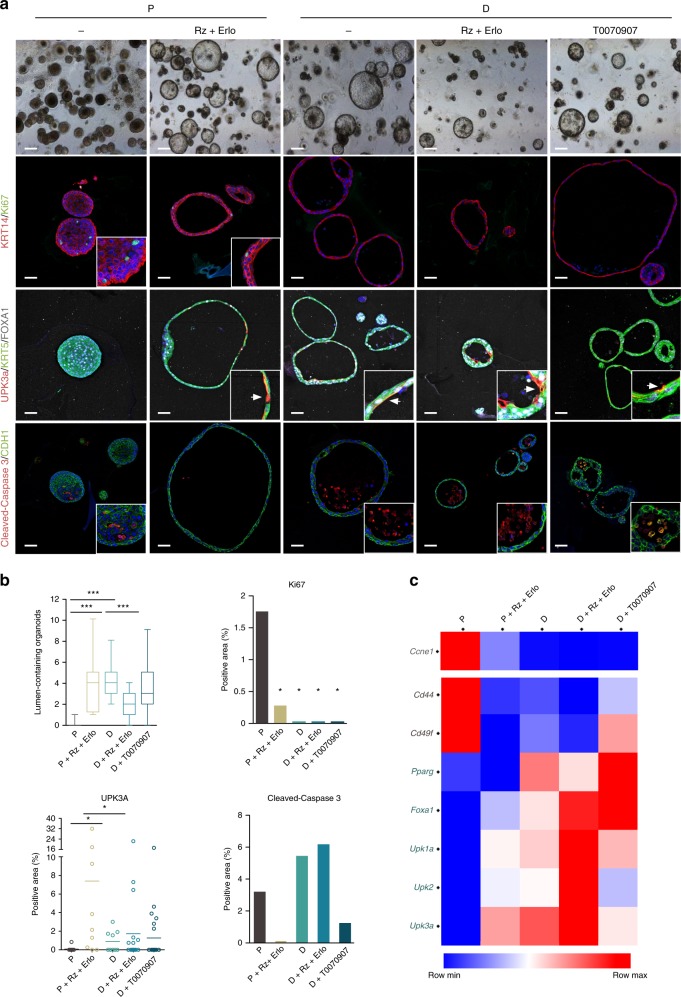
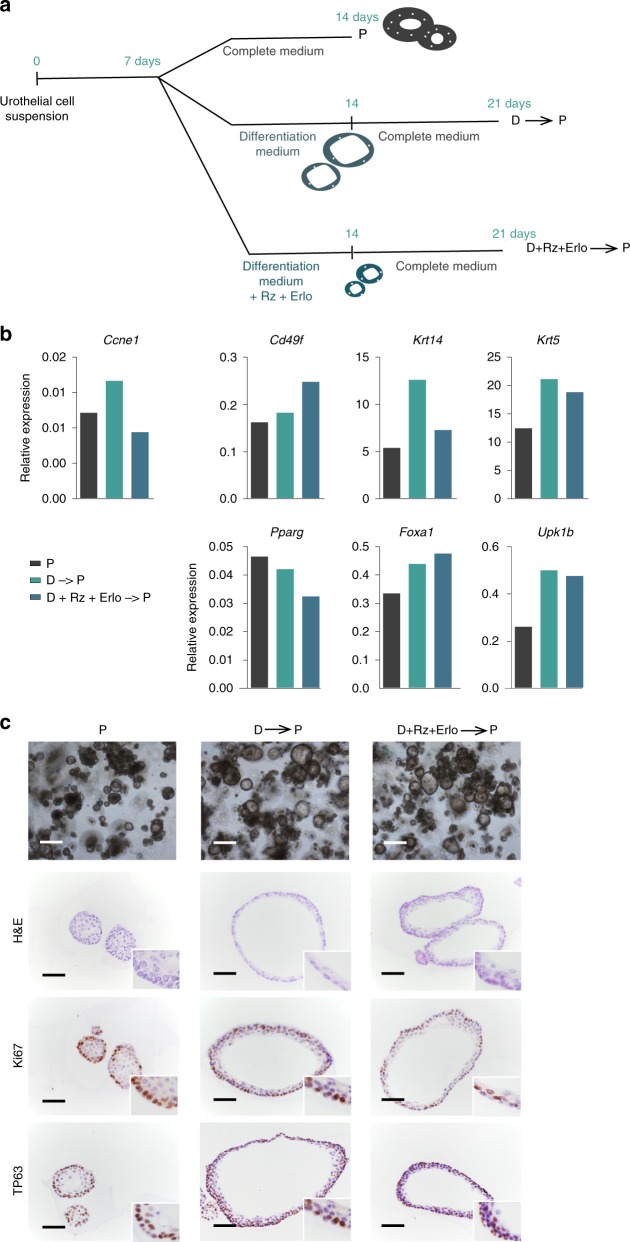
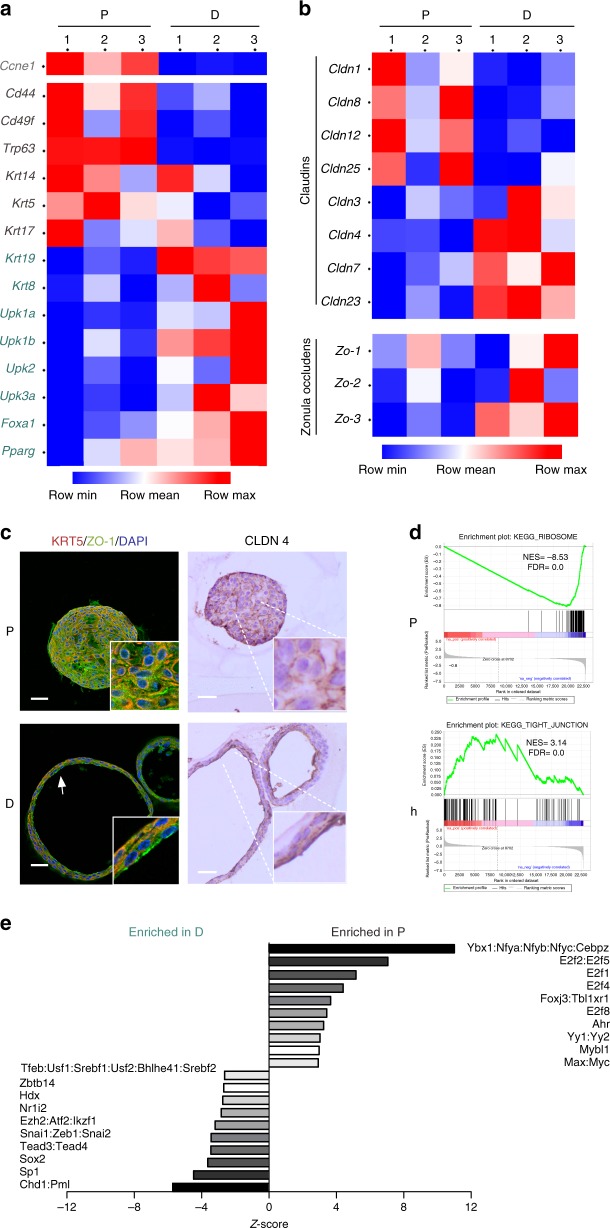
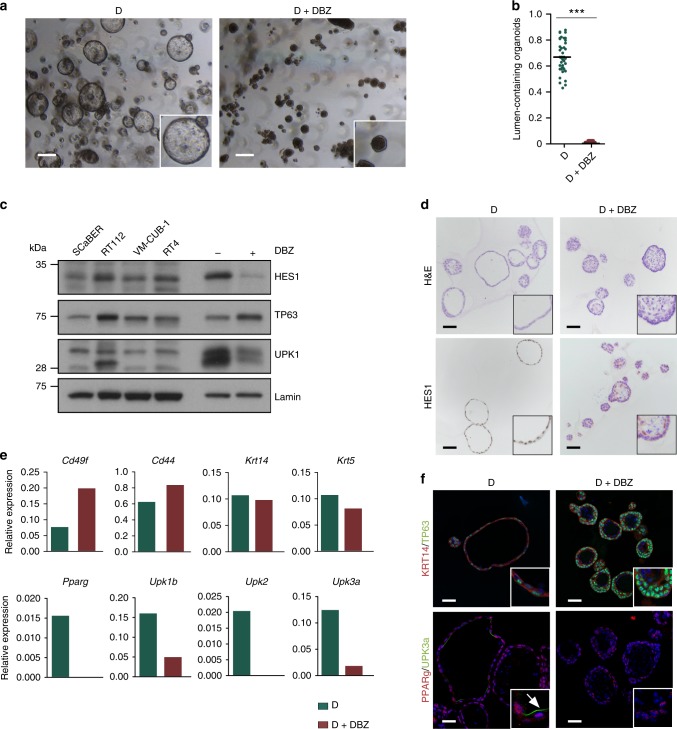
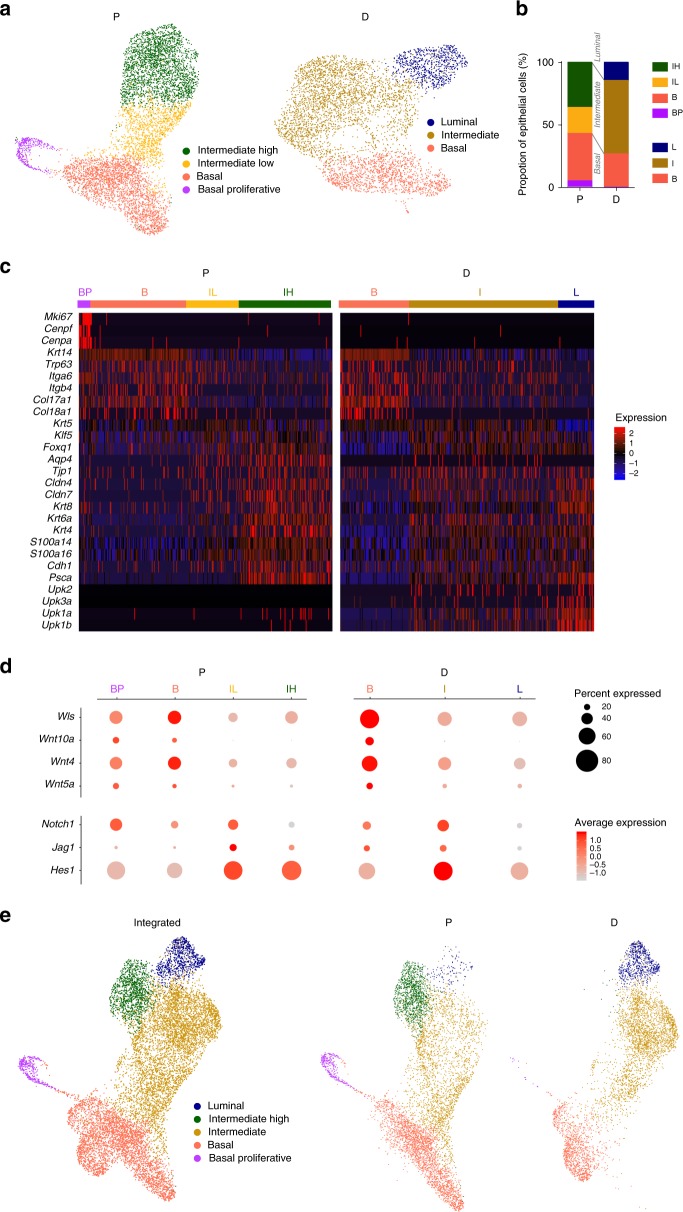
Understanding urothelial stem cell biology and differentiation has been limited by the lack of methods for their unlimited propagation. Here, we establish mouse urothelial organoids that can be maintained uninterruptedly for >1 year. Organoid growth is dependent on EGF and Wnt activators. High CD49f/ITGA6 expression features a subpopulation of organoid-forming cells expressing basal markers. Upon differentiation, multilayered organoids undergo reduced proliferation, decreased cell layer number, urothelial program activation, and acquisition of barrier function. Pharmacological modulation of PPARγ and EGFR promotes differentiation. RNA sequencing highlighted genesets enriched in proliferative organoids (i.e. ribosome) and transcriptional networks involved in differentiation, including expression of Wnt ligands and Notch components. Single-cell RNA sequencing (scRNA-Seq) analysis of the organoids revealed five clusters with distinct gene expression profiles. Together, with the use of γ-secretase inhibitors and scRNA-Seq, confirms that Notch signaling is required for differentiation. Urothelial organoids provide a powerful tool to study cell regeneration and differentiation.


Conflict of interest statement

The authors declare no competing interests.

Figures

Fig. 1
Fig. 1
CD49f labels an organoid-forming urothelial cell population with stem cell features. a Urothelial cyto-organization highlighting the three cell layers: basal (CD49f and KRT5), intermediate (KRT5), and luminal (WGA-binding) markers. U, urothelium; LP, lamina propria (scale bar, 50 μm). Color code for the scheme: brown, basal; pink, basal-proliferative; blue, intermediate; green, umbrella. b Representative images of organoids from low-passage urothelial cell suspensions embedded in Matrigel in complete medium (upper left). The remaining panels correspond to the leave-one-out experiments (see panel c) (scale bar, 500 μm). c Quantification of organoid growth in leave-one-out experiments (WR condition: WNT3A and RSPO1 were omitted). Number of organoids normalized to complete medium; error bars indicate SEM. d, e FACS plots depicting the analysis and isolation of fresh epithelial cells according to cell surface markers (EpCAM, CD49f, CD44, and WGA) and size (n = 2) (scale bar, 500 μm). f Quantification of the organoid-forming capacity of freshly isolated and sorted urothelial cells (100 cells/Matrigel drop) compared to the unsorted population (Urothelium); results from a representative experiment (n = 2); error bars indicate SEM. g Clonal growth capacity of freshly isolated urothelial cells FACS-sorted according to CD49f expression (CD49fhigh vs. CD49flow) and seeded at 1, 10, and 100 cells/Matrigel drop (n = 3). The proportion of Matrigel drops showing outgrowth (bars, Y-axis) and the number of organoids/drop (1, 2, 3, and 4; according to the color code) are shown. h Monoclonal origin of organoids established starting from a 1:1 mixture of EGFP- and mTomato-expressing cells (n = 2) (scale bar, 500 μm). ANOVA and Mann–Whitney tests were applied; *p ≤ 0.05, **p ≤ 0.01; ***p ≤ 0.001. Source data are provided as a Source Data file
Fig. 2
Fig. 2
Growth factor-depleted organoids recapitulate the urothelial differentiation program. a Experimental design applied to induce urothelial organoid differentiation: organoids cultured until day 7 in complete medium were maintained for seven additional days in differentiation medium. b Image of organoids displaying the features quantified in panel c: d, diameter; l, lumen; t, thickness of the epithelial layer. The signal distribution was measured across the organoids as indicated by the arrow in both cases (scale bar, 100 μm). c Signal distribution (in microns) acquired by confocal microscopy displaying the quantification of organoid features (diameter) of individual proliferative (P) (n = 57) and differentiated (D) (n = 71) organoids; color code indicates the intensity of the signal: green, low; yellow, intermediate; red, high. d Violin plots representing organoid features. e RT–qPCR analysis of expression of genes regulated during differentiation. Data are normalized to Hprt expression (Mann–Whitney test, error bars indicate SD). f Western blot (WB) analysis showing expression of TP63 (basal marker), UPK3a, and UPK1b (luminal markers) in P and D organoids in three independent experiments. Urothelial bladder cancer cell lines (ScaBER, RT112, VMCUB1, and RT4) were used as controls. g Immunofluorescence analysis of urothelial markers in P and D organoids. Normal urothelium is shown for comparison. DAPI staining is shown in blue (scale bar, 1000 μm). Source data are provided as a Source Data file
Fig. 3
Fig. 3
Organoids cultured in differentiated conditions are functionally competent and acquire barrier function. a Experimental design to assess barrier function in organoid cultures using FITC-dextran and fluorescence recovery after photobleaching (FRAP). b Example of P and D organoids during the FRAP assay (pre-bleaching, post-bleaching and recovery—3.5 and 14 h) (scale bar, 1000 μm). c Quantification of FITC-dextran intensity of P (n = 5) and D (n = 7) organoids in the pre-bleaching phase showing specific FITC-dextran retention in differentiated organoids (Mann–Whitney test, error bars indicate SD). d Fluorescence recovery in P (n = 5) (left) and D (n = 7) organoids (middle); mean fluorescence recovery in P vs D organoids (Mann–Whitney test, error bars indicate SD). *p ≤ 0.05, **p ≤ 0.01. Source data are provided as a Source Data file
Fig. 4
Fig. 4
Pharmacological modulation of EGFR and PPARγ activity potentiates organoid differentiation. a Representative phase contrast and immunofluorescence images of proliferative (P) and differentiated (D) organoids cultured in the presence of drugs modulating PPARγ (Roziglitazone, Rz) or EGFR activity (Erlotinib, Erlo) (scale bars: brightfield, 500 μm; immunofluorescence, 250 μm). b Quantification of lumen formation (Mann–Whitney test), Ki67, UPK3a, and cleaved-caspase-3 expression (Bonferroni test) in organoids cultured as described in panel a. c Heatmap representing RT–qPCR expression analysis of cell cycle and canonical urothelial differentiation markers in P or D organoids treated with Rz + Erlotinib, and with the PPARγ inverse agonist T0070907 (n = 2). *p ≤ 0.05, **p ≤ 0.01; ***p ≤ 0.001. Source data are provided as a Source Data file
Fig. 5
Fig. 5
Differentiated organoids are able to re-enter the cell cycle upon exposure to complete medium. a Experimental strategy: day 7 P organoids were maintained for 7 additional days either in complete medium (P), differentiation medium (D), or differentiation medium supplemented with Roziglitazone and Erlotinib (D + Rz + Erlo). D organoids were then switched to complete medium (D−P; D + Rz + Erlo−P) for 7 additional days. b RT–qPCR analysis of expression of genes regulated during differentiation. Data are normalized to Hprt expression (n = 1 biological replicate). c Representative phase contrast images of organoid cultures (scale bar, 500 μm), H&E staining, and immunohistochemistry for Ki67, TP63, and UPK3a (n = 1 biological replicate) (scale bar, 250 μm). Source data are provided as a Source Data file
Fig. 6
Fig. 6
Transcriptome analysis reveals organoid differentiation and identifies pathways involved therein. a Heatmap showing the expression (FPKM, RNAseq) of key urothelial differentiation genes in P and D organoids (n = 3/group; paired samples). b Heatmap showing the expression of genes related to tight junctions (claudins and tight junction/Zo proteins) (FPKM) in P and D organoids (n = 3/group). c Immunofluorescence analysis of the expression of ZO-1 and KRT5; immunohistochemical analysis of CLDN4 in the same samples; L (Lumen) (scale bar, 250 μm). d Enrichment plots showing the upregulation of ribosome pathway genes and the downregulation of tight junction component genes in P organoids. e ISMARA analysis of top transcription factor motifs (ranked by z-scores) significantly enriched in the promoters of genes differentially expressed in P vs. D organoids; for the z-score of motifs enriched in D organoids. Source data are provided as a Source Data file
Fig. 7
Fig. 7
Notch pathway inhibition prevents the differentiation of urothelial organoids. a Phase contrast images of D organoids cultured in the presence of the γ-secretase inhibition (n = 4) (scale bar, 500 μm). b Quantification of the effects of DBZ on lumen formation (Mann–Whitney test). c Western blot analysis showing the expression of TP63 (basal marker), UPK3a, and UPK1b (luminal markers). d H&E and HES1 expression in organoids treated with DBZ (scale bar, 250 μm). e RT–qPCR analysis of expression of Notch target genes, proliferation, and urothelial differentiation markers in D organoids treated with DBZ; results were normalized to Hprt expression. f Immunofluorescence highlighting TP63 upregulation and UPK3a donwregulation upon treatment with DBZ (scale bar, 250 μm). ***p ≤ 0.001. Source data are provided as a Source Data file
Fig. 8
Fig. 8
Single-cell RNAseq reveals distinct cell populations within P and D organoids. a Transcriptomic clusters in P (n = 6826 cells) and D (n = 4896 cells) organoids visualized using uniform manifold approximation and projection (uMAP) plots, colored according to cluster. b Proportion of cells from P and D organoids contributing to each of the clusters shown in panel a. c Heatmap depicting expression of selected cluster markers identified by differential expression analysis (Wilcoxon rank-sum test). d Dot plot depicting the expression of significantly differentially expressed genes from the Wnt and Notch signaling pathways in P and D organoids, according to cell clusters. e UMAP plots visualizing integrated analysis of cells from P and D organoids as a joint plot (left, n = 11722) or separate plots (P, center; D, right). For P organoids: B (Basal), BP (Basal-Proliferative), IL (Intermediate-Low) and IH (Intermediate-High); for D organoids: B (Basal), I (Intermediate), and L (Luminal). Source data are provided as a Source Data file

Similar articles

Cited by

References

    1. Papafotiou, G. et al. KRT14 marks a subpopulation of bladder basal cells with pivotal role in regeneration and tumorigenesis. Nat. Commun. 7, 11914 (2016). - PMC - PubMed
    1. Hicks RM. The structure of the transitional epithelium of rat ureter. J. Cell Biol. 1965;26:25–48. doi: 10.1083/jcb.26.1.25. - DOI - PMC - PubMed
    1. Ho PL, Kurtova A, Chan KS. Normal and neoplastic urothelial stem cells: getting to the root of the problem. Nat. Rev. Urol. 2012;9:583–594. doi: 10.1038/nrurol.2012.142. - DOI - PMC - PubMed
    1. Wu X-R, Manabe M, Jun Y, Sun T-T. Large scale purification and immunolocalization of bovine uroplakins I, II, and III. J. Biol. Chem. 1990;265:19170–19179. - PubMed
    1. Apodaca G. The uroepithelium: not just a passive barrier. Traffic. 2004;5:117–128. doi: 10.1046/j.1600-0854.2003.00156.x. - DOI - PubMed

Publication types

MeSH terms