. 2019 Sep 27;10(1):4402.
doi: 10.1038/s41467-019-11879-2.

Dynamic changes in epithelial cell morphology control thymic organ size during atrophy and regeneration

Affiliations

Dynamic changes in epithelial cell morphology control thymic organ size during atrophy and regeneration

Thomas Venables et al. Nat Commun. .

Abstract

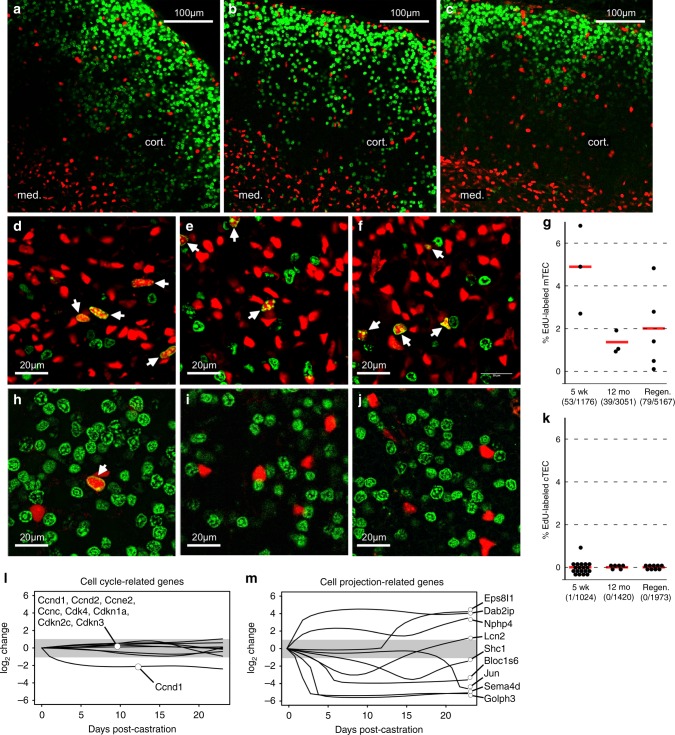
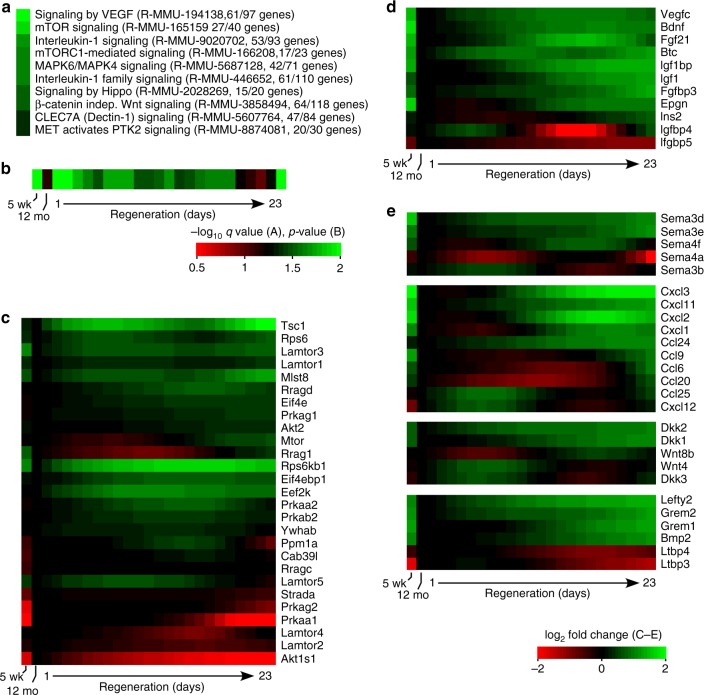
T lymphocytes must be produced throughout life, yet the thymus, where T lymphocytes are made, exhibits accelerated atrophy with age. Even in advanced atrophy, however, the thymus remains plastic, and can be regenerated by appropriate stimuli. Logically, thymic atrophy is thought to reflect senescent cell death, while regeneration requires proliferation of stem or progenitor cells, although evidence is scarce. Here we use conditional reporters to show that accelerated thymic atrophy reflects contraction of complex cell projections unique to cortical epithelial cells, while regeneration requires their regrowth. Both atrophy and regeneration are independent of changes in epithelial cell number, suggesting that the size of the thymus is regulated primarily by rate-limiting morphological changes in cortical stroma, rather than by their cell death or proliferation. Our data also suggest that cortical epithelial morphology is under the control of medullary stromal signals, revealing a previously unrecognized endocrine-paracrine signaling axis in the thymus.


Conflict of interest statement

The authors declare no competing interests.

Figures

Fig. 1
Fig. 1
Changes in cell morphology genes dominate the regeneration response. a Summary of 136 microarrays collected during castration-induced regrowth of the age atrophied thymus, mapped onto a regression curve of organ size over time (see text). An additional 20 microarrays from young thymus, 5 for each cell/tissue type, are not indicated (because they are off the time scale), representing a total of 156 microarrays used for this study. Each tissue:lymphoid pair also provides a deconvolved stromal signature (78 total) used for subsequent analysis. b General workflow of steps in the deconvolution of stromal gene expression. c A network map of the top 5 GO:BP categories (200 genes or fewer) indicates a strong bias in cortical stroma towards dynamically regulated genes associated with cell projection morphology. Connections between hubs indicate shared genes. d Mapping of deconvolved thymic stromal transcriptomes onto GO categories related to cell projection (and containing at least 10 total genes). The heat map shows the change in statistical significance (i.e., change in Fisher exact test p value) over time of regeneration, normalized to day 0. There is a negative enrichment of negative regulators early, and a positive enrichment of positive regulators late, further supporting the prediction from non-presumptive analysis that changes in cell shape may play a significant role in the regeneration response
Fig. 2
Fig. 2
cTEC exhibit a unique morphology that fluctuates during aging and regeneration. Data are from Foxn1[Cre]+ Rosa26[Confetti]+ thymuses. Blue = Cfp, green = Yfp, red = Rfp. Mouse age was: af, 5 weeks, gi, 12 months, and j is peak regenerated. Comparable panels (e.g., a, i, j) were processed identically. 3D renderings can be found in Supplementary Movies 2–4. a Maximum Z projection of a 40 µm optical stack (the approximate transverse depth of a single cTEC) at 5 weeks. b Zoomed view of the cortex (6 µm Z projection), revealing distinctions between individual cells, in contrast to c, which is conventional cTEC marker expression (Krt8) in the same stack. Scale bar in b also applies to cd Orthogonal views of a typical cTEC, revealing looping structures forming a complex labyrinth of intracellular voids filled by lymphoid cells (e), as indicated by Thy-1 staining (gray) or DAPI staining (inset, blue). f 2D representation of the interface between two cTEC, showing that most contact occurs via abutment of looping structures, rather than synapses. g Maximum Z projection of a 40 µm-thick optical stack from a 12-month-old mouse. Confetti detection is obscured by autofluorescent pigments associated with aging, but these can be imaged independently (h), and thus subtracted (i; see also Supplementary Fig. 2). Scale bar in g also applies to h and i. Inset in h is at 20× magnification. cTEC in the aged thymus (i) are much less conspicuous than in young (a), reflecting both contraction of total cell dimensions (km) and thinning of the remaining projections. j 40 µm Z projection from a 12-month-old mouse on the peak of regeneration (day 20). Confetti intensity is much more robust than in the aged thymus (j), but is not restored to the status of the young (a), with some cells retaining an aged phenotype (atrophic), while others are abnormally large. km measurement of relevant physical parameters in cTEC, such as total surface area, feret diameter, or cell volume. Brackets indicate statistical significance (two-tailed t test, p value < 0.05). n = 3 biologically independent tissues each for 5 weeks, 12 months, and regenerated groups. Source data are provided in the accompanying Source Data File
Fig. 3
Fig. 3
mTEC exhibit a broad spectrum of shapes that change little during atrophy. a A maximum Z projection (2.5 µm thickness) of medulla from a young (5 weeks) Confetti thymus, stained with a conventional mTEC marker (Epcam). Note that individual cells cannot be distinguished. b Confetti fluorescent proteins (mCfp, cYfp, and cRfp) in the same tissue volume, showing clear distinction of individual cells and their shapes. Scale bar in a also applies to bc 3D projection of a 25 µm-thick stack of one color channel (cYfp) from the young Confetti medulla, with individual cells labeled by a random palette. d Orthogonal projections of the 3D distribution of mTEC shapes from young (red) or old (blue) mice. At least 1000 objects are shown for each age. Dark colors indicate 10% probability limits, light colors show 90% probability limits, and the remaining events are shown as individual dots. An overlapping (between young and old) unimodal distribution is found, but with a broad diversity of shapes (eg), ranging from larger and extensively branched to smaller and non-branched morphologies
Fig. 4
Fig. 4
cTEC density increases with atrophy, indicating contraction of cell size without changing in number. a, b Wide area view of thymus from 5 week or 12-month-old mice (respectively) in which an H2b:mCherry fusion protein is conditionally activated in all cells of the TEC lineage. Images represent a maximum Z projection of an optical slice with thickness equal to the average feret diameter of one TEC nuclei (~11 µm). Paired images were acquired and processed identically. Regions indicated by dashed lines are shown in panels c and d. Consistent with this visual assessment and the contraction of cTEC projections by the Confetti reporter, measurement of TEC density shows that cTEC density increases dramatically with age, while mTEC density is not significantly changed (e and f, respectively; statistical significance calculated by two-tailed t test). Data indicate total nuclei per image volume from at least 3 independent thymuses of each type, with each thymus represented by one or more distinct image volumes until large numbers of nuclei were counted. Total events counted were 5060 (young cortex), 3567 (aged cortex), 17,097 (young medulla), or 10,176 (aged medulla). Boxes represent the interquartile range with the median indicated by a horizontal line; whiskers indicate the full range. Source data are provided in the accompanying Source Data File
Fig. 5
Fig. 5
Regeneration of the cortex occurs independently of cTEC proliferation. a Wide area view of a single optical plane of thymus from a 5-week-old mouse in which H2b:mCherry (red) was conditionally activated in TEC by Foxn1[Cre], 1 h after a single injection of the thymidine analog 5-ethnyl-2′-deoxyuridine (EdU, green). EdU+ nuclei are not obvious in the deeper tissue because display levels are limited by the intense staining of cortical lymphoblasts, but they are nonetheless found throughout the organ. b, c Similar wide area views from 12 month thymuses, or thymuses from 12-month mice at the midpoint of regrowth (day 14 post-castration), respectively. df Higher magnification views of the medulla in thymus from 5 weeks, 12 months, or regeneration day 14. Edu+ mTEC nuclei are readily detectable (arrows) in all tissues, although the frequency does decrease with age (g), a feature that does not change after regeneration. Data points represent the percentage of labeled nuclei in individual image volumes from three biologically independent thymuses for each sample type (young, aged, regenerated). Red bars indicate the mean of these percentages. Numbers below sample types indicate pooled EdU+ nuclei/pooled total nuclei for each sample type. hj Similar analysis of the cortex in the same order of appearance. A single Edu+ cTEC was found out of 1024 nuclei that were formally counted in multiple volumes from at least 3 tissues) (h, k); many more volumes were examined (but not formally counted) without finding additional labeled cells. No labeled nuclei were found in cTEC from 12 months or regenerating thymus showing that tissue regeneration does not correlate with an increase in cTEC proliferation. l Consistent with the near absence EdU labeling in cTEC, genes associated with cell cycle do not fluctuate during castration-induced regeneration; only one of these (cyclin b1) exhibits a 2-fold or greater change (indicated in gray) during induced regrowth. m For comparison, an equal number of dynamically regulated genes found within the cell projection ontologies (see Fig. 1). Source data are provided in the accompanying Source Data File
Fig. 6
Fig. 6
Pathways regulating cell size or shape suggest control of cTEC morphology by medullary ligands. ac Representation of data from cortical stroma, while d, e derive from medullary stroma. ce Normalized to the 12-month-old untreated thymus, which also represents day 0 of the regeneration sequence. a The top 10 Reactome signaling pathways (sorted by hypergeometric q value) mapping to genes expressed by cortical stroma. Reactome pathway designations, and the number of genes expressed in thymic stromal cells vs. the total genes in the pathway, are shown in parentheses. Note that 3 of the top 4 pathways impact mTor signaling, making mTor a prime candidate for changes in cTEC morphology during aging and regeneration. b Change in representation (determined by the Fisher exact test) of the mTor pathway in cortical stroma during atrophy and regeneration. c Dynamics of mTor pathway genes in cortical stroma during atrophy and regeneration. d Dynamic regulation of mTor-activating ligands by medullary stroma; particularly notable are Igf1 and Fgf21. e Medullary stroma also dynamically regulate other classical paracrine mediators of cell growth and morphology, including members of the Sema, chemokine, Wnt, and Tgfb signaling pathways. Source data are provided in Supplementary Data 1

Similar articles

Cited by

References

    1. Foss DL, Donskoy E, Goldschneider I. The importation of hematogenous precursors by the thymus is a gated phenomenon in normal adult mice. J. Exp. Med. 2001;193:365–374. doi: 10.1084/jem.193.3.365. - DOI - PMC - PubMed
    1. Takahama Y, Ohigashi I, Baik S, Anderson G. Generation of diversity in thymic epithelial cells. Nat. Rev. Immunol. 2017;17:295–305. doi: 10.1038/nri.2017.12. - DOI - PubMed
    1. Abramson J, Anderson G. Thymic epithelial cells. Annu. Rev. Immunol. 2017;35:85–118. doi: 10.1146/annurev-immunol-051116-052320. - DOI - PubMed
    1. Petrie HT, Zúñiga-Pflücker JC. Zoned out: functional mapping of stromal signaling microenvironments in the thymus. Annu. Rev. Immunol. 2007;25:649–679. doi: 10.1146/annurev.immunol.23.021704.115715. - DOI - PubMed
    1. Klug DB, et al. Interdependence of cortical thymic epithelial cell differentiation and T-lineage commitment. Proc. Natl Acad. Sci. USA. 1998;95:11822–11827. doi: 10.1073/pnas.95.20.11822. - DOI - PMC - PubMed

Publication types

LinkOut - more resources