. 2019 Sep 27;10(1):4394.
doi: 10.1038/s41467-019-12277-4.

Quantification of porosity in extensively nanoporous thin films in contact with gases and liquids

Affiliations

Quantification of porosity in extensively nanoporous thin films in contact with gases and liquids

Netanel Shpigel et al. Nat Commun. .

Abstract

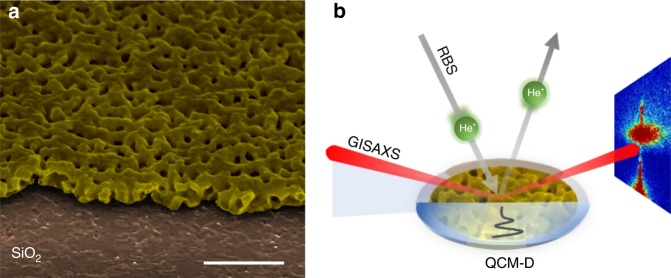
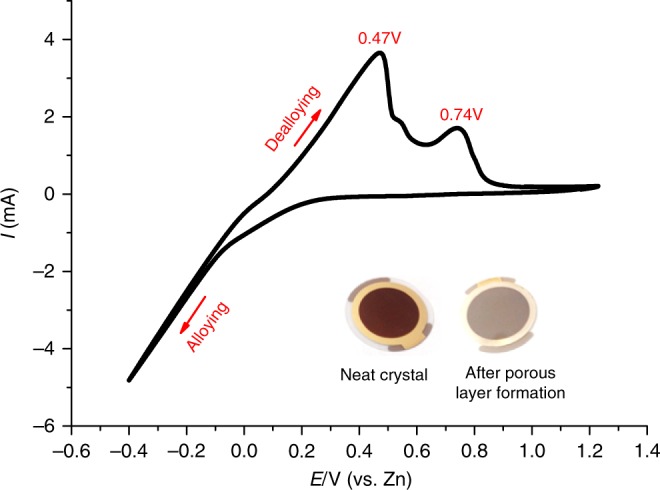
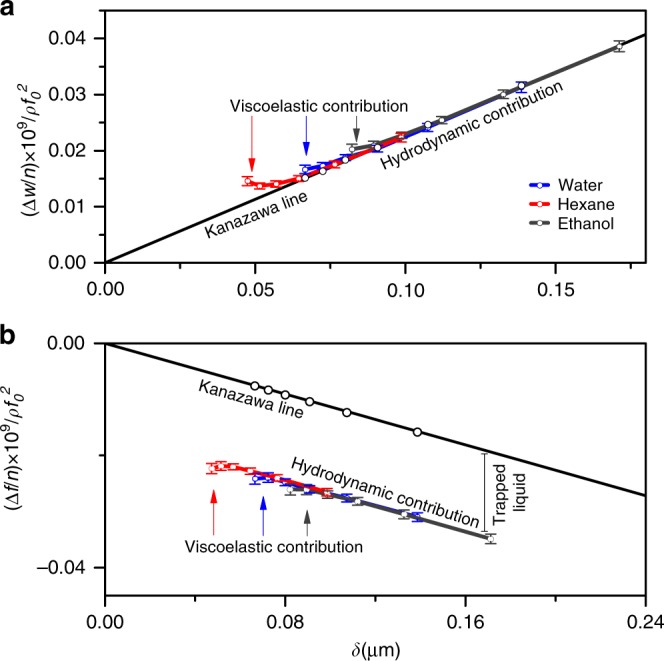
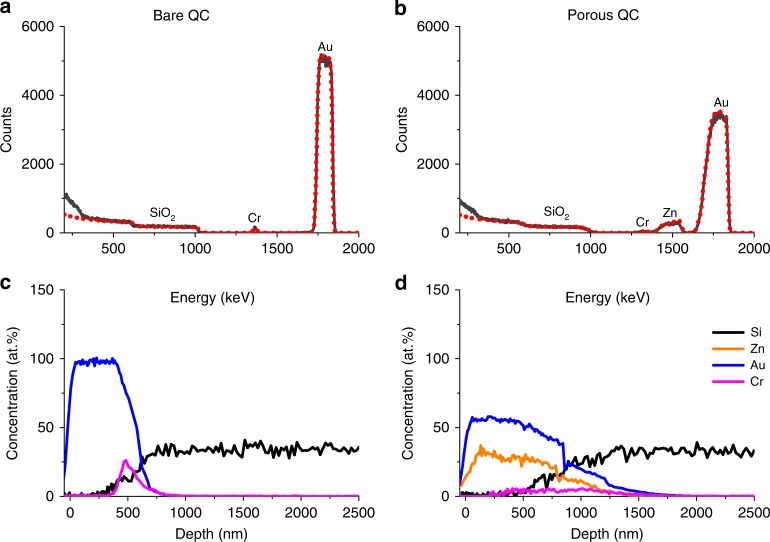
Nanoporous layers are widely spread in nature and among artificial devices. However, complex characterization of extensively nanoporous thin films showing porosity-dependent softening lacks consistency and reliability when using different analytical techniques. We introduce herein, a facile and precise method of such complex characterization by multi-harmonic QCM-D (Quartz Crystal Microbalance with Dissipation Monitoring) measurements performed both in the air and liquids (Au-Zn alloy was used as a typical example). The porosity values determined by QCM-D in air and different liquids are entirely consistent with that obtained from parallel RBS (Rutherford Backscattering Spectroscopy) and GISAXS (Grazing-Incidence Small-Angle Scattering) characterizations. This ensures precise quantification of the nanolayer porosity simultaneously with tracking their viscoelastic properties in liquids, significantly increasing sensitivity of the viscoelastic detection (viscoelastic contrast principle). Our approach is in high demand for quantifying potential-induced changes in nanoporous layers of complex architectures fabricated for various electrocatalytic energy storage and analytical devices.


Conflict of interest statement

The authors declare no competing interests.

Figures

Fig. 1
Fig. 1
Schematic illustration of the proposed approach to assess porosity in nanolayers. a Typical structure of nanoporous Au-Zn alloy fabricated on the top of quartz crystal sensor (1 μm scale bar). The neat Au electrode was covered by 1 mm2 Kapton tape to form a non-alloyed surface for step measurement by AFM. b Graphical summary of all the presented porosity quantification techniques: the profile of the oscillation waves in liquid produced by the vibrating quartz sensor is represented by the black solid line. The GISAXS (grazing-incidence small-angle scattering) technique is represented by incident and scattered X-ray beams (red lines); the scattering pattern is shown at the right side of the figure. The RBS (Rutherford backscattering spectroscopy) method is illustrated by the projected and the backscattered He+ ions beams (gray arrows)
Fig. 2
Fig. 2
Formation of Au-Zn alloy on a QC surface. Cyclic voltammetry of electrodeposition/stripping process of Zn into/from the Au layer on the QC sensor. The inset shows images of the pristine sensor (before cycling) and Au-Zn nanolayer on the surface of the QC sensor (after cycling)
Fig. 3
Fig. 3
Characterization of the Au-Zn nanolayer morphology by SEM. Quartz crystal covered with non-porous Au (pristine neat crystal (a)) and nanoporous Au-Zn alloy (b), the latter also shown by its tilted image (c). The average profile of the nanoporous film measured by AFM is presented in d. Inset shows 3D morphological images of the scanned step
Fig. 4
Fig. 4
QCM-D hydrodynamic characterization of the porous alloy immersed in different liquids. Normalized ΔW/n and Δf/n changes are presented in a and b, respectively. The reference state is the QC covered by a porous Au layer measured in air. The straight lines reflect the hydrodynamic interactions between the external surface of the solid and the contacting liquids. The contribution of the trapped liquid into the frequency change in liquid is shown by the vertical bar. The viscoelastic contribution to the QCM-D response (i.e., the characteristic deviation of the responses from the straight lines) is seen only in the range of higher overtone orders (for further details, see the text and Supplementary Information Section 6). Error bars relate to standard errors calculated from four independent measurements
Fig. 5
Fig. 5
Determination of nanoporosity from the RBS spectra. The experimental and simulated spectra are shown by black and dashed red lines, respectively, for the nonporous sensor (a) and after the formation of a thin nanoporous layer (b). The elemental concentration as a function of probing depth for bare and porous sensors are shown in c and d, respectively

References

    1. Innocenzi P, Malfatti L. Mesoporous thin films: properties and applications. Chem. Soc. Rev. 2013;42:4198. doi: 10.1039/c3cs35377j. - DOI - PubMed
    1. Borenstein A, et al. Carbon-based composite materials for supercapacitor electrodes: a review. J. Mater. Chem. A. 2017;5:12653–12672. doi: 10.1039/C7TA00863E. - DOI
    1. Huang W, et al. Fast synthesis of porous NiCo2O4 hollow nanospheres for a high-sensitivity non-enzymatic glucose sensor. Appl. Surf. Sci. 2017;396:804–811. doi: 10.1016/j.apsusc.2016.11.034. - DOI
    1. Grill A, Gates SM, Ryan TE, Nguyen SV, Priyadarshini D. Progress in the development and understanding of advanced low k and ultralow k dielectrics for very large-scale integrated interconnects—state of the art. Appl. Phys. Rev. 2014;1:011306. doi: 10.1063/1.4861876. - DOI
    1. Katagiri K, Yamazaki S, Inumaru K, Koumoto K. Anti-reflective coatings prepared via layer-by-layer assembly of mesoporous silica nanoparticles and polyelectrolytes. Polym. J. 2015;47:190–194. doi: 10.1038/pj.2014.104. - DOI

Publication types