. 2019 Sep 27;10(1):4424.
doi: 10.1038/s41467-019-12379-z.

FIERY1 promotes microRNA accumulation by suppressing rRNA-derived small interfering RNAs in Arabidopsis

Affiliations

FIERY1 promotes microRNA accumulation by suppressing rRNA-derived small interfering RNAs in Arabidopsis

Chenjiang You et al. Nat Commun. .

Abstract

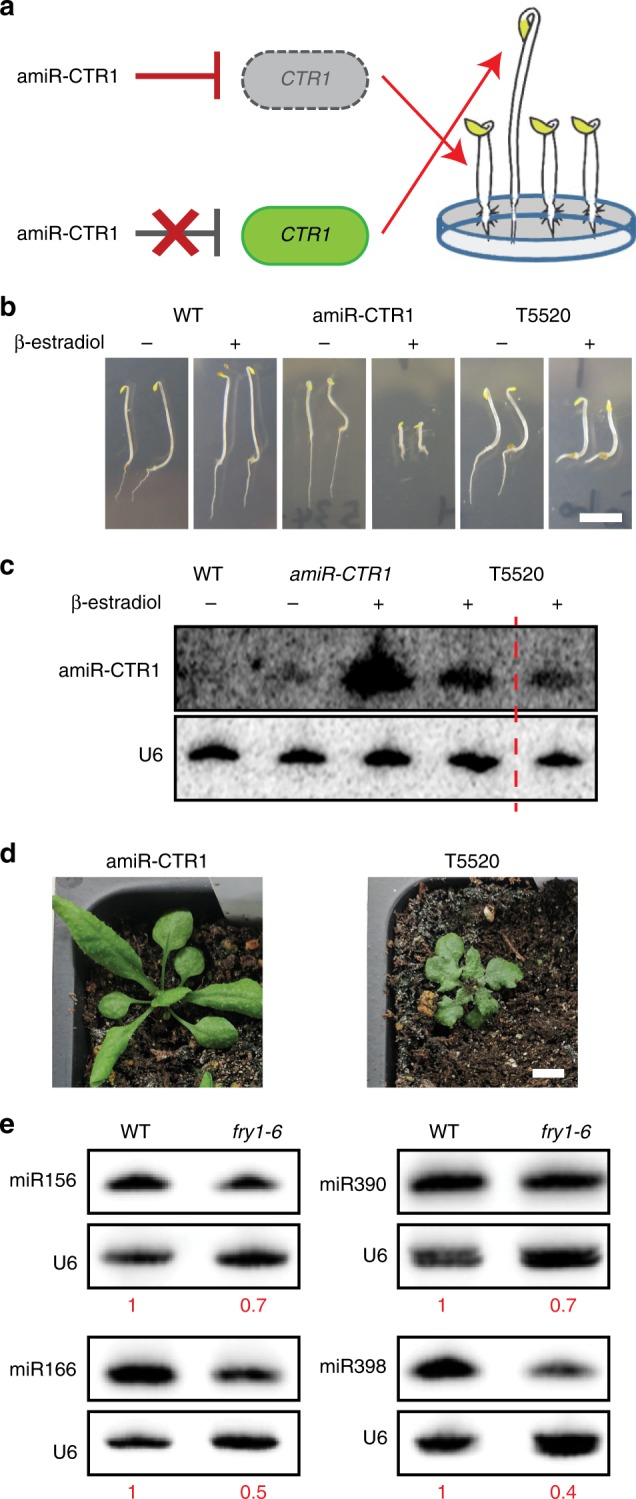
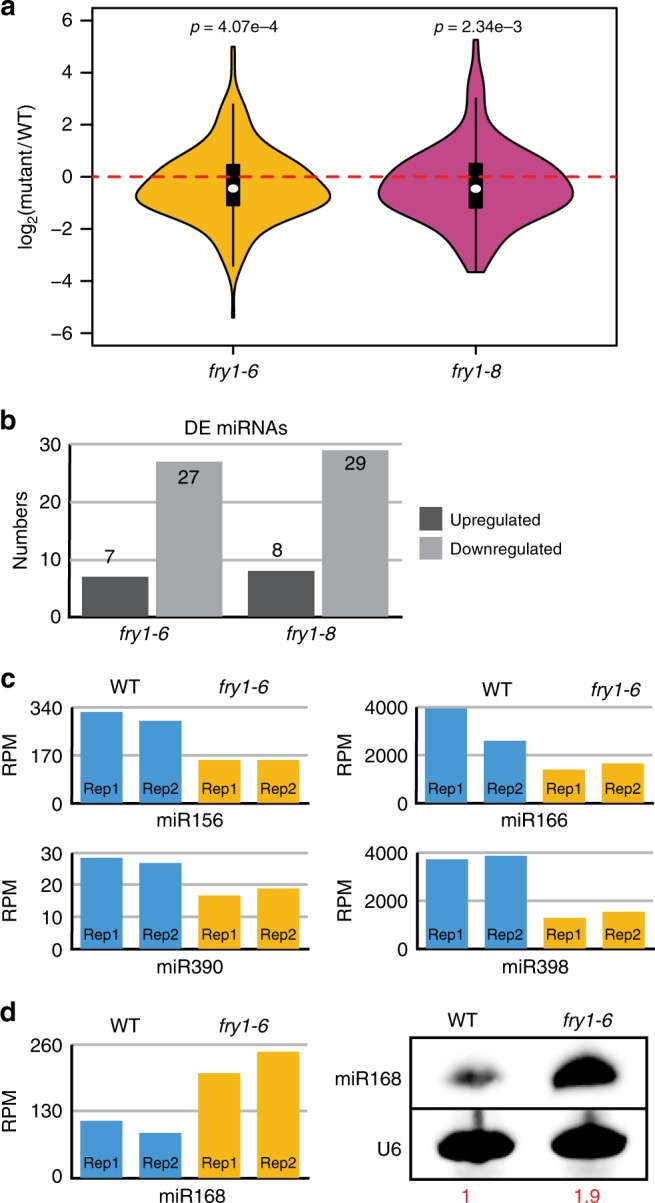
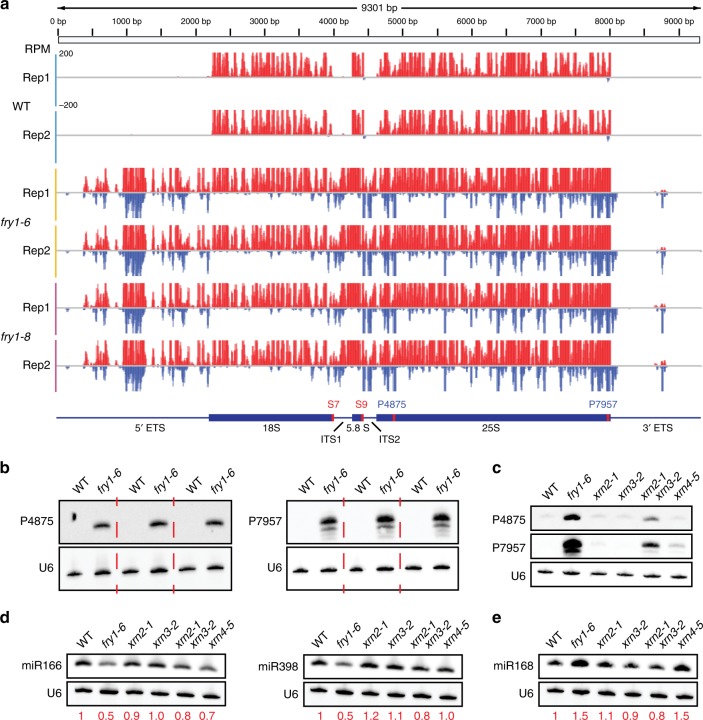
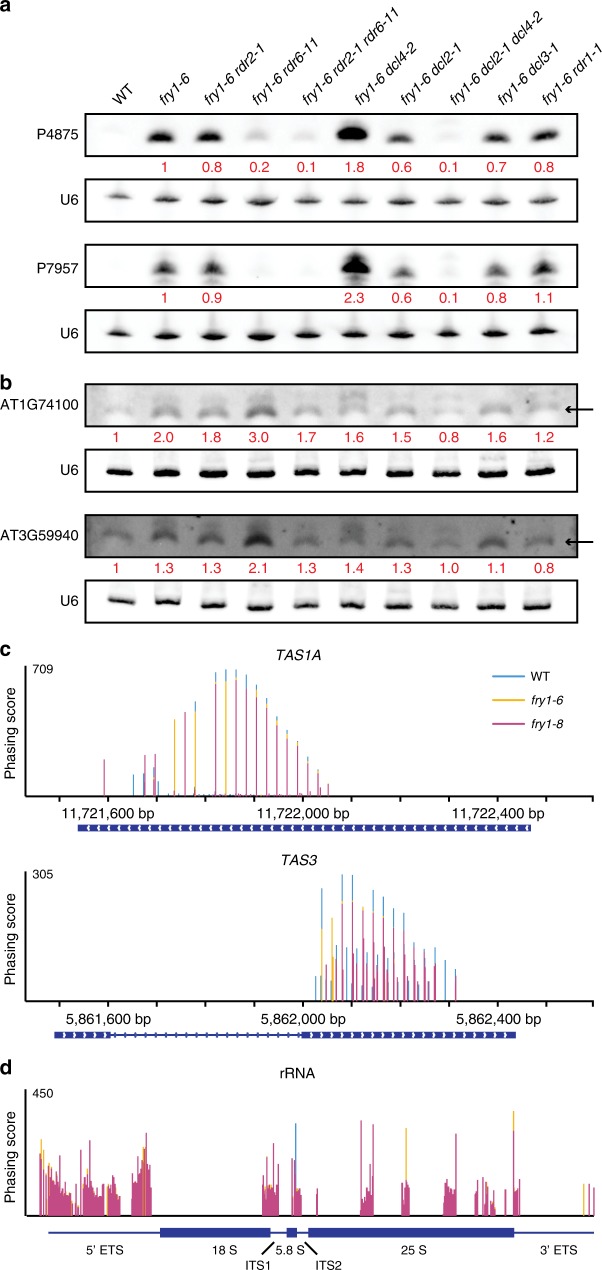
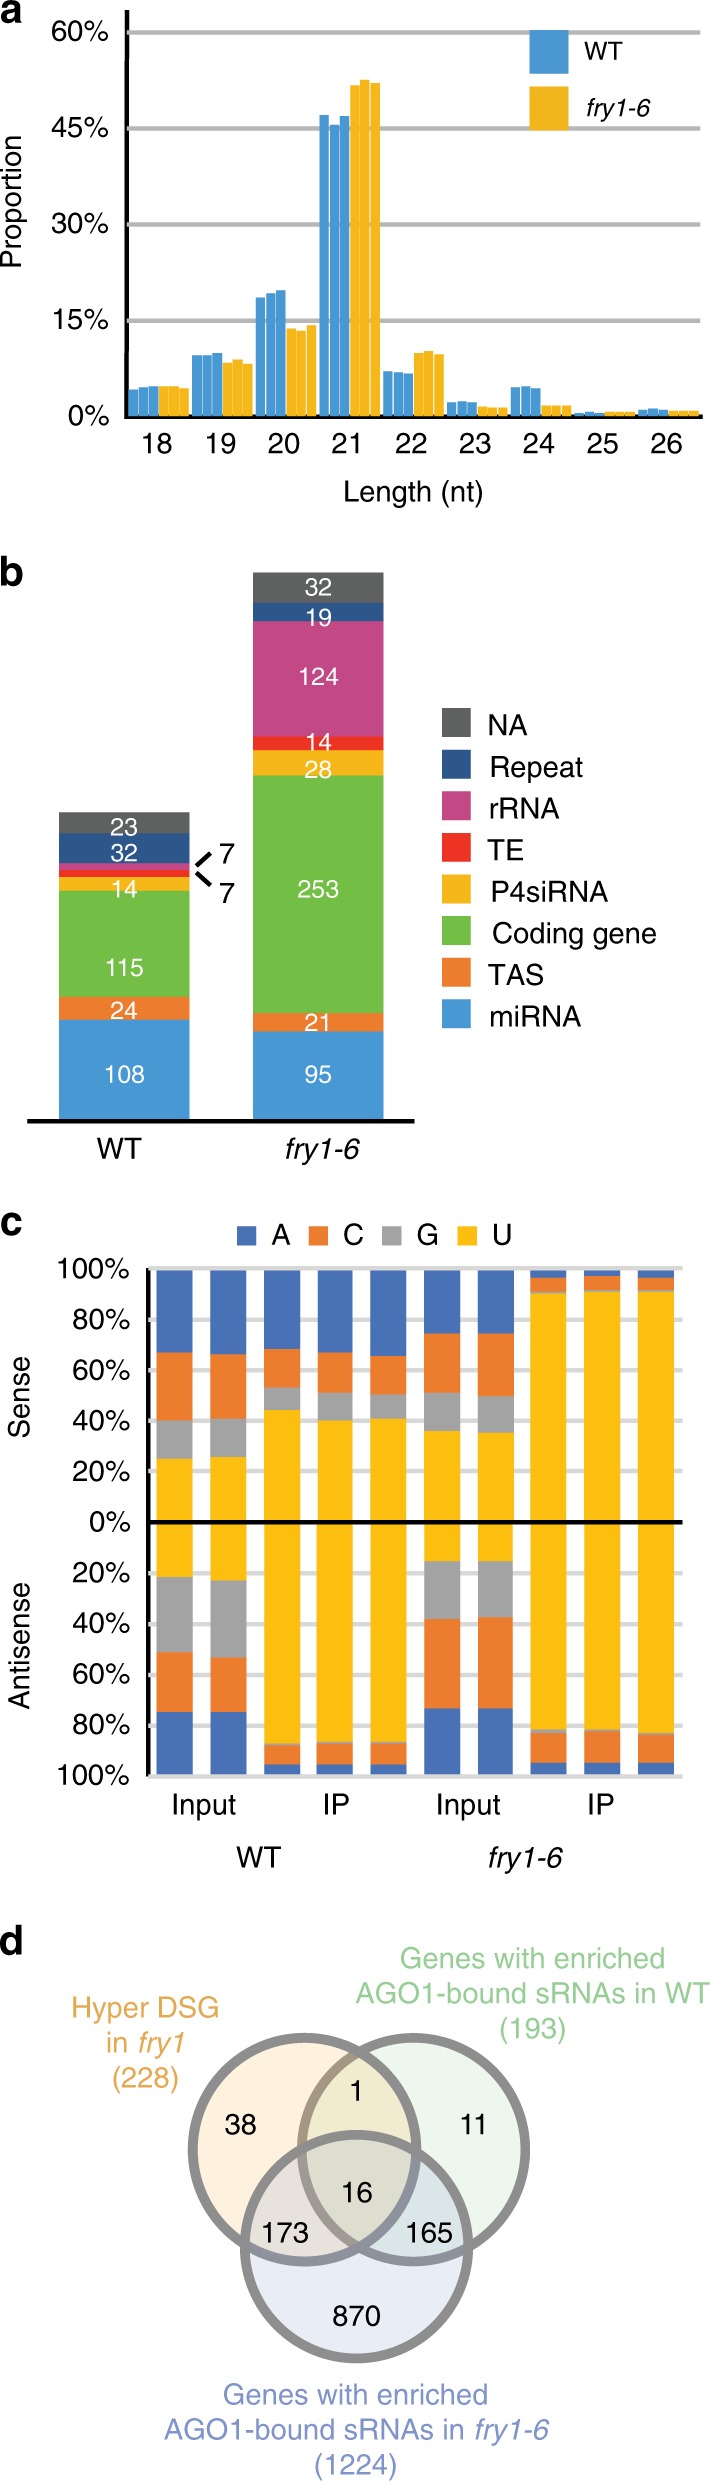
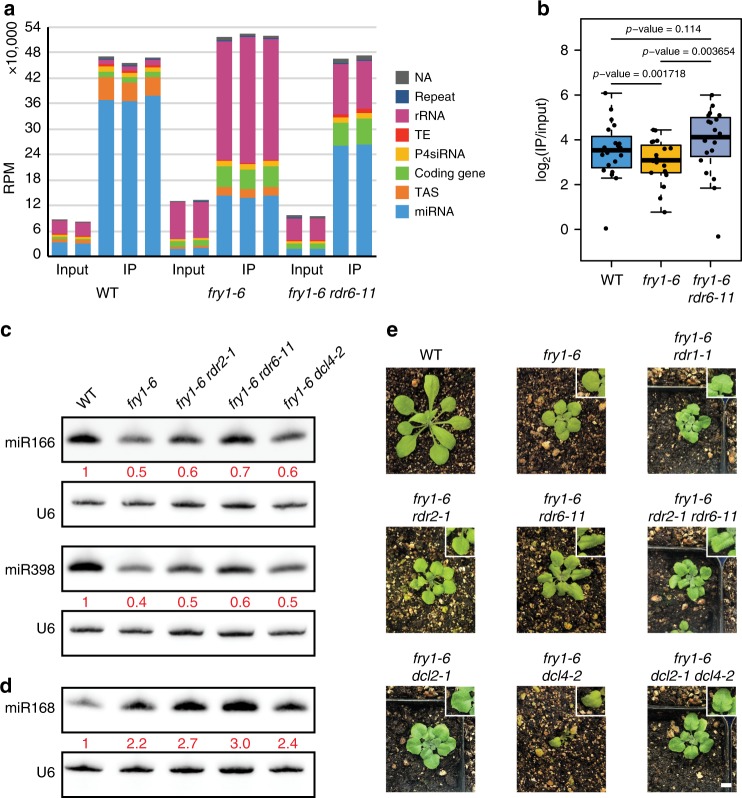
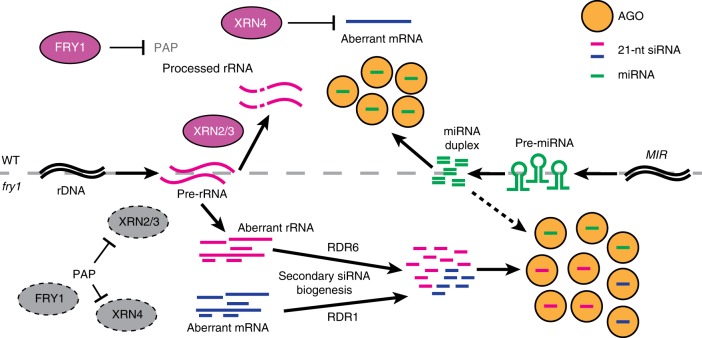
Plant microRNAs (miRNAs) associate with ARGONAUTE1 (AGO1) to direct post-transcriptional gene silencing and regulate numerous biological processes. Although AGO1 predominantly binds miRNAs in vivo, it also associates with endogenous small interfering RNAs (siRNAs). It is unclear whether the miRNA/siRNA balance affects miRNA activities. Here we report that FIERY1 (FRY1), which is involved in 5'-3' RNA degradation, regulates miRNA abundance and function by suppressing the biogenesis of ribosomal RNA-derived siRNAs (risiRNAs). In mutants of FRY1 and the nuclear 5'-3' exonuclease genes XRN2 and XRN3, we find that a large number of 21-nt risiRNAs are generated through an endogenous siRNA biogenesis pathway. The production of risiRNAs correlates with pre-rRNA processing defects in these mutants. We also show that these risiRNAs are loaded into AGO1, causing reduced loading of miRNAs. This study reveals a previously unknown link between rRNA processing and miRNA accumulation.


Conflict of interest statement

The authors declare no competing interests.

Figures

Fig. 1
Fig. 1
FRY1 promotes miRNA accumulation. a A diagram of the amiR-CTR1 reporter system. Mutations that disrupt miRNA biogenesis and/or function are expected to impair the regulation of CTR1 by amiR-CTR1 and, consequently, the “triple response” phenotype. b Phenotypes of 5-day-old Arabidopsis seedlings. Upon induction, amiR-CTR1 plants exhibited the ctr1 phenotype, whereas T5520 seedlings failed to show the ctr1 phenotype. Scale bar = 5 mm. c Detection of amiR-CTR1 in T5520. Upon β-estradiol induction, amiR-CTR1 strongly accumulated in amiR-CTR1 plants. However, the accumulation was compromised in T5520 (two biological replicates separated by the red dashed line). d Phenotype of T5520 without β-estradiol induction. T5520 plants were smaller than WT and had abnormal leaves. Scale bar = 5 mm. e RNA gel blot assay for endogenous miRNAs. All four miRNAs showed reduced accumulation in fry1-6. The U6 snRNA was used to determine the relative miRNA levels (as indicated by the numbers below the blots) between the two genotypes. Source data are provided as a Source Data file
Fig. 2
Fig. 2
Endogenous miRNAs are reduced in fry1 mutants. a Distribution of the fold changes for all detected miRNAs in fry1-6 and fry1-8 compared to WT. The black lines in each comparison represent the canonical “box” in a boxplot with the white dot showing the median value. The “violin” shape corresponds to the density of data. P values were calculated by a one-sample two-tailed Student’s t test. The t values are −3.5885 and −3.0781, respectively, and the df values are 227 for both comparisons. b Numbers of significantly differentially expressed (DE) miRNAs in fry1 mutants compared to WT. There are a large number of downregulated miRNAs in both fry1 alleles compared to WT. c Normalized read counts of miRNAs in Fig. 1e. Sequencing results (biological replicates are shown separately) of all four downregulated miRNAs, miR156, miR166, miR390, and miR398, are consistent with those from RNA gel blot assays. d RNA gel blot validation of upregulated miR168. The left panel shows the normalized read counts from sRNA-seq. The right panel shows the RNA gel blot for miR168 in fry1-6 compared to WT. The internal control U6 snRNA was used to determine the relative levels of miR168 in the gel blot assay. Source data are provided as a Source Data file
Fig. 3
Fig. 3
Accumulation of 21-nt sRNAs from coding gene loci in fry1. a Length distribution of mapped sRNA-seq reads from WT, fry1-6, and fry1-8 seedlings. The 24-nt peak in WT nearly disappeared in both fry1 mutants. The Y axis indicates the percentage of reads of different lengths among the total mapped sRNA reads (18–42 nt). b Genomic classification of 21-nt sRNAs in WT and both fry1 mutants. See d for legends. Read counts for miRNAs decreased, and those for sRNAs from rRNAs increased dramatically in fry1-6 and fry1-8. The annotation was adopted from known genome features. The Y axis shows the cumulative RPM values for sRNAs corresponding to different features. c Number of DSRs in fry1 mutants compared to WT. Only 21-nt and 24-nt data are shown. The 21-nt hyper DSRs greatly outnumber the other DSRs in both fry1 mutants. d Genomic classification of 21-nt hyper DSRs in both fry1 mutants. Most 21-nt hyper DSRs in fry1 corresponded to rRNA and coding genes. e Number of DSGs in fry1 mutants compared to WT. The 21-nt hyper DSGs greatly outnumber other DSGs in both fry1 mutants. f Venn diagram for genes with rogue 21-nt sRNAs in fry1-6 and fry1-8. The overlap between the two sets is 193, which is significant based on a super exact test (P value = 0). g Proportion of 21-nt sRNAs from 21-nt hyper DSGs among all mapped sRNA reads. The Y axis indicates the proportion of 21-nt sRNAs from the combined 21-nt hyper DSGs in both mutants (228 DSGs) among the total mapped sRNA reads. h RNA gel blot validation of rogue 21-nt sRNAs from coding genes. Two genes with abundant 21-nt siRNAs, AT1G74100 and AT3G59940, were selected. Though there are bands in WT, the signals increase in fry1-6. i Venn diagrams for genes with rogue 21-nt sRNAs in fry1 and previously reported mutants. Except for xrn3-8, there was a significant overlap in genes between fry1 and the analyzed mutants. See Supplementary Data 3 for details. Source data are provided as a Source Data file
Fig. 4
Fig. 4
21-nt sRNAs derived from rDNA in fry1. a An IGV view of 21-nt sRNAs mapped to an rDNA locus on Arabidopsis chromosome 3. The red and blue bars represent the normalized read counts from the positive and negative strand, respectively; all Y axis ranges in the diagram are −200 to 200. The bottom diagram shows the rDNA locus with the features indicated by black text. The red and blue text indicates the target sites of probes used in this study from the positive and negative strands, respectively. b RNA gel blot validation of antisense 21-nt sRNAs derived from rRNAs. Three biological replicates consistently show the accumulation of siRNAs corresponding to the rDNA locus in fry1-6. The target sites of probes P6387 and P9469 are shown in a. c rRNA-derived sRNAs in xrn mutants. The rRNA-derived sRNAs were only detected in the xrn2 xrn3 mutant, but the signal intensity was still lower than that in fry1-6. This finding suggests that the rRNA-derived sRNAs are dependent on XRN2/3. d, e Abundance of endogenous miRNAs in xrn mutants. miR166 and miR398 (d) were reduced in fry1-6 and to a lesser extent in xrn2 xrn3. miR168 (e) increased in fry1 and xrn4 but was not affected by either the xrn2 or xrn3 mutation. Source data are provided as a Source Data file
Fig. 5
Fig. 5
Rogue 21-nt sRNAs are dependent on RDRs and DCLs for biogenesis. a Accumulation of rRNA-derived sRNAs in rdr and dcl mutants as determined by RNA gel blot assays. For the antisense sRNAs corresponding to the rDNA locus, rdr6-11 has a suppressive effect, while rdr2-1 has only a minor suppressive effect. dcl4-2 enhances the accumulation of longer sRNAs from these two loci, while in fry1-6 dcl2-1 dcl4-2, no accumulation of 21-nt or 22-nt siRNAs was detected. This indicated the antagonistic roles of DCL2 and DCL4 in siRNA biogenesis at these loci. b RNA gel blot assays to determine the abundance of coding-gene-derived sRNAs in rdr and dcl mutants. Unlike rRNA-derived sRNAs, these sRNAs largely depend on RDR1 for biogenesis. Besides, both DCL2 and DCL4 are required for the accumulation of coding-gene-derived sRNAs. Black arrows indicate the 21-nt sRNAs. cd Regions generating phased siRNAs in WT and fry1. At TAS genes TAS1A and TAS3 (c), phasing scores were slightly reduced in fry1. However, there are many phased regions from rDNA detected only in fry1 (d). Source data are provided as a Source Data file
Fig. 6
Fig. 6
Association of 21-nt risiRNAs with AGO1. a Length distribution of mapped reads from sRNA-seq of AGO1 IP in WT and fry1-6. The proportion of 21-nt reads in all mapped reads is slightly higher in fry1-6 than in WT. b Genomic classification of 100-bp bins with an enrichment of 21-nt sRNAs in AGO1 IP vs. input from WT and fry1-6. Although the numbers of bins corresponding to miRNAs and ta-siRNAs are similar between WT and fry1-6, those of bins corresponding to coding genes and rRNAs dramatically increased in fry1-6. The annotation was adopted from known genome features. c Distribution of 5′ nucleotides among 21-nt sRNAs derived from rRNA regions. In WT, a 5′-U preference was only observed among reads from the antisense strand in AGO1 IP, while in fry1-6, a 5′-U preference was observed among reads from both strands. This discovery suggests that the majority of sense reads in WT are not bound by AGO1, while those in fry1-6 can be loaded into AGO1. d Venn diagrams for genes with enriched 21-nt sRNAs. In AGO1 IP, most genes with enriched 21-nt sRNAs identified in WT were also identified in fry1-6. The 1224 genes in fry1-6 also included most of the 21-nt hyper DSGs identified in fry1. Source data are provided as a Source Data file
Fig. 7
Fig. 7
rdr6-11 partially rescues the fry1 phenotypes. a Genomic classification of 21-nt AGO1-associated sRNAs. In WT, miRNAs and ta-siRNAs constitute the majority of AGO1-associated 21-nt sRNAs. In fry1-6, there is a drastic increase in rRNA-derived siRNAs, consistent with the total sRNA composition. The rdr6 mutation results in a partial removal of risiRNAs and a concomitant partial restoration of miRNAs. The Y axis shows the cumulative RPM values for sRNAs corresponding to different genomic features. b The AGO1 loading efficiency of the 20 most abundant miRNAs in WT. The loading efficiency is represented by the ratio of RPM in immunoprecipitated samples to that in input. The efficiencies in WT and fry1-6 are significantly different based on a paired Wilcoxon test (P value = 0.001718). The efficiencies are recovered by the rdr6 mutation (fry1-6 rdr6-11 vs. fry1-6: P value = 0.003654; fry1-6 rdr6-11 vs. WT: P value = 0.114). c, d miRNA accumulation in rdr and dcl mutants. miR166 and miR398 are downregulated in fry1-6, and all three analyzed double mutants show slightly higher abundance of the miRNAs than fry1-6 (c). However, the increased abundance of miR168 in fry1-6 was still present in the double mutants (d). The internal control U6 snRNA was used to determine the relative miRNA levels. e Partial rescue of the fry1 phenotypes by rdr and dcl mutations. Plants shown are at 22 days after germination. rdr6-11 can partially rescue the mutant phenotypes of fry1-6. Meanwhile, DCL4 is necessary for the survival of fry1 mutants, probably due to the enhanced activity of DCL2 in dcl4-2. This was supported by the fry1-6 dcl2-1 dcl4-2 triple mutant. The restoration of leaf shape by rdr6-11 is shown by the enlarged leaves in the insets. Source data are provided as a Source Data file
Fig. 8
Fig. 8
A proposed model of FRY1 function in balancing siRNA and miRNA biogenesis in Arabidopsis. In WT plants (upper half of the diagram), FRY1 degrades PAP to ensure the activation of XRN2/3/4 function. XRNs degrade aberrant RNAs to prevent the biogenesis of rogue siRNAs. As a result, most AGO (AGO1 and AGO2) proteins are associated with miRNAs and function in miRNA-directed target regulation. In fry1 mutants (lower half of the diagram), PAP accumulates and inhibits XRN activity. The resulting aberrant RNAs, including mRNAs and rRNAs, are captured by the PTGS siRNA pathway. Rogue 21-nt sRNAs are generated from the aberrant RNAs by RDR1 and RDR6, respectively, and compete with miRNAs for AGO occupancy. The altered partitioning of AGO between miRNAs and siRNAs leads to reduced abundance of miRNAs

Similar articles

Cited by

References

    1. Liu L, Chen X. RNA quality control as a key to suppressing RNA silencing of endogenous genes in plants. Mol. Plant. 2016;9:826–836. doi: 10.1016/j.molp.2016.03.011. - DOI - PMC - PubMed
    1. Rogers K, Chen X. Biogenesis, turnover, and mode of action of plant microRNAs. Plant Cell. 2013;25:2383–2399. doi: 10.1105/tpc.113.113159. - DOI - PMC - PubMed
    1. Fei Q, Xia R, Meyers BC. Phased, secondary, small interfering rnas in posttranscriptional regulatory networks. Plant Cell. 2013;25:2400–2415. doi: 10.1105/tpc.113.114652. - DOI - PMC - PubMed
    1. Kurihara Y, Watanabe Y. Arabidopsis micro-RNA biogenesis through Dicer-like 1 protein functions. Proc. Natl Acad. Sci. USA. 2004;101:12753–12758. doi: 10.1073/pnas.0403115101. - DOI - PMC - PubMed
    1. Fukudome A, Fukuhara T. Plant dicer-like proteins: double-stranded RNA-cleaving enzymes for small RNA biogenesis. J. Plant Res. 2017;130:33–44. doi: 10.1007/s10265-016-0877-1. - DOI - PubMed

Publication types

MeSH terms